
An expected value analysis is a way of selecting the best course of action among several mutually exclusive (only one can be selected) alternatives.
Each alternative is evaluated based on its Probability, Dollar Impact, and initial Investment amount. Depending on the outcome desired, the alternative with the maximum or minimum Total expected value will be selected.
Businesses and the individuals that comprise them are faced with an infinite number of decisions throughout any given day. Whether we realize it or not, decisions are constantly being made which have varying degrees of impact.
We all know that big decisions can have a huge effect on our future. But, I believe, that chronic, everyday decisions can compound and end up having just as much of an impact.
An expected value analysis serves as a tool to help your company make rational decisions under a multitude of scenarios. Additionally, this analysis will allow your company to rationally calculate the expected dollar value of a particular decision.
Looking for more spreadsheet templates?
Expected value example and download
Complete the form below and click Submit.
Upon email confirmation, the workbook will open in a new tab.
Expected value worksheet
As a small business owner, you might, at this very moment, be facing an important decision.
Maybe you’ve got a great grasp on the situation. You understand all the variables and you understand the potential effects of every decision you might make.
Or maybe because you’re too busy with day-to-day operations, you only have a vague grasp on the situation. Particularly what the first, second, and third-order effects will be from the decision you make.
Using the expected value worksheet
This expected value worksheet will, hopefully, serve as a good example of this type of analysis. The inputs are simple enough.
First, you’ll enter each viable alternative (Decision) and the corresponding Investment amount. The most time-consuming part is to picture the different Scenarios and then make your best guess about the Probability and Dollar Impact of each.
As with all of the Spreadsheets for Businesses free example workbooks, all the complicated math is done for you. After you enter the Inputs and specify the Outcome desired, the Optimum decision is generated for you. All that’s left, for your part, is to qualify the decision by considering what non-quantifiable effects might have an impact. Unfortunately, a spreadsheet that can do that for you doesn’t exist – to my knowledge.
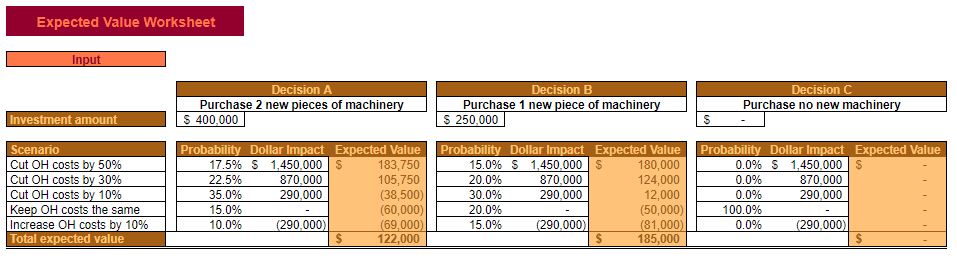
Input
This worksheet, compared to some of the others, is pretty short and simple. At least in terms of the amount of input needed. The operating budget, by contrast, required a lot of research and input by you, the user. Not so in the expected value worksheet.
Decisions
Not surprisingly, this analysis starts off with a listing of the decisions that are available to you.
Sometimes less is more. Not in this case. Here, more is more. At least as far as your viable alternatives are concerned.
Enter every viable alternative even if you hear a voice in your head saying “no way this is the right decision.”
Again, keep in mind that this analysis will choose one optimal decision for you. If it’s feasible to go half and half between two good decisions, then this is not the analysis you want to use.
Investment amount
Enter the Investment amount for each feasible Decision below the description.
Just as with capital budgeting, be sure to include every expense that your organization would incur as a result of making this Decision. Give this step an appropriate amount of thought. If the Investment amount is wrong then you run the risk of performing a faulty analysis.
If things come to light after you run the analysis that you weren’t aware of before, simply make the needed changes and run it again.
Scenario
Okay, here’s where you’ve got to get creative.
There are only five rows made available for Scenarios – but obviously the ability to add more exists. Without getting too “deep” there’s really an infinite number of Scenarios that could take place for any Decision. Well, we don’t have time for infinite. But you should certainly make time to be thorough.
Think through every Scenario that you can envision that might take place if you make one of the listed Decisions. Even if that Scenario has a 0% Probability of happening under one or more of the Decisions – still type it in.
A Scenario only has to have a small likelihood in one of the decisions to warrant being listed here.
Probability
Estimating the Probability of something happening is not a task that humans are inherently good at. So, don’t rack your brain too hard, or beat yourself up on this stuff.
Trust your gut, and know that you can go back and edit these percentages. In fact, you probably will – several times. There’s nothing wrong with doing so. In fact, the more you go over these percentages and make yourself comfortable with them (within reason) the better off your analysis will probably be.
It should maybe go without saying. But I’m going to say it anyway. All of your Probabilities for a given Decision need to equal 100%. There’s no wiggle room here because it’s simple logic. If your Probabilities are less than 100% then you need to add more Scenarios. If your Probabilities are over 100% then you need to either adjust your Probabilities or remove unfeasible Scenarios.
Dollar Impact
The Dollar Impact is the monetary effect on the organization that a particular scenario would have. The entire monetary effect.
Just as with the Investment amount you’ll want to make sure to include every single increase and decrease in revenues or expenses. Give this some deep thought, because these amounts play an important part in determining the (Total) Expected value.
Expected Value
(Dollar Impact – Investment amount) × Probability for every Scenario and Decision combination.
Really this is a pretty simple analysis if it’s laid out correctly. You’re simply looking at the potential gain or loss across all Scenarios for each Decision weighted by the Scenario’s individual Probability. That sounds more complicated than it actually is.
Total expected value
Total expected value is the sum of the Expected value for each Scenario and each Decision. Since every conceivable Scenario was included and serious thought it was dedicated to the Probability and Dollar Impact of each Scenario the Expected value should allow for a fair comparison of all Decisions.
Keep in mind that the Total expected value is not necessarily the actual amount of monetary gain or loss your organization would realize. It’s more of a weighted average.
Look at it this way – if I offered to pay you $100 if a coin flip came up “heads,” then the expected value of the coin flip for you would be $50. But, you’ll never get $50 exactly – you’ll either get $100 (50% chance) or $0 (50% chance).
(.5 × $100) + (.5 × $0) = $50.
That’s really all there is to it. If the goal is to maximize the expected value then the Decision with the biggest Total expected value wins. If the goal is to minimize expected value then, of course, the decision with the lowest Total expected value wins.
Output
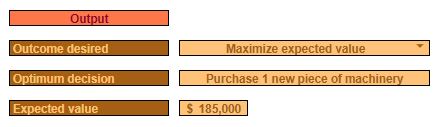
Due to the simplistic nature of this analysis, there’s really not much to exhibit in the Output section.
All that can be done is to display the results of the analysis in a simplistic, easy-to-read format plus include a chart for the sake of illustration.
Outcome desired
Outcome desired is a drop-down menu. You can choose one of two outcomes.
You can choose to “maximize expected value” or “minimize expected value.”
Depending on what you choose, the Optimum decision will probably change.
Optimum decision
As was just mentioned, the Optimum decision depends on the Outcome desired. If you chose “maximize expected value” then the Optimum decision will be the Decision with the highest Total expected value. Conversely, if you chose “minimize expected value,” then the Optimum decision will be the decision that has the lowest Total expected value. The description of the appropriate Decision will be displayed here
Expected value
This is simply the Total expected value from the Input section for the Optimum decision.
Expected Values Chart
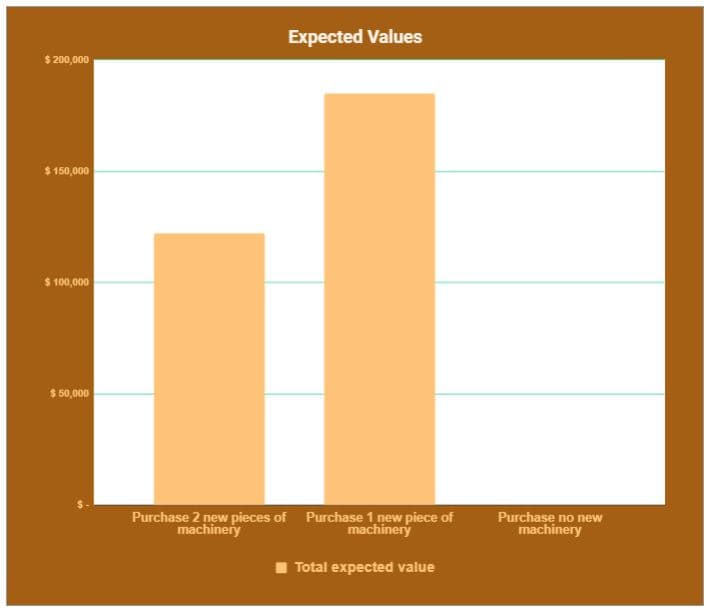
Like the analysis itself, the expected values chart is pretty simple and straightforward. Here you’ll see each Decision’s Total expected value compared side-by-side.