
| Contribution margin = | Unit sales price – | Unit variable costs |
|---|---|---|
| $52 = | $155 – | 103 |
| Break-even = | Allocated fixed costs ÷ | Contribution margin |
| 8,174 = | $425,000 ÷ | $52 |
Allocated fixed costs ÷ (Unit sales price – Unit variable costs) is how break-even is calculated.
A break-even analysis tells you what level of sales (unit or dollars) your small business must achieve in a given period to attain an operating profit of $0. Any sales beyond that should contribute to operating profit. A break-even analysis serves as a reality check. This is because it allows you to determine if demand and your sales acumen are adequate to achieve profitability.
Looking for more spreadsheet templates?
Download the break-even analysis example template
Complete the form below and click Submit.
Upon email confirmation, the workbook will open in a new tab.
What does break-even mean?
A break-even analysis is a calculation of how much in sales you need for your small business to avoid losing money.
A break-even analysis can determine the level of sales needed in either units or in dollars. From a practical standpoint, a break-even analysis in terms of units can only be done for individual products or services. This is because the typical small business will sell a variety of products and services. Any combination of different products/services could allow them to break even.
A break-even analysis can, however, be performed from a dollar sales perspective for the entire company.
The formula for a break-even analysis
As mentioned earlier, a break-even analysis is a calculation of how much in sales (units or dollars) is needed to break even (have zero dollars in profit/loss).
“But, shouldn’t every product/service be sold at a profit? So, the first unit, and every unit after, is profitable?“
Yes and no. It depends on how you look at it. Apologies for being flaky.
As alluded to another spreadsheet templates, costs can be categorized in several different ways. Maybe, the most important of which are fixed and variable.
Fixed costs are those that are deemed not to change. No matter the level of production. No matter how much is sold.
Variable costs, on the other hand, increase and decrease directly with production/sales.
In reality, most costs are not absolutely fixed or variable. But, rather, in the gray area in between. That, however, is beyond the scope of this post. For the purpose of an introduction to break-even analysis, you’ll just have to decide which costs you consider fixed and which you consider variable.
So, to answer your theoretical question:
Yes, your first sale is probably profitable. But…only under the assumption that you will make more sales. Specifically, enough sales to cover your fixed costs.
Once you have sold enough to cover your fixed cost, every sale after that contributes directly to operating profit.
All that being said here is the equation for a break-even analysis:
Break-even point in unit sales = Allocated fixed costs ÷ (Unit sales price – Unit variable costs)
Break-even point in dollar sales = Break-even point in unit sales × Unit sales price
Note that Unit sales price – Unit variable costs is also known as the contribution margin. As in, this is the contribution toward covering fixed costs.
Break-even analysis examples
First of all, let’s look at a break-even analysis for an individual product or service.
This particular product/service sells for $155. The variable cost per unit is $103. The amount of fixed costs allocated to this particular product/service is $425,000.
It’s important to note the amount of fixed cost allocated. This one product/service doesn’t need to cover all of the company’s fixed costs. Only its fair share. In the company-wide break-even analysis below we’ll consider all fixed costs.
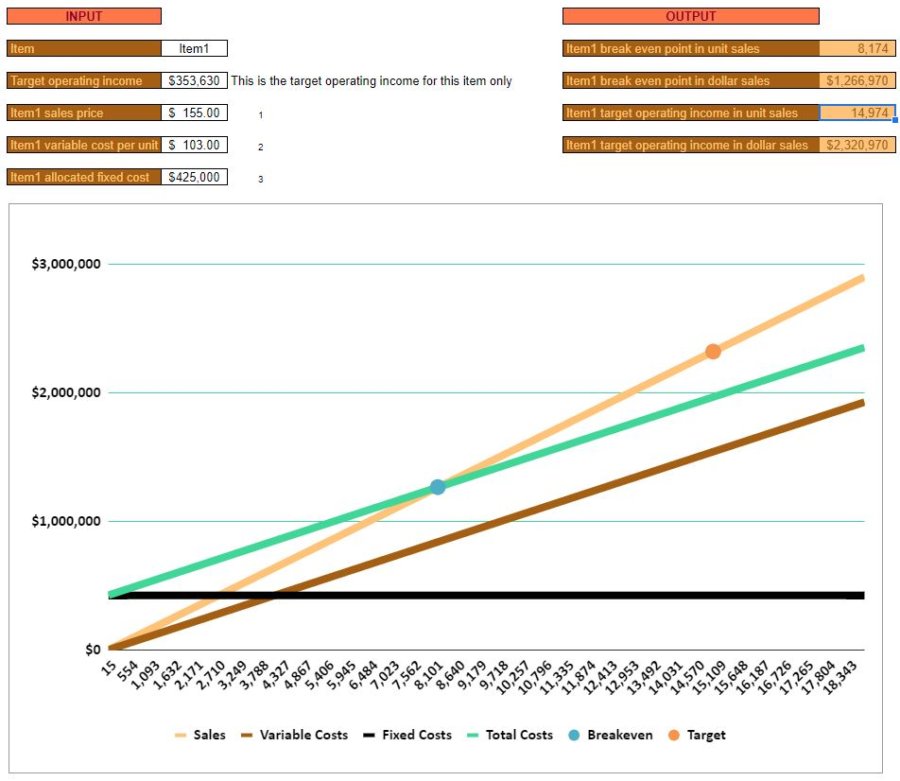
Anyhow, using our formula above, we know to calculate the following:
$425,000 ÷ ($155 – $103)
The contribution margin is $52 ($155 – $103).
So, the break-even point, in units, is 8,173.08. Or, 8,174 rounded up.
This puts the break-even point, in dollar sales, at $1,266,970 (8,174 × $155).
Next, let’s look at a break-even analysis for an organization as a whole.
This subject was also covered in the post on operating leverage. In particular, the potential benefits and detriments of high fixed costs.
The same principle applies for a break-even analysis for an entire company as it does for a particular product/service. The difference between sales and variable costs are measured against fixed costs. Once you’ve sold enough to cover fixed costs, you have broken even.
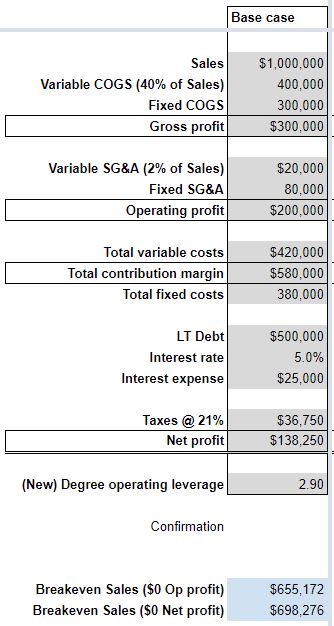
Let’s say our sample company expects $1,000,000 in sales. This level of sales should result in variable costs of $420,000. Additionally, the company expects $380,000 in fixed costs.
Break-even point in dollar sales (company) = Fixed costs ÷ (1 – (Variable costs ÷ Sales))
= $380,000 ÷ (1 – ($420,000 ÷$1,000,000))
Variable costs ÷ Sales = .42, or 42%. So, if variable costs equal 42% of sales, then we know that the contribution margin should be 58% (1 – 42%).
Therefore, if 58% of every sale is going towards fixed cost we can divide $380,000 ÷ .58 to arrive at a break-even of $655,172.
What to do with a break-even analysis information
Now, you know how many units of a particular product/service you must sell in order to break even. You also know how much in overall sales you must have to break even. It’s up to you to decide how feasible achieving those levels are.
Beyond that, you can use the same basic formula to determine what’s needed to achieve bigger goals.
Simply add your Target operating income to Fixed costs in the formula above and solve as you normally would. This is demonstrated further in the downloadable break-even analysis example template ▲.
Things to keep in mind about a break-even analysis
First, and foremost, break-even analysis is a theoretical exercise. As I said earlier, not every dollar contribution margin is going to go straight to paying fixed costs. Fixed costs are typically spread out over the course of the year – in even increments.
A break-even analysis just gives you an idea of what levels of sales, approximately, you will need to achieve in order to turn a profit. It is based, somewhat, on forecasting costs, and therefore typically won’t be precisely accurate.
Additionally, as preached about many times on this site, sales and cash flow can be two very different things.
You might have items with high contribution margins that look to break even early in the year. But, that says nothing about the timing of cash received from sales. Or cash paid for expenses.
If these two things fall out of harmony, your business could experience hardship. No matter how healthy your contribution margin is. I would suggest that you review the financial budgeting (cash flow) spreadsheet template to make sure you can be proactive about any cash flow issues.
Finally, as touched on in the operating leverage post, the amount of fixed costs you have can help your small business or hurt it.
Low fixed costs might mean that the hurdle your business needs to clear is low. Therefore, you can break even sooner.
But, that might also mean that you have a higher percentage of variable costs. A higher percentage of variable costs will mean that less contribution margin goes to the bottom line after those fixed costs are covered.
Conversely, if fixed costs are high, the hurdle is high.
But, once that hurdle is cleared (and if your contribution margin is healthy) then a big percentage of every sale thereafter will go to net income.