
Comparing actual sales and expenses to budgeted amounts can provide valuable insight into your business’ strengths and weaknesses.
As I’ve highlighted before on this site, I feel the budgeting is important. However, it’s not just going through the motions of budgeting that’s important. It’s what you do with that information it really matters.
Comparing actual results with budget amounts is what ultimately provides value. By comparing and analyzing the difference between your budget vs. actual amounts, you’ll know what demands your attention.
Depending on your level of sophistication you can look at budget vs. actual amounts from a very high-level. Or, you can delve into details. Peel back the layers of the onion, so to speak. By doing so, you can find problems or opportunities that you might not have found otherwise.
Looking for more spreadsheet templates?
Download the Budget Vs. Actual Spreadsheet Template
Complete the form below and click Submit.
Upon email confirmation, the workbook will open in a new tab.
A refresher on budgets
As touched on in the small business spreadsheet templates page, there are three types of budgets. The capital budget, the operating budget, and the financial budget.
For the purposes of this analysis, we will be analyzing the operating budget. The operating budget is a forecast of the coming year’s sales and expenses.
If you read the operating budget page, you’ll notice that the operating budget is actually comprised of several smaller budgets. The smaller budgets include the sales (revenue) budget, materials budget, labor budget, and the overhead budget. Each of these sub-budgets can be examined for variances – if so desired.
What does variance mean?
Variance is a fancy term for the difference between something and something else. In this case, it means the difference between the budgeted amounts and the actual amounts of sales and expenses.
For example, if you had budgeted $300,000 in sales for the year, but ended up achieving $400,000 in sales, you would have a favorable variance of $100,000 (+33%).
Another example – if you had budgeted $100,000 in material costs for the year, but had $110,000 in material costs, you would have an unfavorable variance of $10,000 (-10%).
Different types of variances
As I said earlier, variances can be broken down to provide further insight into what drives them.
For instance, was it unit volume, or price, that was responsible for a variance in budgeted revenue? The answer, most likely, is that it was a combination of both. But, until you measure the variances, you’ll never really know.
Below, is a quick breakdown of all the different types of variances that can be analyzed by comparing amounts from the operating budget to actual results.
See these variance analyses in action by using the spreadsheet template from above.
Flexible budget variances
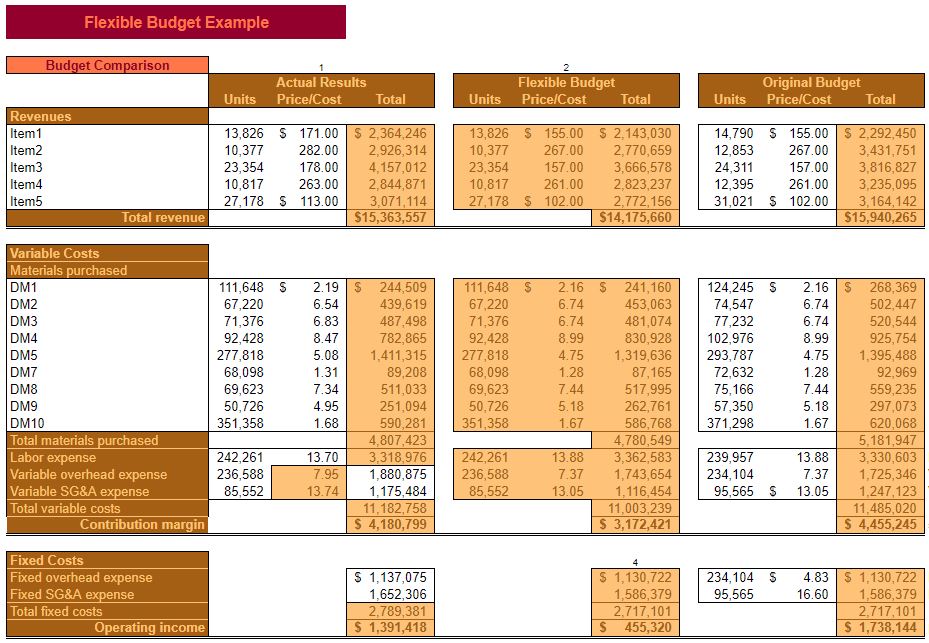
The Flexible budget takes Actual units (hours) × Original budget prices (costs, rates).
Flexible budget variance = Actual amounts – Flexible budget amounts. This is a price/cost variance.
Sales volume variance = Flexible budget amounts – Original budget amounts. This is a unit/quantity variance.
Actual budget variance = Actual amounts – Original budget amounts.
Revenue variances
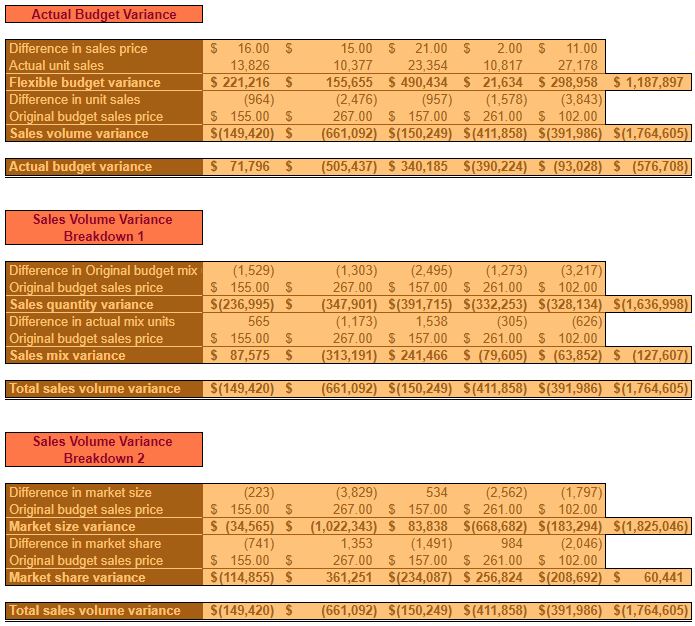
Flexible budget variance = (Actual sales price – Original budget sales price) × Actual unit sales. This is the impact on total sales due to a difference in item sales prices.
Sales volume variance = (Actual unit sales – Original budget unit sales) × Original budget sales price. This is the impact on total sales due to a difference in units sold.
The Sales volume variance can be broken down further. Though, the calculation tends to get a bit more complicated.
Sales quantity variance = ((Actual total unit sales × Original budget mix percentage) – Original budget unit sales) × Original budget sales price. This is the impact on total sales due to total unit sales.
Sales mix variance = (Actual unit sales – (Actual total unit sales × Original budget mix percentage)) × Original budget sales price. This is the impact on total sales due to a difference in mix percentage.
Sales quantity variance + Sales mix variance = Sales volume variance.
Market size variance = ((Actual market size – Original budget market size) × Original budget market share) × Original budget sales price. This is the impact on total sales due to a difference in market size.
Market share variance = (Actual market size × (Actual market share – Original budget market share)) × Original budget sales price. This is the impact on total sales due to a difference in market share.
Market size variance + Market share variance = Sales volume variance.
Material variances
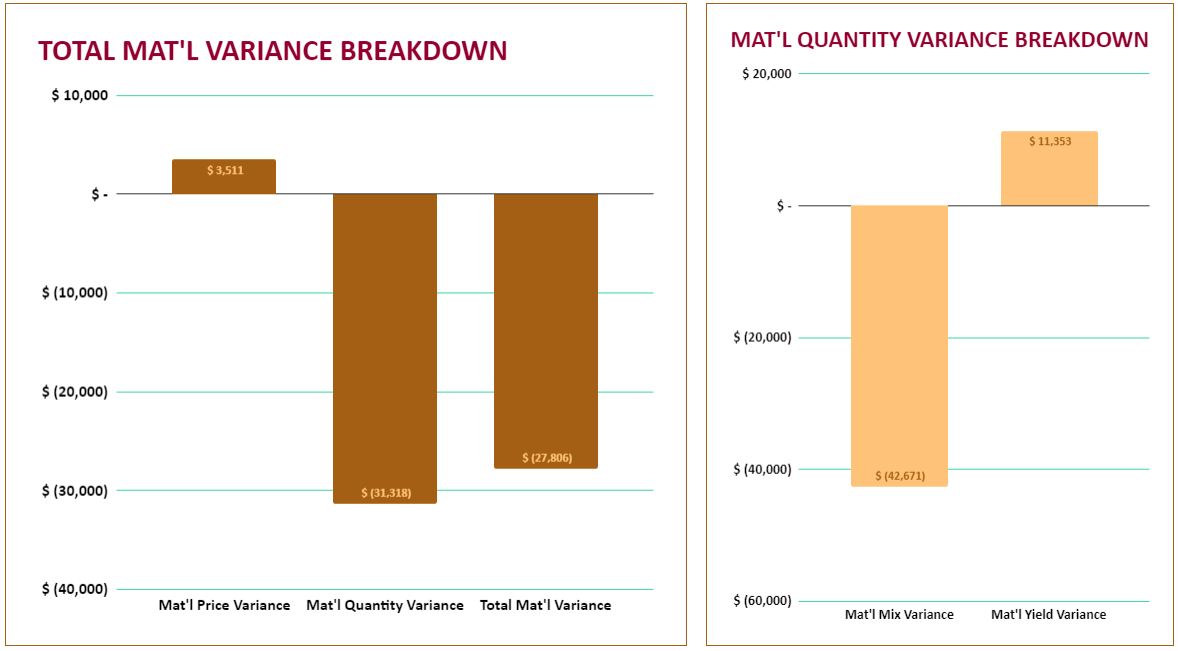
Material price variance = Actual amounts – Flexible budget amounts. This measures the difference in material costs due to the amount paid for materials consumed.
Material quantity variance = Flexible budget amounts – Original budget amounts. This measures the difference in material costs due to the quantity of materials consumed.
Total material variance = Material price variance + Material quantity variance. This measures the difference between Actual material costs and those on the Original budget.
The Material quantity variance can be broken down further. Again, the calculation of these variances gets a little more complicated.
Material mix variance = Actual total input × (Actual mix – Budgeted mix) × Budgeted cost. This is the impact on the material quantity variance due to a difference in the mix of materials consumed.
Material yield variance = (Actual total input – Budgeted total input) × Budgeted mix × Budgeted cost. This is the impact on the Material quantity variance due to a difference in the Budgeted and Actual total input (total quantity of materials consumed).
Labor variances
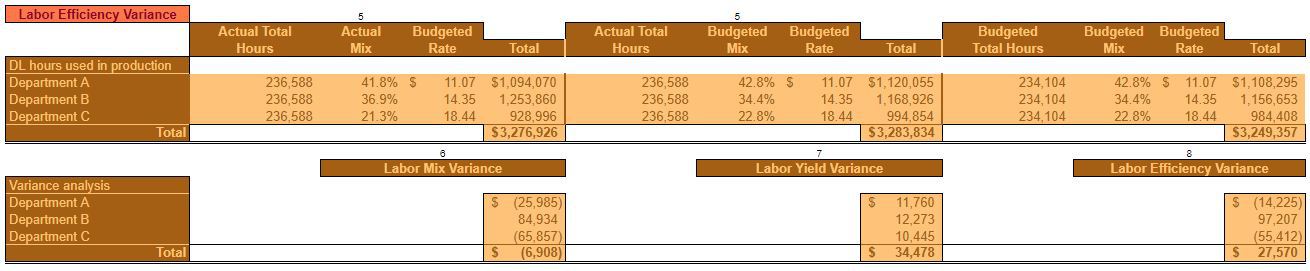
Labor rate variance = Actual amounts – Flexible budget amounts. This measures the difference in labor costs due to the rate paid for labor used in production.
Labor efficiency variance = Flexible budget amounts – Original budget amounts. This measures the difference in labor costs due to the hours used in production.
Total labor variance = Labor rate variance + Labor efficiency variance. This measures the difference between actual labor costs and those on the original budget.
The labor efficiency variance can be broken down further. Again, the calculation of these variances gets a little more complicated.
Labor mix variance = Actual total hours × (Actual mix – Budgeted mix) × Budgeted rate. This is the impact on the Labor efficiency variance due to a difference in the mix of laborers used in production.
Labor yield variance = (Actual total hours – Budgeted total hours) × Budgeted mix × Budgeted rate. This is the impact on the Labor efficiency variance due to a difference in the Budgeted and Actual total hours (total number of hours used in production).
Overhead variances

Variable overhead spending variance = Actual amounts – Flexible budget amounts. This measures the difference in variable overhead costs due to the rate applied in production.
Variable overhead efficiency variance = Flexible budget amounts – Original budget amounts. This measures the difference in variable overhead costs due to the labor hours (or another allocation method) used in production.
Total variable overhead variance = Variable overhead spending variance + Variable overhead efficiency variance. This measures the difference between Actual variable overhead costs and those on the Original budget.
Fixed overhead spending variance = Actual amounts – Original/flexible budget amounts. This measures the difference in fixed overhead costs incurred and the budgeted amounts. Remember, that the Original and Flexible budgets have the same amount of fixed overhead because fixed expenses should be the same no matter the level of activity.
Fixed overhead production volume variance = Original/Flexible budget amounts – Allocated fixed overhead. This measures the difference between the actual amount of fixed overhead applied and the amount originally budgeted.
Getting to the bottom of variances
Though the variances can be broken down into detail, the work isn’t done yet. Analyzing variances in this manner only helps you to narrow your search for the cause.
If variances unusually large, you should investigate what’s driving them. The term “management by exception” refers to the management of instances where results deviate wildly from what was expected.
In the case of favorable variances, ask: “Is this an opportunity that can be expanded upon?” In the case of unfavorable variances, ask: “Is this indicative of a bigger problem? Can you isolate what the problem is, and ascertain what’s within your power to solve it?
Furthermore, besides allowing you to focus your efforts on the most impactful aspects of your business, a variance analysis will improve your future budgeting. Through management by exception, you’ll come to have a greater understanding of what drives your revenue and expenses. Therefore you should be able to make better forecasts going forward. Which should translate into a better overall strategic plan.