
Process costing is a means of accounting for
Process costing allows your organization to logically apply costs to items that are continuously mass-produced. The application of costs in this manner facilitates period to period comparisons.
Looking for more spreadsheet templates?
Process costing example and download
Complete the form below and click Submit.
Upon email confirmation, the workbook will open in a new tab.
Process costing workbook
This workbook serves as a simplistic example of how a process costing system might work. In this hypothetical scenario, the organization has three departments (A, B, and C). Each product must work its way through the departments, in that order, to become a finished good. Departments A, B, and C might be something like assembly, finishing, and packaging.
In each department, direct materials are added, labor is expended, and overhead is applied to the cost. Additionally, at the end of the period, each department will have a certain amount of WIP (work-in-progress) that also needs to be accounted for.
As far as inputs go, there aren’t many to worry about. All that’s needed is WIP balances for each department, the number of units started, and the direct material, direct labor, and overhead cost information from the operating budget. With this information, an Average cost per unit for the given period can be calculated. This allows the organization to know the profitability of each product.
Data Input worksheet
As with job order costing, you would be encouraged to refer to the operating budget as a reference for your company’s standard direct material, direct labor, and overhead costs. The average for the whole year can be used. Or, the expected amount for the month in question can be used.
Don’t worry about using actual costs here. Actual cost will be compared to the standard cost in the performance measurement workbooks.
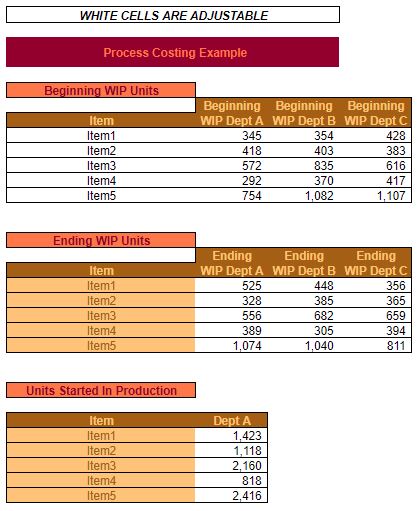
Beginning WIP Units
Beginning WIP units are the number of units that have been started, but not finished, at the beginning of a given month. Of course, the Beginning WIP Units for this month will be the same as the Ending WIP Units for the previous month.
Here, each item is listed. Then the quantity of finished goods (not the raw materials) that’s been started within each department is entered.
Ending WIP Units
As you probably guessed, Ending WIP Units is the number of finished goods, by department and item, that were started the previous month but not completed.
Even without making any calculations, you can look at this information and see whether your WIP balances have increased or decreased. An increase in WIP might indicate that you have more tied up in inventory this month than the previous. It might also indicate problems with efficiency in a given department (i.e. units aren’t being completed as quickly as you would hope).
Units Started In Production
This is the total number of finished goods for which production began in the previous month.
In this example, you’ll notice that only Dept A is listed. Why is that? Because, all finished goods move through departments A, B, and C, in that order. Therefore, it only matters how many units were started in Dept A. The amounts started for the remaining departments can be ascertained from the information entered in the Beginning WIP Units and Ending WIP Units sections.
Direct Material Cost Per Unit
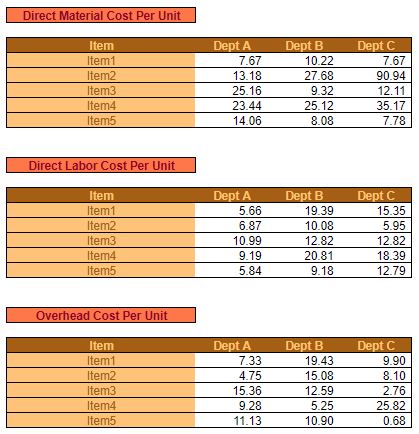
As mentioned earlier the Direct Material Cost Per Unit should come from your operating budget. Typically you would use your standard cost for the entire year.
Again, keep in mind that this is the cost for your direct materials that would be added within each department. So the amounts won’t be the same across all departments. Because, depending on each department’s role, more or less expensive materials might be added during a given step in the production process.
Obviously, direct materials can contribute in large part to the cost of the finished good. Particularly in a manufacturing environment. So, quality information is needed here.
Direct Labor Cost Per Unit
This is the total cost of direct labor applied to a finished good by a specific department.
The amount entered here will depend on the cost per hour of direct labor, the crew size within each department, and the number of units that can be finished (per hour) within each department.
So, depending on the process taking place within each department, the Cost Per Unit of Direct Labor could vary widely. If the labor is highly specialized, then the cost per hour could be very high. Conversely, if the labor is not highly skilled, then the cost per hour might be pretty low.
The crew size will also depend on the nature of the labor. If it’s the sort of thing that can only be done by a human – then the crew size might be larger. Conversely, if a machine does most of the work and only requires that a human oversee it – then a crew size of one might be all that’s needed.
Finally, the amount of time needed for a particular department to do what it needs to do to move the unit on to the next department could vary. Some things can be done quickly. Others might take a long time. Not necessarily because of a lack of skill or manpower. But, because it’s just the nature of the department’s operations.
For example, let’s think about chemical or food manufacturing. If a recipe needs to be blended for an hour, it doesn’t matter who’s overseeing the blending or how skilled they might be at chemistry. It’s going to take an hour regardless.
Keep in mind when filling out these fields, that the sum of the Direct Labor Cost Per Unit across all three departments should equal the same amount for the entire unit, from your operating budget.
Overhead Cost Per Unit
Finally, the last major piece of information needed is the Overhead Cost Per Unit. Just as with Direct Labor Cost Per Unit, the total across the three departments should equal the total Overhead Cost Per Unit that you forecasted in your operating budget.
In this example, just as with the job order costing example, we are assuming that overhead is applied on the basis of direct labor hours. However, if you allocate overhead differently that’s perfectly fine. Because, here, all you’re doing, is taking that total amount of overhead per unit and assigning it to each individual department. Whether you do so based on the number of man-hours each department spends on each item, or some other means, doesn’t matter. As long as all overhead is accounted for.
With Overhead Cost Per Unit entered, all of the components of cost of goods sold are compiled. This means that most of the information needed to calculate cost is entered.
Dept worksheets
Each department worksheet for departments A, B, and C are formatted in pretty much the same manner. One exception is Dept A. Here, you’re able to select from a drop-down list of the different items entered in the Beginning WIP Units section of the Data Input worksheet. Dept A also doesn’t have an Amount transferred from Dept _ field. Because…it’s the first department. The item you select in the drop-down menu will also carry over to the Summary worksheet.
Whenever you select a different item, you’ll see all of the information change on the Dept _worksheets and the Summary worksheet. This allows you to evaluate each item’s performance as it works its way through the value chain.
The only information that need be entered on these worksheets is the WIP percentage complete for direct materials and direct labor. This will be covered below.
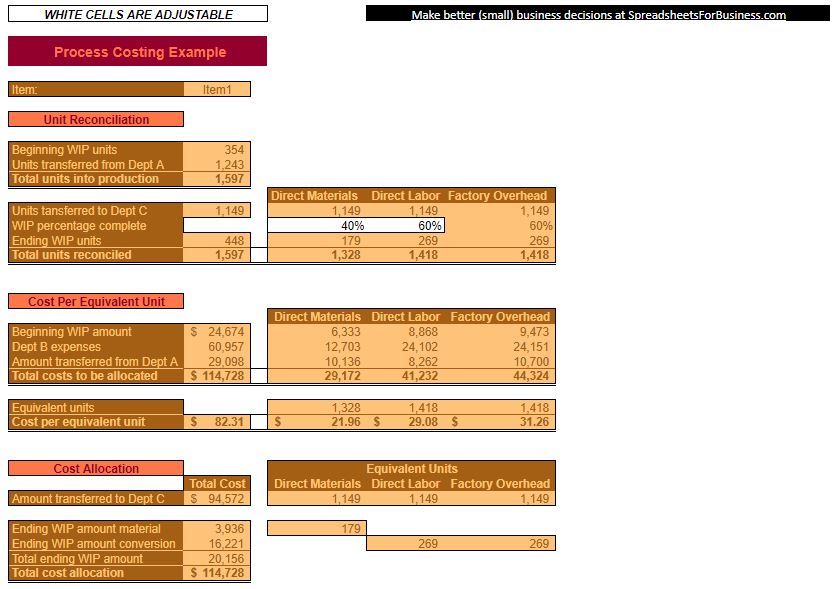
The purpose of these Dept _worksheets is to translate Beginning WIP balances and the expenses incurred for production (in a given month) into expenses transferred to the next department and Ending WIP balances.
There are two primary methods used in process costing. The weighted average method. Which is what is used in this example workbook. And, the first-in-first-out (FIFO) method. The difference between these methods is beyond the scope of this explanation. The focus here is more on process costing in general and how it differs from job order costing.
Unit Reconciliation
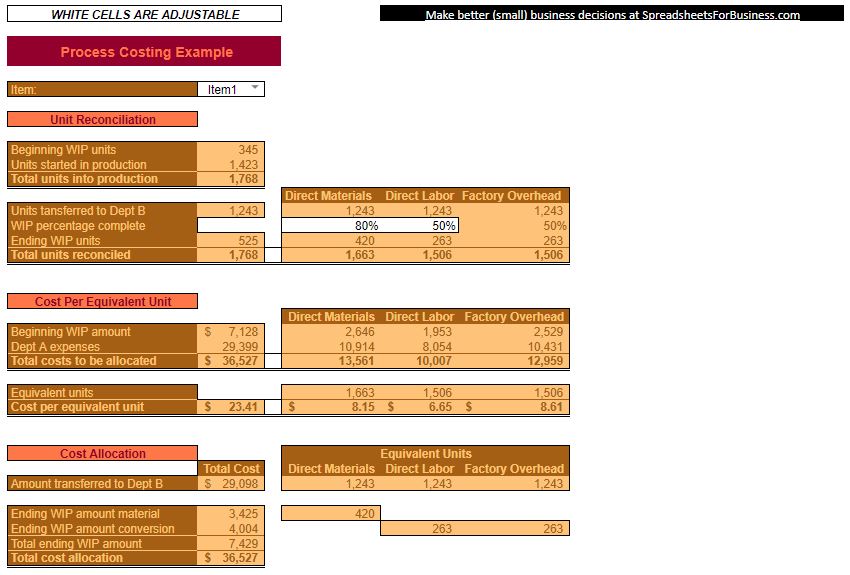
The Unit Reconciliation section is where the company double-checks itself to make sure that the Total units into production in the Total units reconciled match each other. By attempting to arrive at the same quantity in two different ways, you can be sure that the quantity is correct.
Beginning WIP units & Ending WIP units
These two fields pull from the corresponding sections in the Data Input worksheet. For each item and department combination, you should see the same quantities that are entered on the Data Input worksheet.
Units started in production & Units transferred from Dept _
For Dept A, the Started in production quantities will also pull from the Data Input worksheet. For each item, you’ll see these quantities match up with the Units Started In Production section.
Again, in this example, items work their way through the value chain via Depts A, B, and C – in that order. So, units can only be Started in production into Dept A.
For Depts B and C, the quantities will be transferred from Depts A and B, respectively. The quantity transferred from a particular department is the same that was transferred to that same department on the previous worksheet.
Total units into production
This is the sum of the Beginning WIP units and the number of Units Started In Production (or Units transferred from Dept _).
This quantity tells you how many units were partially started at the beginning of the period, and how many brand new units were transferred into the department.
Units transferred to Dept _ & Units transferred to finished goods
Total units into production – Ending WIP units
Intuitively we can determine that any units that were entered into production and were completed (not in Ending WIP units at the end of the month) were transferred on to the next department. Or in the case of Dept C, the items were completely finished and transferred into finished goods inventory.
WIP percentage complete
Next, we’ll breakdown Ending WIP units by Direct Materials, Direct Labor, and Factory Overhead.
For Direct Materials enter the percentage complete you think the Ending WIP units are – only in terms of materials. Not Direct Labor and Factory Overhead.
If you’re working with a high volume of units, this will have to be an estimate and will be pretty subjective. You might have software sophisticated enough to estimate this percentage for you. If so, you’re probably not using a spreadsheet for your costing system. Since you’re reading this, you’ll probably have to make the estimate yourself.
Remember to estimate the percentage complete based off of value, not quantity. For example, let’s look at Item 4. If the total value of the Direct Materials added in Dept A is $23.44 and approximately $14.07 worth of materials have been added (on average) at month-end. Then you would enter 60% for the WIP percentage complete under Direct Materials.
Direct Labor is handled in a similar manner. Think about the number of man-hours needed to complete an item. Then, estimate how many of those man-hours have been committed toward the items left in WIP at the end of the month.
For example, if, on average, you feel like half of the necessary man-hours have been committed to WIP for a given department and item combination, then you would enter 50% as the WIP percentage complete.
These percentages can be a little tough to wrap your head around. You’re probably wondering why they’re necessary. The reason these amounts are needed will become apparent as we move on to the Cost Per Equivalent Unit and Cost Allocation sections.
Cost Per Equivalent Unit
The concept of an Equivalent unit is important in a process costing system. Equivalent units were determined in the Unit Reconciliation section, based on the percentages entered for the WIP percentage complete field.
An Equivalent unit is basically how much of work in progress you’ll consider whole, complete units, for the purposes of accounting. For example, if 1,000 units are in WIP and are considered 50% complete, then we would say that the department has 500 Equivalent units.
Beginning WIP amount
The Beginning WIP amount for Direct Materials, Direct Labor, and Factory Overhead is equal to the Beginning WIP units × the Cost Per Unit for the given department entered on the Data Input worksheet.
The sum of those amounts equals the total Beginning WIP amount entered in column C.
This is the total (eventual, once the units are 100% complete) value of the work in progress that the department began the month with.
Dept _ Expenses
Units started in production × Direct Materials, Direct Labor, or Factory Overhead Cost Per Unit (from the Data Input worksheet) for a given item in a given department.
This is the dollar value for all units that were started in production for the month. When added to the value of the Beginning WIP units, you have a total amount of costs to be allocated.
Total costs to be allocated
This is the amount that must be reconciled below, in the Cost Allocation section. If your process costing system is set up correctly this amount should reconcile automatically – as it does in this process costing workbook.
Equivalent units
Remember, Equivalent units are the proportion of WIP that will be considered completed based on the WIP percentage complete. This quantity is only conceptual and is calculated for the purposes of accurately costing within a process system. The quantities for Equivalent units are pulled from above (Total units reconciled).
Cost per equivalent unit
Total costs to be allocated ÷ Equivalent units
The Cost per equivalent unit is calculated for Direct Materials, Direct Labor, and Factory Overhead. These individual amounts are then summed to calculate a total Cost per equivalent unit.
The quantities in Beginning and Ending WIP units entered on the Data Input worksheet and the percentages entered for WIP percentage complete will have a big effect on the Cost Per Equivalent Unit.
The higher the WIP percentage complete, the lower the Cost Per Equivalent Unit. This is because the costs incurred are spread across more units.
The higher Beginning WIP units, the lower the Cost Per Equivalent Unit will be. This is because, everything else being equal, more units were transferred to the next department. More units with the same amount of cost equal a lower cost per unit.
On the other hand, the higher the Ending WIP units, the higher the Cost Per Equivalent Unit will be (again, all things being equal). If Ending WIP units is higher, then fewer units were transferred to the next department. Fewer units with the same amount of cost equal a higher cost per unit.
Cost Allocation
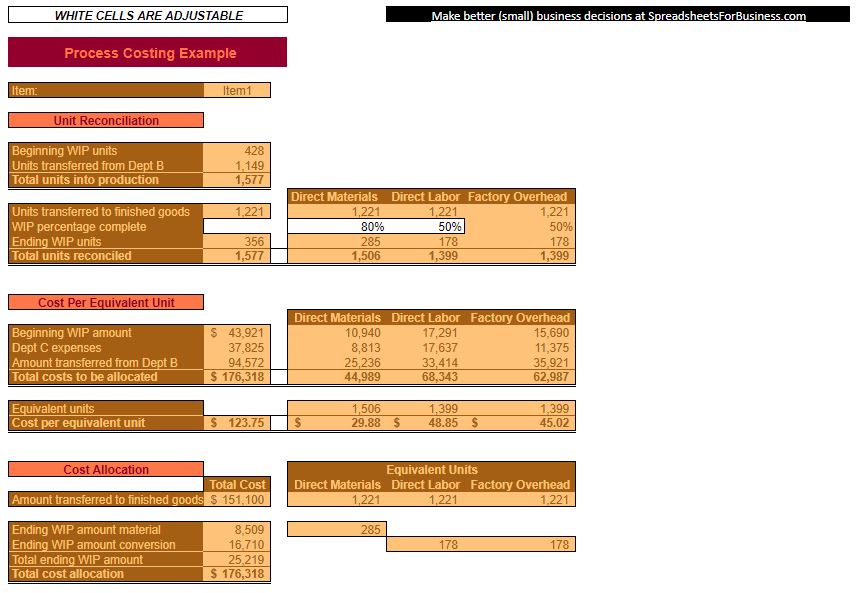
In the Cost Allocation section, costs will be allocated between what was transferred to the next department (or finished goods in the case of Dept C) and what will be included in the ending WIP amount.
Amount transferred to Dept _
(Equivalent) Units transferred to Dept _ × Cost per equivalent unit
Of course, Units transferred to Dept B will be the same as Units transferred from Dept A. Likewise, Units transferred to Dept C will be the same as Units transferred from Dept B. Also, remember that which is transferred out of the Dept C is transferred to finished goods.
Ending WIP amount material
Direct Materials Cost per equivalent unit × Direct Materials Ending WIP units
This is the value of the Equivalent units in Ending WIP based on the WIP percentage complete. Along with the Ending WIP conversion amount, this will make up the Total ending WIP amount for a given item in a given department
Ending WIP amount conversion
(Direct Labor Cost per equivalent unit + Factory Overhead Cost per equivalent unit) × Direct Labor/Factory Overhead Ending WIP units
This is the value of the Equivalent units in Ending WIP based on the WIP percentage complete. Along with the Ending WIP material amount, this will make up the Total ending WIP amount for a given item in a given department.
Total ending WIP amount & Total cost allocation
Here are the individual equations:
Total ending WIP amount = Ending WIP material amount + Ending WIP conversion amount
Total cost allocation = Amount transferred to Dept _ + Total ending WIP amount
Keep in mind that Total cost allocation should match the Total costs to be allocated from the Cost Per Equivalent Unit section. In these worksheets, they are set up to automatically match. So, if they don’t match then you know that you have a mistake somewhere.
The whole point of this worksheet is to calculate how much in costs needs to be allocated. That is done by taking the Beginning WIP amount and adding the expenses incurred by the department during the month.
Those costs either get transferred to the next department or stay in the Ending WIP amount. All costs have to be allocated because they don’t just disappear into thin air.
Summary
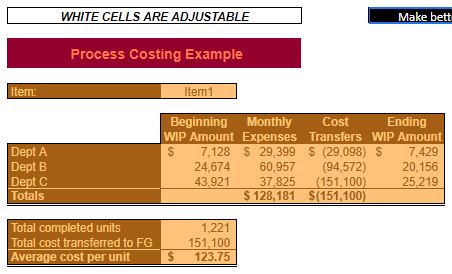
This is where all the information from the Data Input worksheet and the Dept _ worksheets is brought together to give you an Average cost per unit for a given item.
It allows you to see how balances changed in each department for a given item in a given month. The Average cost per unit can be compared to a standard cost or to the Average cost per unit and other months.
The Average cost per unit should approximate the sum of Direct Materials, Direct Labor, and Overhead across all Dept’s entered on the Data Input worksheet. It won’t match exactly, however. Because, remember, depending on the WIP percentage complete, the Cost per equivalent unit could change. Also, the balance’s in Beginning and Ending WIP units can have an effect on the Cost per equivalent unit.
Beginning WIP Amount
The Beginning Balance will match the Beginning WIP amount for every Dept for the item displayed.
You’ll notice, of course, that this amount increases for every subsequent Dept. This is due to the fact that costs are compiled in every department in the form of materials, labor, and overhead.
Like all the rest of the information on this worksheet, you can compare these amounts to previous months. Thereby allowing you to know whether a given department is starting the month with an abnormally high or low WIP amount. Knowing this allows you to investigate why that might be.
Monthly Expenses
Monthly Expenses also pulls directly from each department’s worksheet. The amount listed here will match the Dept _ expenses amount under the Cost Per Equivalent Unit section.
As a reminder, the Dept _ expenses are the sum of Direct Materials, Direct Labor, and Factory Overhead Cost Per Unit × the Units started in production for that month.
Monthly Expenses are totaled across all Dept’s for a given item. This amount isn’t used in any other formula. It’s simply totaled for the sake of reference.
Cost Transfers
This is equal to the Amount transferred to Dept _ amount from the Cost Allocation section for each department.
You’ll notice that this amount increases (technically decreases, since it’s a negative amount) for each successive Dept. As mentioned earlier, this is because there are expenses added to the cost in each department via Direct Materials, Direct Labor, and Factory Overhead.
The Total is important because it’s the amount used to determine the Average cost per unit. You’ll notice that the Total is equal to the
Ending WIP Amount
The Ending WIP Amount is equal to the Total ending WIP amount in the Cost Allocation section for each Dept.
This is the value of inventory in Ending WIP for a given item in each department. This isn’t used in any further calculations it’s just there for comparison against prior months and against the Beginning Balance.
Total completed units
Total completed units are the number of units transferred out of Dept C to finished goods. This will equal the quantity entered in the Units transferred to finished goods field under the Unit Reconciliation section in the Dept C worksheet.
This is the number of units that were completely finished during the month. They will have no additional cost accumulated and are ready for sale. This quantity will be used as the denominator when calculating Average cost per unit.
Total cost transferred to FG
Total cost transferred to FG is equal to the
This includes all costs accumulated in Dept’s A, B and C. This is a grand total of costs for a given item. No other cost will be accumulated. Therefore this will be the amount used as a numerator when calculating Average cost per unit.
Average cost per unit
Total cost transferred to FG ÷ Total completed units
As mentioned earlier, this amount could differ from the total cost, by item, entered in the Data Input worksheet. This is due to the effects of the WIP percentage complete for each Dept. it is also due to the Beginning and Ending WIP units balances.
Of course, a manufacturing company, such as the one outlined in this example, would want to compare the Average cost per unit to their budgeted cost per unit from the operating budget. It would also want to compare it to previous months. Such comparisons allow for management by exception. A situation where abnormally high or low costs can be investigated.
Departmental Expense Breakdown chart
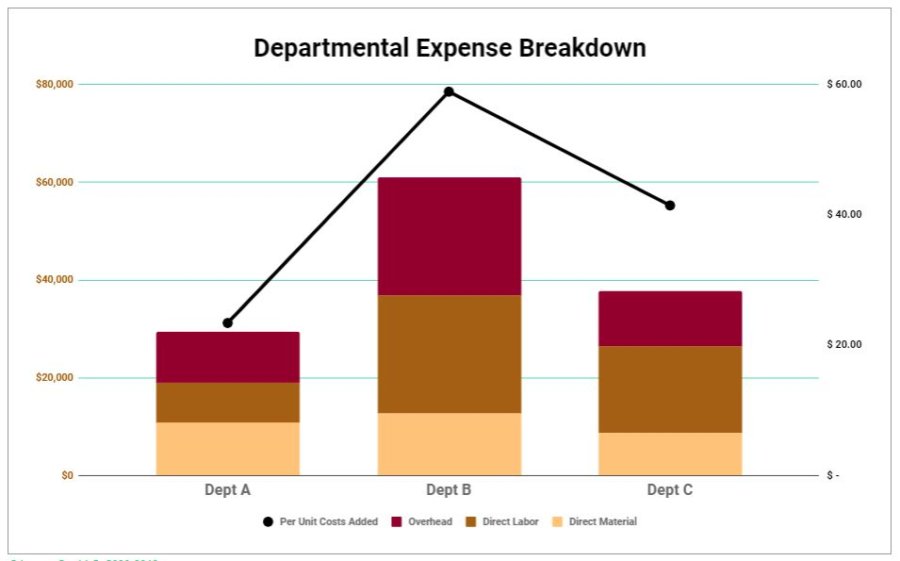
This chart is a visualization of the costs that make up the Monthly Expenses for each Dept for a given item.
Additionally, the Per Unit Costs Added is charted on the right axis. If you bother to add up the Per Unit Costs Added (the black line) for each department you’ll notice that those costs equal the Average cost per unit, shown above.
This chart also allows the manager to see how expenses compare across departments and what comprises the Total Monthly Expenses.