
We u
The underlying theory of ABC is that activities drive costs. Demands upon those activities warrant the allocation of costs.
ABC will provide your organization with a much clearer understanding of the costs incurred to bring your products to market. If you want insight into which products and services are most profitable, consider conducting an ABC analysis.
Looking for more spreadsheet templates?
Activity-based costing example and download
Complete the form below and click Submit.
Upon email confirmation, the workbook will open in a new tab.
Activity-based costing workbook
Some of the information needed for an ABC costing system, you will already have handy. For instance, sales information and direct costs.
Other information, however, could be very subjective. That means that there might not be any definitive “right” way to allocate these costs. It might mean that you have to make an educated guess in some instances.
That’s okay. This analysis is a work in progress for your company. You can always come back to it and make changes. Use the best information you have available right now to make the best decisions you can. When better information comes to light – you’ll make even better decisions.
The biggest benefit comes from dedicating a bit of thought to these subjects and taking action
Activity Information worksheet
The Activity Information worksheet is where you enter the details about the activities. The activities that drive costs.
The Activity Information worksheet pulls some information from the Item Information worksheet. The Item Information worksheet pulls some information from the Activity Information worksheet. So, it doesn’t really matter which you fill out first.
The Cost Breakdown by Activity section is the backbone of an activity-based costing system. It’s where you will allocate costs across the activities that are necessary to procure and deliver your products and services to your customers.
Include all of your costs here. Give careful thought to the activities and the allocation of costs to those activities. This workbook, and others like it, can give you a good framework to work in. However, an ABC system won’t give you as much of a cut-and-dry, this-cost-goes-here-and-that-one-there, guidance.
A lot of this is completely up to your discretion. So, feel free to go with your gut and then come back as needed to tweak the numbers.
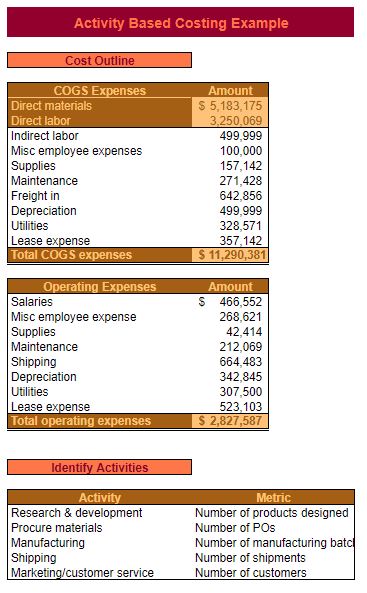
Cost Outline
Here, you will enter the total expenses over the past year in each major category for Cost of Goods Sold (COGS) and operating expenses.
The activities entered later determine how these amounts are allocated.
These amounts should be readily available. This isn’t the part that will require a lot of thought on your part. That comes later.
These expenses can be grouped by department (purchasing, quality control, accounting, IT, etc.) or by type (indirect labor, depreciation, utilities, etc.).
Direct materials & Direct labor
These amounts come from the Item Information worksheet. They are for informational purposes and to calculate an accurate COGS.
Direct materials and Direct labor are direct expenses. The amount spent per item is easily traceable. Activity-based costing is concerned more with the allocation of indirect expenses. But, these costs are needed in order to calculate
Other COGS Expenses
As you can see in the example, these are grouped into broad categories such as Supplies, Freight in, and Depreciation. Each category will be allocated across the activities outlined later. So, break expenses into as many categories as you like, just keep in mind that each will require you to rack your brain that much more.
Take this information from your accounting software/general ledger balances. Don’t reinvent the wheel if you don’t need to. Work with what you
Operating Expenses
Same principles apply to Operating Expenses as COGS Expenses. Decide how many categories you want to break expenses up into and enter the Amount for each category.
Identify Activities
Now, we get into the guts of activity-based costing. These few pieces of information will ultimately affect what costs go toward
Like I said earlier though – don’t overthink it. If you make the commitment to get into activity-based costing, you will probably circle around and make updates as new information comes to light. The good news is, your results will probably be more accurate every time you do so.
Now, depending on the size of your business and your hands-on involvement, it might make sense to touch base with some of your employees before settling on Activities and Metrics. The people who perform these activities day in and day out are going to have valuable input in this arena.
Activity & Metric
Think about the value chain in your company. What is it that you do that adds value to your products and services? What adds value for your customers? Don’t just recite your routing operations here. Think beyond just manufacturing.
Just as with the Expense categories, find a nice balance between too little and too much detail. The “experts” in activity-based costing recommend five to six Activities, tops.
Every Activity will have a logical Metric. Make the metric quantifiable (i.e. a number). “Good” or “bad” wouldn’t qualify as an appropriate Metric.
Some examples of Activity – Metric combinations are:
- Machine setup –
number of machine setups - Parts administration –
number of parts issued - Creating work orders –
number of work orders - Product packaging –
number of products packed - Machine calibration –
number of tests ran
As you can see, the Metric is pretty intuitive once you know the Activity. In most cases, it’s just the number of times your people did the Activity.
Cost Breakdown by Activity
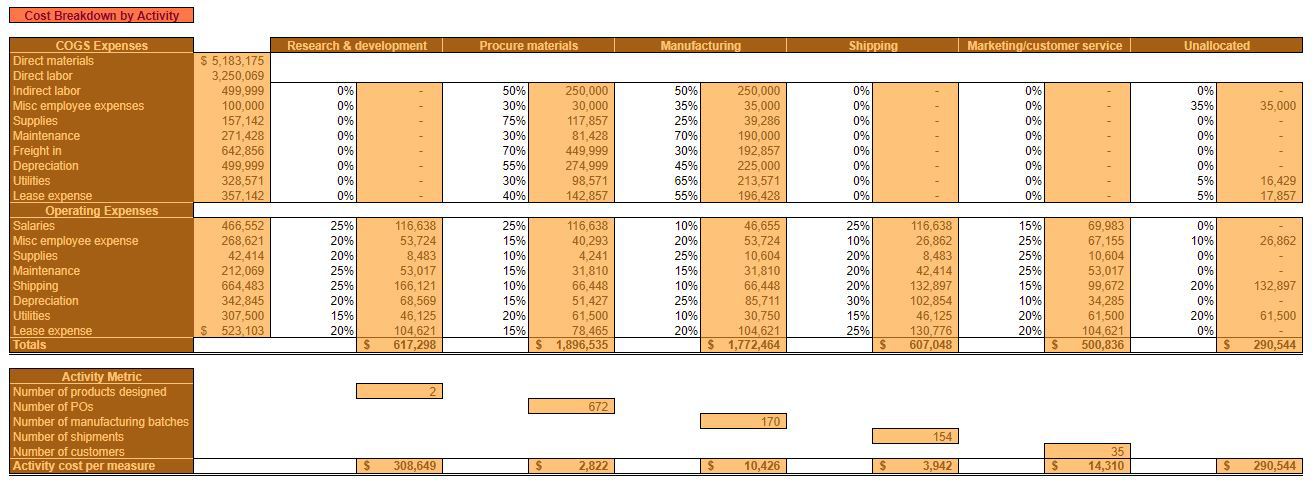
With the Activities and Metrics outlined, it’s now time to take the Amounts specified in the Cost Outline section and allocate them.
This will result in a Total for each Activity. The Total is
Percentage allocation
Start with your first COGS Expense category. Think about how much each Activity contributes to the expenses for that category. In particular, keep in mind the Metric for that Activity.
For instance, in the example, one of the Activities is Manufacturing. The COGS Expense – Maintenance would likely, in large part, revolve around keeping Manufacturing machinery up and running. So, a big portion of the Maintenance expenses should be allocated to the Manufacturing Activity. In the example, it’s 70%.
It should go without saying – all of the percentages need to add up to 100%. This is so that all of the costs for that category are allocated. In order to help assure this, the Unallocated column will force a 100% allocation. Ordinarily, since these cells are white, they wouldn’t have a formula in them. Feel free to overwrite these percentages if need be.
If you do so, and the percentages don’t add up to 100%, then you will see an error message along the right side of the table.
Try to keep the percentages entered into the Unallocated column to a minimum. This is not “unallocated costing.” It is activity-based costing. By having costs in the Unallocated column, you are implying that these costs don’t contribute to the value that you provide your customers.
Alongside every percentage you enter, you’ll notice that the corresponding Amount is calculated. These are the dollar amounts that are totaled and allocated to individual items later on.
Activity Metric & Activity cost per measure
The number for each Activity Metric comes from the Total in the Activity Metric Breakdown section of the Item Information worksheet. This number is the denominator for the Activity cost per measure equation.
Activity cost per measure = Totals ÷ Activity Metric (by Activity)
The Activity cost per measure will later be taken times the Item quantities from the Activity Metric Breakdown section on the Item Information worksheet in order to determine a Total allocated cost for each item.
Item Information

Enter individual item information on this worksheet. This includes Sales and Direct Costs. Additionally, quantities pertaining to each Activity will also be entered here.
The hypothetical company is assumed to have only five products (finished goods for sale to customers). Your small business probably has way more.
There is such a thing as activity-based costing software. But I don’t know much about it. Probably, what you would do if you wanted to implement activity-based costing in your business is – everything, more or less, the same. Except, you would probably have to cost one item at a time. Not all together on one worksheet, like in this example.
Item and Sales Information
This information is pretty straightforward. In the Item field, you’ll see the SKUs. Sales Units are included to calculate per unit amounts on the Executive Summary worksheet. Sales Dollars are included to, of course, determine the profitability of each Item.
Make sure you’re using costs and quantities from the same time period (typically a year) as your Activity Metrics.
Direct Cost Information
Again, pretty straightforward. Material and labor are Direct costs. Because they can be directly tied to an individual item.
Since activity-based costing is, by its nature, more accurate. You should use actual costs here. Not the budgeted costs from the operating budget. The costs do match in the Spreadsheets for Business Operating Budget Workbook and this ABC workbook. For consistency’s sake.
With activity-based costing, you’re looking to the past (not the future), yes, it’s true. But what you lose in terms of planning, you gain in terms of insight about the past.
Make sure you’re using costs from the same time period (typically a year) as your Activity Metrics. We want to compare apples to apples here.
Activity Metric Breakdown
Here, you will fill in the Metrics data for each product based on the Activities entered in the Identify Activities section of the Activity Information worksheet.
Accuracy is important here. Accuracy for each item and in total. Being accurate in total ensures that each Metric is costed appropriately. Being accurate for each item ensures that each item has the right
Executive Summary
Here is where all of the thought you put into Activities, Metrics, and allocations pays off. The culmination of that thought is an accurate per unit calculation of profitability.
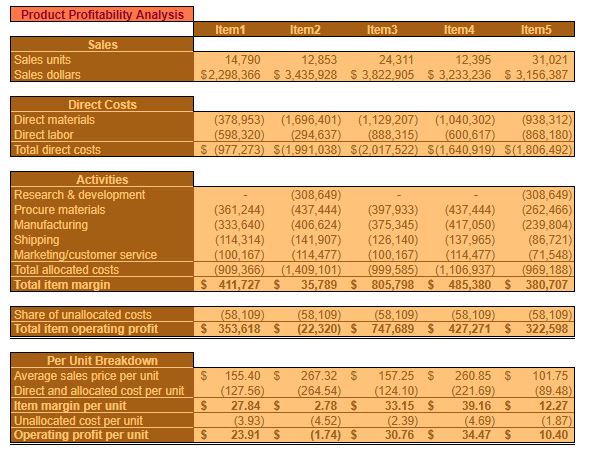
Product Profitability Analysis
This section consists of four sub-sections that address Sales, Direct Costs, Activities, and Per Unit Breakdown. To allow for an in-depth analysis of profitability, each item is broken down in detail.
Sales
Sales units and Sales dollars are pulled directly from the Item and Sales Information section of the Item Information worksheet. It is from this sales information that costs will be deducted and per unit information will be derived.
Direct Costs
Direct materials and Direct labor are pulled directly from the Direct Cost Information section of the Item Information worksheet. Since these costs are direct, they are subtracted directly from Sales dollars on the way to determining item profitability.
Total direct costs = Direct materials + Direct labor
Activities
For each Item/Activity combination, this is the total cost allocation.
Each amount is the result of the Activity cost per measure (Cost Breakdown by Activity section, Activity Information worksheet) × the data in the Activity Metric Breakdown section of the Item Information
The amount of cost allocated to each product, ultimately, is dependent upon that product’s share of the Activities that comprise the value stream. The more frequently a product requires an Activity in order to be manufactured, the more cost it’s going to be allocated.
Notice, in the example, the allocation of costs for Research & development.
The nature of Research & development is such that the Activity only affects very new or in-development products. Products that are established or mature aren’t typically affected by Research & development.
The Activity Metric Breakdown section in the Item Information worksheet shows us that there were two products designed this year – Item2 and Item5. Therefore, these two were the only products to be allocated Research & development costs.
The toll was heavy for being a new product. The costs totaled $308,649 for each product. That’s a lot of cost for two items to support in one year. Especially when they’re brand new. However, it would not have made sense to allocate these costs to Item1, Item2, or Item3. They weren’t new and had no involvement with the Research & development activity.
This is an extreme example. But
Total allocated costs are the sum of the allocated costs for each product from each Activity.
Total item margin
Sales dollars – Total direct costs – Total allocated costs
After Direct Costs and costs from Activities are deducted, this is the profit for each item. The only costs not yet addressed are unallocated costs.
Share of unallocated costs
This is why I urged you to put as little as possible in the Unallocated field. Because when it comes to determining product profitability, these costs get spread out evenly. There’s no real rhyme or reason.
If a product has a huge item margin it can withstand the effects of additional allocated costs. But if it doesn’t – it could push the product operating profit into negative territory.
For example, look at Item2 in the example. It already had to absorb a large
Granted, next year, an item such as this wouldn’t probably be burdened with Research & development costs. But, nevertheless, this product would have been profitable if not for the burden of the unallocated costs.
Total item operating profit
Total item margin – Share of unallocated costs
This is the bottom line profit for each item – in total. Next, we break down Per Unit amounts. These amounts will be drastically different from the ones you would get from using standard costs from your operating budget.
Different costing systems result in different measurements of profitability. An activity-based costing system might not be exact. But, it is a far cry more accurate than a traditional GAAP costing system. That might sound hypocritical, but it’s not. GAAP
Per Unit Breakdown
Here, the amounts from above are divided out by the Sales units. Doing this offers a different perspective on item profitability than the aggregate sales and cost data.
Average sales price per unit
Sales dollars ÷ Sales units
This is the average price you sold each product for over the past year. This serves as the basis for determining item profitability.
Direct and allocated cost per unit
(Total direct costs + Total allocated costs) ÷ Sales units
This is the per-unit amount of Direct Costs and allocated costs (by Activity) for each item. This amount will have as much to do with the amount of costs as it does Sales units. The more units sold, generally, the lower the Direct and allocated costs.
Item margin per unit
Average sales price per unit – Direct and allocated cost per unit
Item margin per unit reflects the gross profitability of each item. Direct costs and semi-direct (allocated) costs are subtracted from the average sales price.
Learn more about gross profit maximization here.
Due to the nature of activity-based costing, you could expect to see some wild results. As mentioned earlier, item profitability could vary widely from what you see in the operating budget. You might find that certain items are less (or more) profitable than you previously thought.
Unallocated cost per unit
Share of unallocated costs ÷ Sales units
Unallocated costs per unit are going to hit each product differently. Though the Total Unallocated costs were spread evenly over all products, Sales units is going to affect the per unit amounts hugely.
The more in Sales units a product has, the less the impact of unallocated costs. The temptation might be to burden the high volume products with the unallocated costs – since they’re the ones that can bear it.
That would be a mistake, I feel. Costs that can’t be traced back to any added value are Unallocated costs. You should examine these costs to see if they can be eliminated.
However, since they can’t be tied to any one product, then they should be spread evenly among all products. A particular product’s profitability shouldn’t suffer just because your company has non-value-added activities.
Operating profit per unit
Item margin per unit – Operating profit per unit
This is the final measure of product profitability. It is the culmination of the activity-based costing system.
An activity-based costing system is basically created to get to this information. This represents one of the most accurate amounts we can come up with in terms of product profitability. Use this accurate information to make decisions. Decisions on product design, manufacturing, service, staffing, warranties, and so on.
Which items are contributing to your company’s bottom line? Which are a drain of resources? This is the whole point of an activity-based cost analysis.
Operating Profit by Item chart
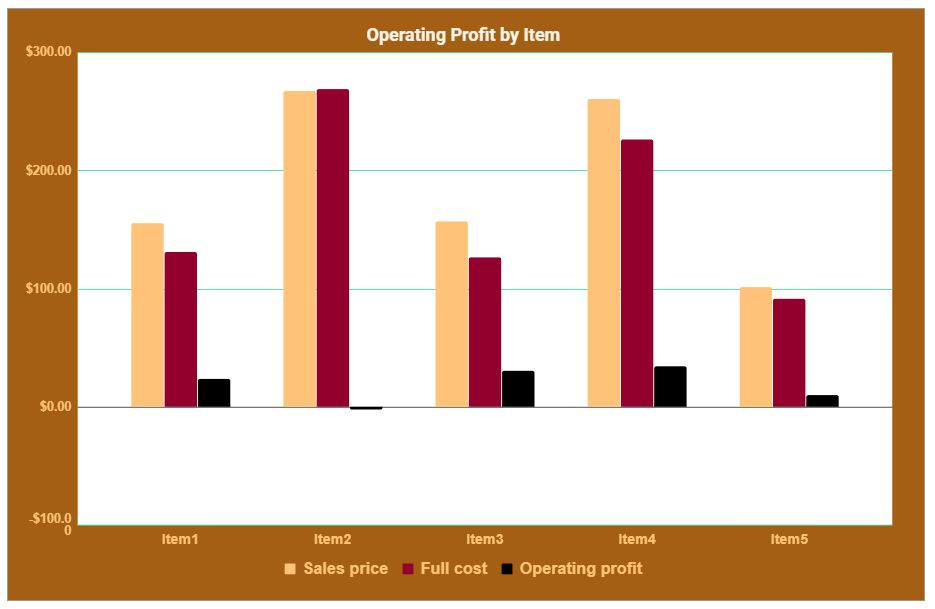
This is a simple representation of the insights from the activity-based costing analysis. Compare the Sales Price to the Full cost (Direct, allocated, and unallocated costs). Operating profit per unit is also included for comparison among products.