The financial projections section of your business plan is where you forecast your sales, expenses, cash flow, and capital projects for the first five years of your small business’s existence.
This is a critical section for readers of your business plan. It tells them:
- How you expect your startup to perform financially
- When you expect your new business to be profitable
- How profitable you expect it to be
These are things you’d want to know as an investor, right? It’s up to the reader to decide whether they think your forecast is feasible.
Additionally, as an entrepreneur, it forces you to consider, thoroughly, what the first five years of business might look like. This will give you a good plan to work off of, will help you to be proactive, and will increase your likelihood of success.
Finally, the financial projections are the foundation of your funding request. Of course, your funding request, after all, is the primary purpose of your business plan.
Without knowing how much cash you need to launch and operate early-on, you won’t know how much you need to ask for. The funding request relies heavily upon financial projections, particularly the capital budget.
An example of a funding request, for this same business, will be posted separately.
This example of financial projections is built off of two previous posts:
- “How Do You Calculate Funding Requirements?” 3 Easy Steps
- What Financial Information s/b Included in a Biz Plan + Why?
In this example, I’ll refer to a start-up restaurant. The restaurant is called Diner, LLC.
A special thanks goes out to this website/post for inspiration on what it takes to launch a start-up restaurant.
Download the restaurant financial projections spreadsheet
If you’d like to download the spreadsheets I used to make these financial projections for a restaurant that can be done below. Keep in mind that these were (hastily) built off of budgets for a manufacturing company and tweaked for the restaurant industry. However, they should serve as a good starting point.
Learn more about the captial budget (CB) here.
Learn more about the operating budget (OB) here.
Learn more about the financial/cash budget (FB) here.
Complete the form below and click Submit.
Upon email confirmation, the workbook will open in a new tab.
Startup restaurant financial projections
The financial projections for Diner, LLC provide a well-thought-out, cohesive, and comprehensive forecast of the restaurant’s performance from initial funding through the fifth year of operation. These forecasts will validate the feasibility of the concept and the appeal of an investment in this venture.
The financial projections for Diner, LLC include an initial capital budget for all of the fixed assets and other costs necessary to launch the restaurant.
Additionally, five years of pro forma income statements are included. These pro forma income statements are built off of a detailed five-year operating budget.
Furthermore, five years of pro forma balance sheets are also included. These pro forma balance sheets are built on five years of detailed cash flow analysis.
For the purpose of brevity, not every detailed budget is included in this business plan. However, all are available for decision support, upon request.
Items in italics represent those directly referenced in the financial projections.
Startup restaurant capital budget
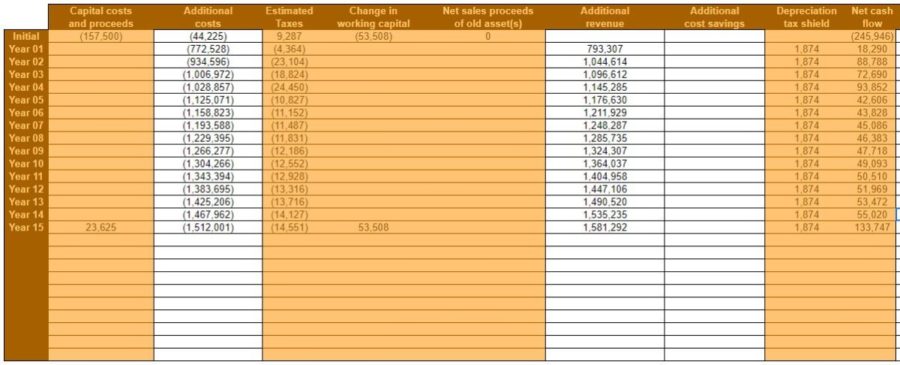
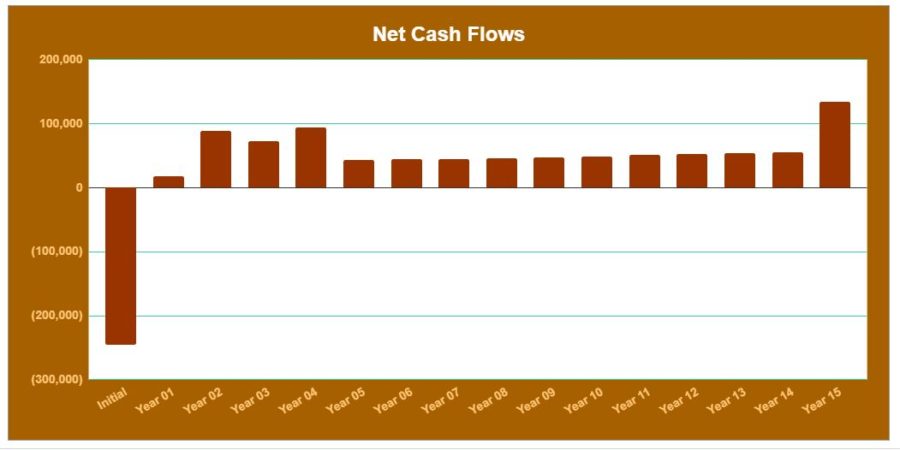
The capital budget summarizes Diner, LLC.’s forecasted operational and cash flow results over the next fifteen years. It takes into account:
- Fixed assets needed to operate the restaurant
- Launch costs necessary to begin operations
- Cash-on-hand needed to launch the restaurant
- To cover unanticipated expenses
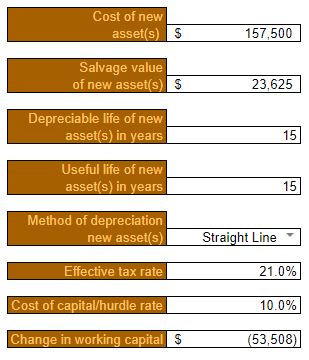
Fixed assets necessary to operate Diner, LLC. are estimated to cost $157,500.
The salvage value after fifteen years is estimated at $23,625.
On average, all assets are assumed to have a depreciable (and useful life) of fifteen years.
Fixed assets will be depreciated using the straight-line method.
The effective tax rate, for purposes of calculating a depreciation tax shield, is estimated at 21% throughout the capital budget.
A discount rate of 10% is used to calculate NPV and other capital budgeting metrics. This discount rate considers the cost of borrowing (6%) and adds an additional risk premium of 4%. 6% is the estimated interest rate for an SBA 7(a) Small Loan and is calculated by adding 2.75% to the current Prime Rate (3.25%).
Initial Additional costs include launch costs that can’t be depreciated. E.g. professional services, organization & development costs, and other pre-opening costs.
Additional costs for Year 01 through Year 05 are pulled directly from the operating budget. Additional costs for Year 06 through Year 15 are assumed to grow at a rate of 3% per year after Year 05.
Additional revenue for Year 01 through Year 05 is also pulled directly from the operating budget. Additional revenue for Year 06 through Year 15 is assumed to grow at 3% per year after Year 05.
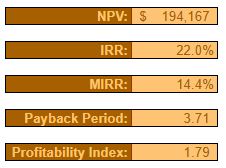
Over the course of fifteen years, the Summary of the capital budget shows:
- Net present value (NPV) of $194,167
- Internal rate of return (IRR) of 22%
- Modified internal rate of return (MIRR) of 14.4%
- Payback period of 3.71 years
- Profitability index of 1.79
It’s worth noting that if the restaurant were to be sold at the end of fifteen years, the NPV would be considerably higher – accounting for the proceeds from a sale.
Startup restaurant operating budget
In the operating budget, Diner, LLC.’s sales, ingredients (cost of sales) payroll, and other overhead expenses are forecasted by month. Additionally, annual amounts are shown in a Pro Forma Income Statement. Each individual component of the budget is analyzed and forecasted separately in an attempt to be as comprehensive and realistic as possible.
Restaurant operating budget Year 1
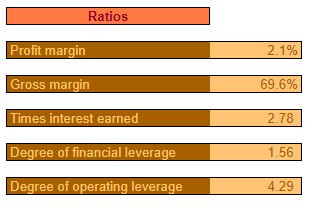
Year one of operations is characterized by low initial sales that grow quickly throughout the first 12 months of business. The first month of profitability is estimated to be Month six – September 2021.
As such, the Profit margin is very low for the year overall but, it is expected that the year will be profitable.
The Sales Budget breaks down the expected Unit volume and Dollar Sales for each category of products sold. These categories are:
- Entrées
- Appetizers
- Desserts
- Non-alcoholic beverages
- Alcoholic beverages
Each individual product in a category will have a different price, of course. However, for the sake of simplicity, items were grouped by category and an average Sales Price is estimated.
Sales prices will initially be set higher than average. At or near the “indifference price point.” At this price point, the number of customers that consider the price a bargain should be close to the number that feel it’s starting to get expensive.
This is done with the hopes that the Diner, LLC.’s novelty, image, and quality will still provide a perceived value for customers. Additionally, pricing as high as practical will help to offset the low initial Unit Sales after launch.
Restaurant operating budget year 2
Year two of operations is characterized by a leveling off of Unit Sales after reaching near practical capacity at the end of year one.
Additionally, it’s anticipated that Sales Prices will remain the same throughout the year after being on the high side in year one.
However, in spite of rising costs, overall sales are expected to increase significantly due to consistent demand throughout year two.
As mentioned, most costs, including ingredients, are expected to increase by an average of 3% in the second year.
As with sales categories, for the sake of simplicity, ingredients are grouped together into categories. Their costs represent an average of all the ingredients contained in a category.
Restaurant operating budget Year 3
In year three, unit sales are expected to continue to remain level. Sales Prices are anticipated to increase by approximately 5% to offset increased costs. Diner, LLC. is expected to have its highest year of profitability yet.
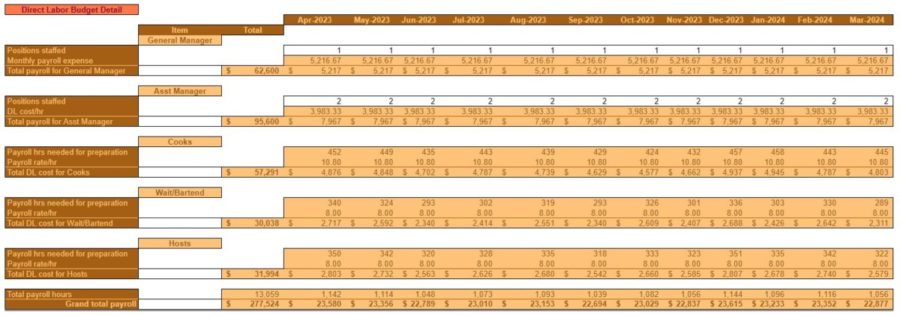
As was the case in year two, payroll is again expected to increase. This is due to an increase in wages and salaries of roughly 3%. It is Diner, LLC.’s intent to incentivize customer service and quality through above-average employee compensation.
In years one and two, the staff is expected to consist of:
One General Manager and one Assistant Manager, along with Cooks, Waitresses/Bartenders, and Hosts as needed, part-time, depending on sales volume. The General Manager and Assistant Manager are expected to cover any staffing shortcomings.
In year three, however, it is budgeted to add a second Assistant Manager position to relieve some of the responsibilities of the other managers.
Restaurant operating budget Year 4
With Unit Sales, for all practical reasons, expected to be maxed out, Sales Prices would need to be increased in year four in order to achieve meaningful revenue growth.
As is typical, all costs are expected to increase by 3%, on average, in year four.
One exception is the Rent/Occupancy expense. When operations are initiated, Diner, LLC. is expected to enter into a three-year lease. At the beginning of year four, the lease will have expired and a new lease will need to be signed. A 10% increase in Rent/Occupancy expense is anticipated.

Restaurant operating budget Year 5
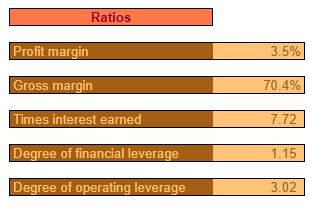
By the end of year five, Diner, LLC. is expected to remain profitable. That is, as long as Sales Prices are kept adequately above costs without sacrificing demand.
In order for the Diner, LLC. to grow from this point, the opening of a new location or another type of expansion would need to take place.
Startup restaurant cash budget
The cash budget forecasts the timing of cash collections and cash disbursements. This is done in an effort to ensure that Diner, LLC. remains solvent.
Obviously, the nature of the restaurants’ business model is such that cash collections are always made at the time of sale. So, no Accounts receivable are ever anticipated to be on the books.
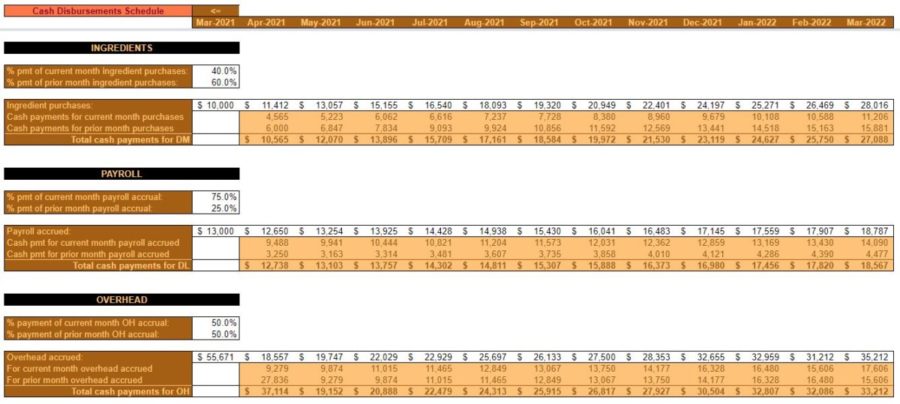
However, ingredients, payroll, and overhead are not necessarily paid for in the same month but those expenses are incurred. Therefore, the timing of cash flow out will not necessarily correspond with expenses on the operating budget.
The cash budget is where a Desired ending cash balance is specified. Additionally, details on any financing (long-term and/or short-term) and savings account balances are also addressed.
Restaurant cash budget Year 1
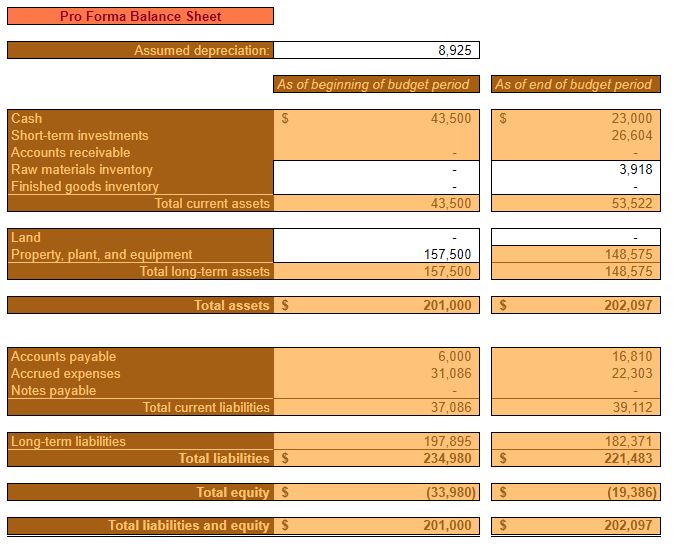
In the time leading up to the first month of operation, a considerable amount of money will need to be borrowed by Diner, LLC. to pay for pre-opening expenses. The Beginning cash balance is set at $43,500 in order to offset low initial sales.
Pre-opening ingredient purchases, payroll, and overhead expenses are estimated and accounted for.
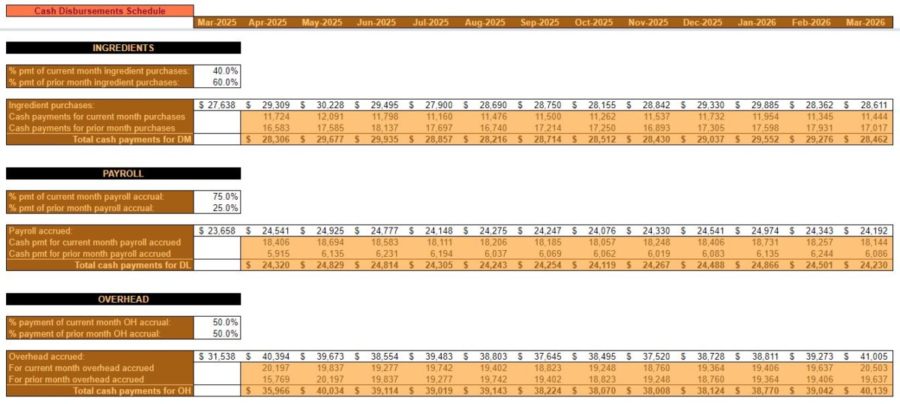
The timing of cash payments is estimated by assigning a % pmt of current (& prior) month for each expense type.
Restaurant cash budget Year 2
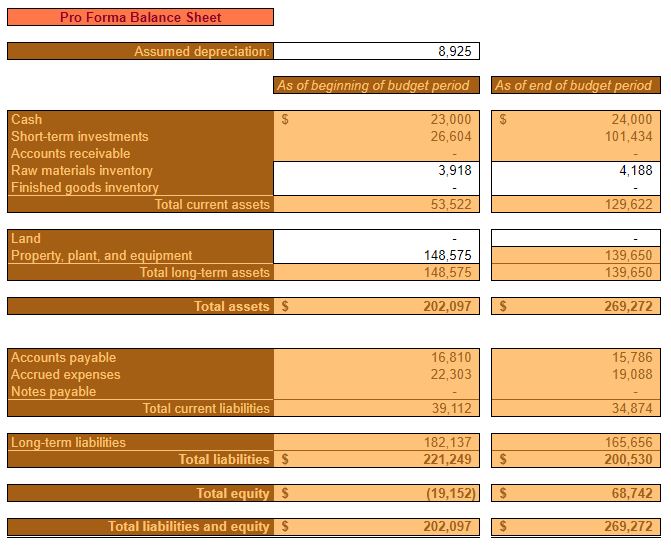
The increase in Unit Sales for year two is expected to help turn negative equity positive. Additionally, prudent cash management is expected to contribute to the security and solvency of Diner, LLC.

Maintaining an Ending cash balance of $24,000 every month puts the restaurant in a position where it doesn’t need to rely on any short-term or long-term financing. It also facilitates the ability to put excess cash into a liquid investment account. This investment account is available to offset negative, unforeseen, events. Or, to put towards future growth and expansion.
Restaurant cash budget Year 3
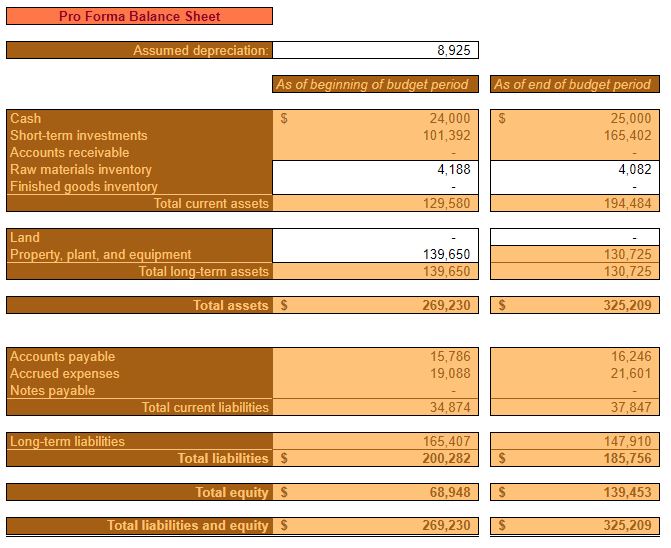
Year three is expected to see the continued reduction of debt and a subsequent increase in assets and equity. Certain balance sheet items like inventory, Accounts payable, and Accrued expenses are expected to increase in line with increasing costs as outlined in the operating budget.
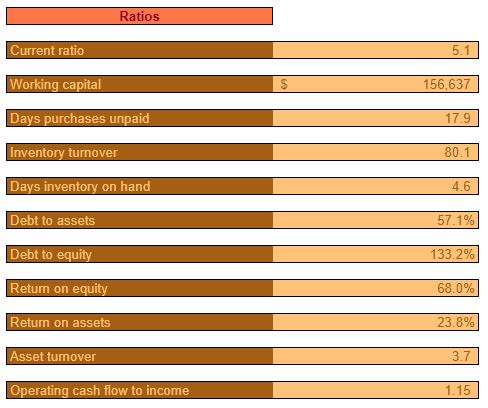
All ratios at the end of year three are expected to be relatively healthy. At this point, Diner, LLC. is expected to still have a relatively high Debt to equity ratio. This ratio is expected to continue to decrease, however.
Restaurant cash budget Year 4
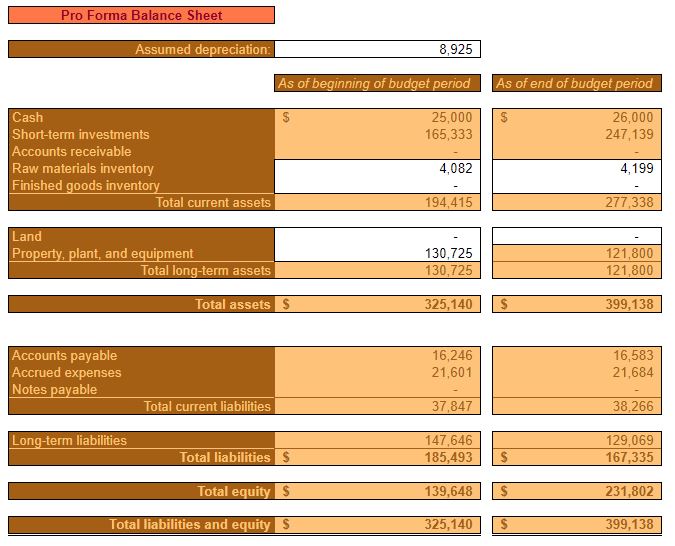
Throughout year four, assets and equity will continue to grow.
Cash and short-term investments begin to make up a considerable portion of assets.
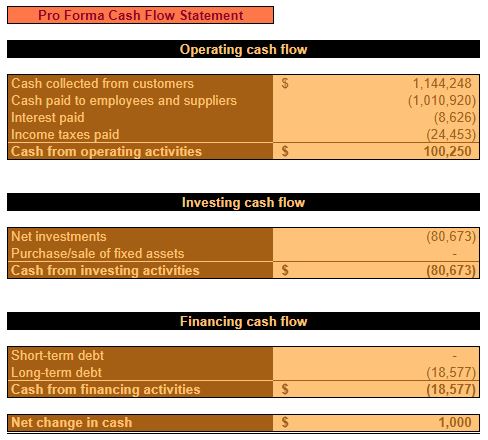
The year four pro forma cash flow statement offers a different perspective than the income statement and balance sheet. It shows how it’s anticipated to be cash positive from operating activities and how the majority of that cash will be used to pay down debt and put into a short-term investment account.
Restaurant cash budget Year 5
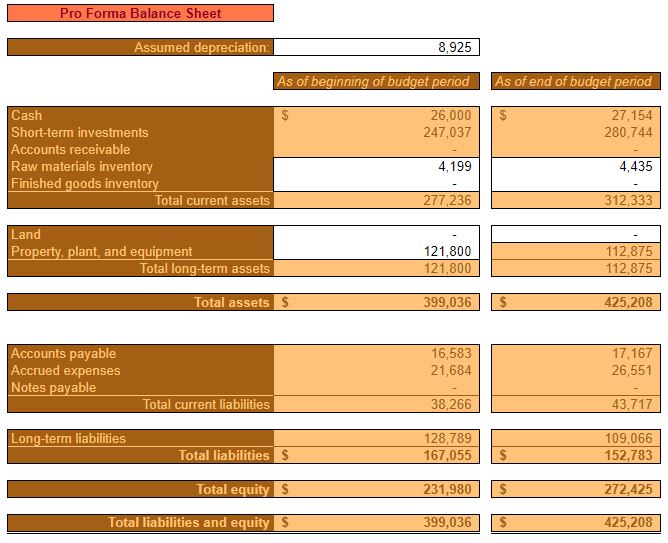
By the completion of the fifth year of operation, equity is estimated to be between $250,000 and $300,000. Cash balances continue to grow at approximately $1,000 per year, in order to account for increasing expenses.
Barring unforeseen events, Diner, LLC. should be expected to adequately cover expenses and to deposit a considerable amount of cash receipts into short-term investments.
This growing investment account will serve as a margin of safety for unforeseen circumstances and/or will allow for expansion or other projects – should that course of action be chosen.

