What is considered inventory for a restaurant? Video summary
Inventory information is only useful if it contains critical data. Having access to your restaurant’s most important information will help you make smart decisions for your restaurant.
Actual inventory levels must be consistently physically counted and compared to amounts listed in the software. Corrections in the software must be made if there is a discrepancy.
Many restaurant software tools will help to keep track of inventory. However, if they don’t, you can’t neglect this task. Even if they do, periodic inventory counts are still necessary.
What should a restaurant inventory list look like?
There are five fields that are critical for a restaurant inventory list.
These fields are:
Item
The name of what’s being counted
Unit of measure (UOM)
A consistent quantity that will be used for counting and costing
Quantity on hand (QOH)
How many UOM the restaurant currently owns
Item cost
Don’t count in one UOM and cost in another
Extended cost
QOH × Item cost
The total value of the inventory
Additionally, you can include other fields in your restaurant inventory list if appropriate. For example:
Category
Meat, vegetables, raw, prepared, etc.
Location
If you have more than one
Any other classification that helps you manage inventory
The restaurant inventory list
Fill out the critical fields for every item you own. If you must, it is okay to use multiple lines for the same item. The pivot table functionality of the spreadsheet can handle it.
Your restaurant’s POS (and other types of) software might be able to help with inventory management. It depends on the software functionality. Some software will track inventory usage. Your accounting software might track purchases too and may keep running inventory levels.
Not every piece of software will keep track of waste, spoilage, and other losses, however. Therefore…
Cycle counting of restaurant inventory will still always be necessary. This ensures that your inventory counts are accurate and you can meet demand and avoid waste.
Employees play an important part in inventory management. Consider giving them an incentive for accurate inventory counts. Explain to them the importance of accuracy.
When cycle counting – maintain a consistent schedule and stick to it! Inventory items with high turnover should be counted more frequently.
Finally, remember to track waste and food loss. Particularly if your software does not. During the hustle bustle of the workday, it may not be possible to accurately measure wasted quantities. Do your best to estimate them. Inventory amounts will be accurately adjusted next cycle count.
Utilize the Food Waste spreadsheet on the Why Spreadsheets Are Your Restaurant’s Best Friend workbook (download above). Also, take advantage of the other spreadsheets in the workbook including:
Scheduling template
Vendor order sheet
Daily prep list
Inventory control
Food/recipe costing
Food waste
Sales per day
More considerations regarding your restaurant inventory list
Only consumable items that you use to prepare food should be included in your inventory. Not every asset should be included here. Things such as flatware, cookware, glassware, etc. are not inventory.
It’s important to keep accurate records for these assets, but they are not inventory. Inventory is what you sell to your customers.
Again, make sure you’re using a consistent UOM for your inventory items. Use whatever is easiest to track. Whether it be Lbs, Gal, Oz, Cans, Cases, Flats, whatever – just stay consistent. Doing so will ensure that costly errors in counts and valuation aren’t made.
Food costs are rapidly changing. So what cost should you use?
Your POS or accounting system might track costs for you. If so, great. If not, it might make sense to assign a standard (expected) or average cost to inventory items.
No matter what inventory cost you use, make sure you’re relieving inventory on a First In, First Out (FIFO) basis. E.g. use your oldest inventory first, assuming it’s fit for consumption, of course. No other industry has to wrestle with the issue of spoilage more than the restaurant industry. So, do what you can to avoid needless waste of inventory and dollars.
Again, at the risk of beating a dead horse, make sure your costs reflect your UOM.
Finally, one of the primary benefits of managing your restaurant inventory is that you can measure inventory days on hand. In order to do so, you must keep track of inventory usage on a daily basis.
Inventory days on hand = inventory on hand ÷ average daily usage. Assuming that you are meeting all of your customer’s demand (not running out of stock) then the lower your inventory days on hand, the better.
Questions about How Do I Make a Restaurant Inventory List?
What challenges do restaurants have with managing inventory?
Spoilage is one inventory problem that the restaurant industry is particularly prone to. Many inventory items, by necessity, have an extremely short shelf life.
Accountability is another. With so many different individuals handling and recording inventory, it can be difficult to ensure that QOH in your software matches reality.
Finally, running out of inventory can hurt customer service for a restaurant more than it can other industries. While other businesses can put an item on backorder for a customer – restaurants can not.
These are just a few. There are many more unique challenges that restaurants face in managing inventory.
How does one manage quality control and inventory control smartly in a restaurant for an owner who lives in another city?
Most importantly, it is critical to find employees that can be trusted to manage inventory smartly. Also, while you want every employee to use best practices when it comes to inventory management, you’ll probably want to have one trusted individual who will have ultimate accountability.
Which is the best software for inventory control in a restaurant?
There are a lot of options out there. However, a piece of software called Restaurant 365 seems to be pretty well regarded. I’ve never used it myself. So, I can’t attest to its quality. In my brief searching, though, I never saw any negative feedback. Pricing will run from $250 to more than $450 per month per location.
Spreadsheets are also often recommended. They take some work to get set up, but one major benefit is the ability to customize them to your needs. Feel free to download the inventory control spreadsheet above and check out the Why Spreadsheets Are Your Restaurant’s Best Friend post and video.
How do I make an inventory list and other spreadsheets for my restaurant?
Spreadsheets serve as a great complement to, or replacement for, the other software a restaurant might rely upon. Spreadsheets can handle nearly any task you require of them. They are very versatile. Small restaurants, with a limited software budget, might find them particularly useful.
The author states that a computer is “Second only to a good set of knives”. And spreadsheets are “the cat’s meow.” They can help a restaurant with organization.
Spreadsheets can intimidate some people. But, they are only as complicated as you make them. It is suggested that you take a course if you must. Particularly if you want to take advantage of the power of formulas.
Spreadsheets will make your life as a restaurant manager easier. Once you take a little bit of time to climb the learning curve.
Spreadsheets can fill in gaps in functionality for pieces of software. Many POS systems and most accounting software will export to .csv format – which can then be imported into a spreadsheet.
Some of the things a restaurant can use spreadsheets for
Staff scheduling
Drop in pre-made shifts for each employee
Order sheets
Purchase orders for ingredients
Automatically calculate tax and totals
Vendor lists
A master list of all vendors with name, address, phone, and email
Keeping good documentation will help with financing. Good documentation provides detail about how and why your startup restaurant will be successful. Spreadsheets are an excellent tool for providing documentation.
The financial projections section of your business plan is where you forecast your sales, expenses, cash flow, and capital projects for the first five years of your small business’s existence.
This is a critical section for readers of your business plan. It tells them:
How you expect your startup to perform financially
When you expect your new business to be profitable
How profitable you expect it to be
These are things you’d want to know as an investor, right? It’s up to the reader to decide whether they think your forecast is feasible.
Additionally, as an entrepreneur, it forces you to consider, thoroughly, what the first five years of business might look like. This will give you a good plan to work off of, will help you to be proactive, and will increase your likelihood of success.
Finally, the financial projections are the foundation of your funding request. Of course, your funding request, after all, is the primary purpose of your business plan.
Without knowing how much cash you need to launch and operate early-on, you won’t know how much you need to ask for. The funding request relies heavily upon financial projections, particularly the capital budget.
An example of a funding request, for this same business, will be posted separately.
This example of financial projections is built off of two previous posts:
Download the restaurant financial projections spreadsheet
If you’d like to download the spreadsheets I used to make these financial projections for a restaurant that can be done below. Keep in mind that these were (hastily) built off of budgets for a manufacturing company and tweaked for the restaurant industry. However, they should serve as a good starting point.
Complete the form below and click Submit. Upon email confirmation, the workbook will open in a new tab.
Startup restaurant financial projections
The financial projections for Diner, LLC provide a well-thought-out, cohesive, and comprehensive forecast of the restaurant’s performance from initial funding through the fifth year of operation. These forecasts will validate the feasibility of the concept and the appeal of an investment in this venture.
The financial projections for Diner, LLC include an initial capital budget for all of the fixed assets and other costs necessary to launch the restaurant.
Additionally, five years of pro forma income statements are included. These pro forma income statements are built off of a detailed five-year operating budget.
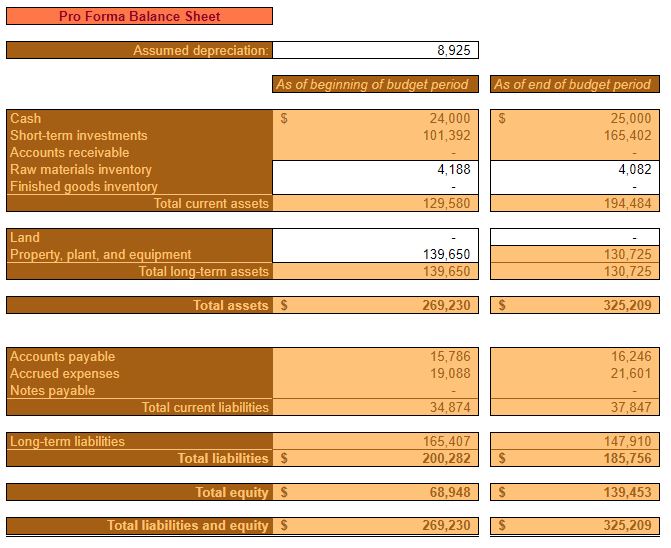
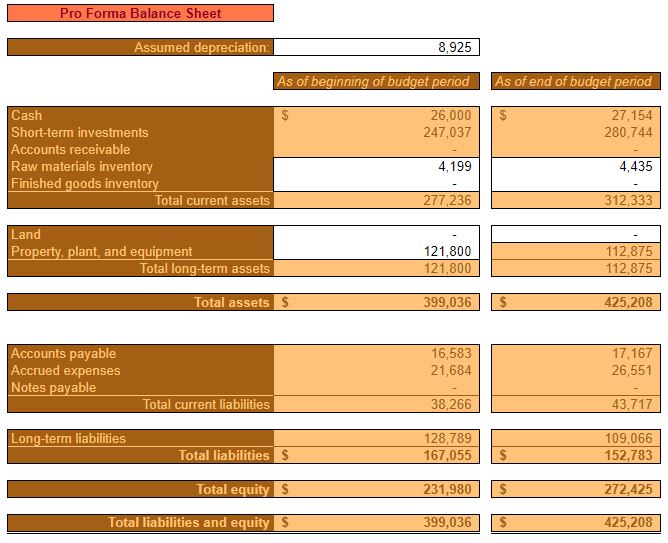
Furthermore, five years of pro forma balance sheets are also included. These pro forma balance sheets are built on five years of detailed cash flow analysis.
For the purpose of brevity, not every detailed budget is included in this business plan. However, all are available for decision support, upon request.
Items in italics represent those directly referenced in the financial projections.
Startup restaurant capital budget
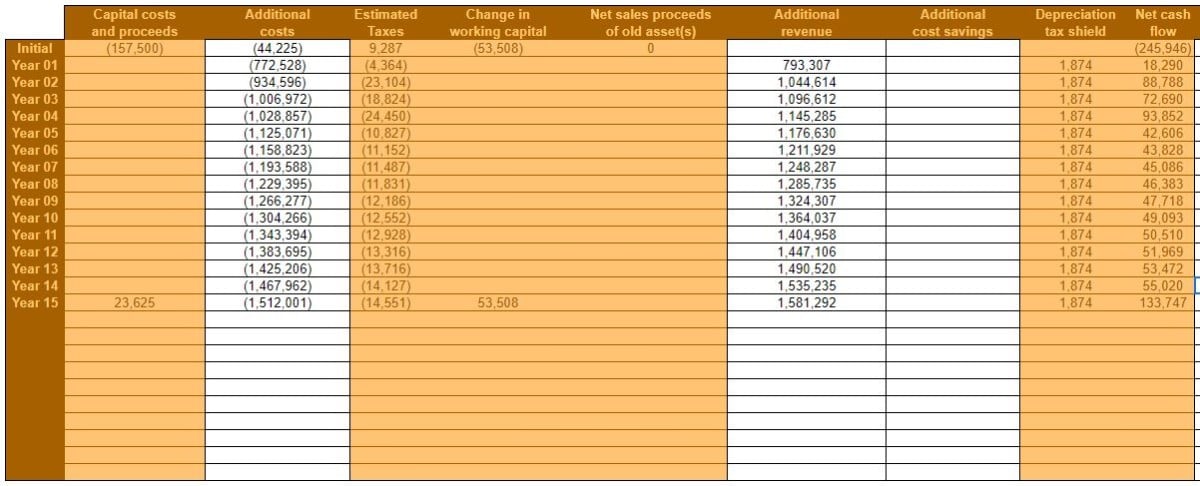
The capital budget summarizes Diner, LLC.’s forecasted operational and cash flow results over the next fifteen years. It takes into account:
Fixed assets needed to operate the restaurant
Launch costs necessary to begin operations
Cash-on-hand needed to launch the restaurant
To cover unanticipated expenses
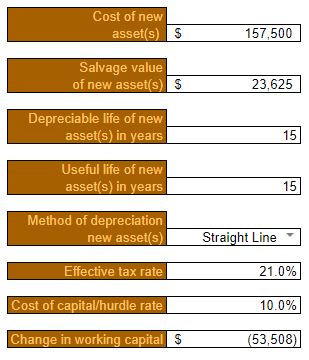
Fixed assets necessary to operate Diner, LLC. are estimated to cost $157,500.
The salvage value after fifteen years is estimated at $23,625.
On average, all assets are assumed to have a depreciable (and useful life) of fifteen years.
Fixed assets will be depreciated using the straight-line method.
The effective tax rate, for purposes of calculating a depreciation tax shield, is estimated at 21% throughout the capital budget.
A discount rate of 10% is used to calculate NPV and other capital budgeting metrics. This discount rate considers the cost of borrowing (6%) and adds an additional risk premium of 4%. 6% is the estimated interest rate for an SBA 7(a) Small Loan and is calculated by adding 2.75% to the current Prime Rate (3.25%).
Click to enlarge
Initial Additional costs include launch costs that can’t be depreciated. E.g. professional services, organization & development costs, and other pre-opening costs.
Additional costs for Year 01 through Year 05 are pulled directly from the operating budget. Additional costs for Year 06 through Year 15 are assumed to grow at a rate of 3% per year after Year 05.
Additional revenue for Year 01 through Year 05 is also pulled directly from the operating budget. Additional revenue for Year 06 through Year 15 is assumed to grow at 3% per year after Year 05.
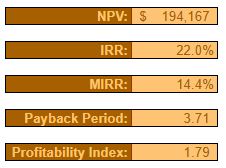
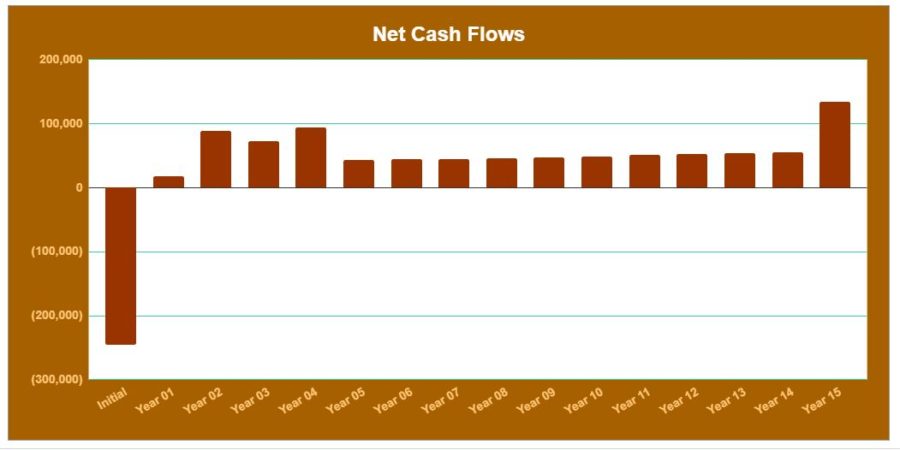
Over the course of fifteen years, the Summary of the capital budget shows:
Net present value (NPV) of $194,167
Internal rate of return (IRR) of 22%
Modified internal rate of return (MIRR) of 14.4%
Payback period of 3.71 years
Profitability index of 1.79
It’s worth noting that if the restaurant were to be sold at the end of fifteen years, the NPV would be considerably higher – accounting for the proceeds from a sale.
Startup restaurant operating budget
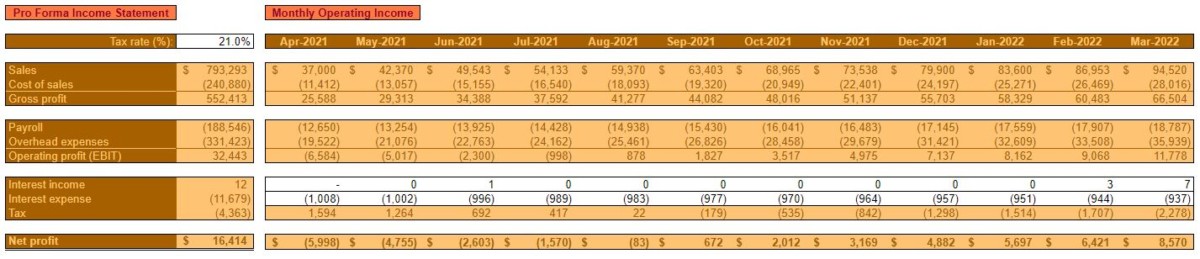
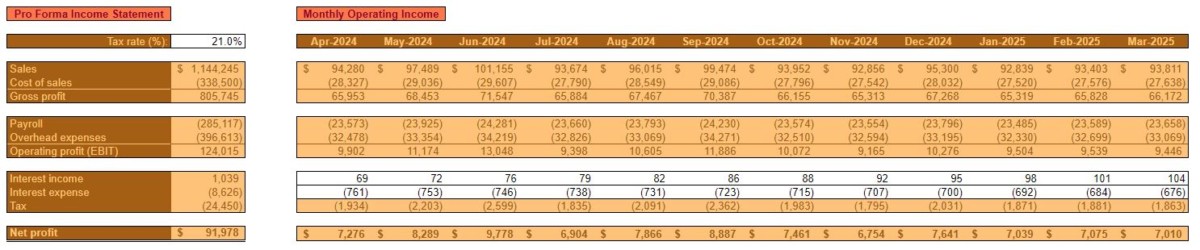
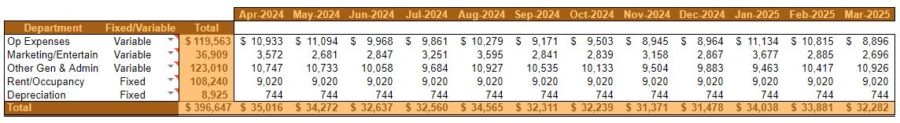
In the operating budget, Diner, LLC.’s sales, ingredients (cost of sales) payroll, and other overhead expenses are forecasted by month. Additionally, annual amounts are shown in a Pro Forma Income Statement. Each individual component of the budget is analyzed and forecasted separately in an attempt to be as comprehensive and realistic as possible.
Restaurant operating budget Year 1
Click to enlarge
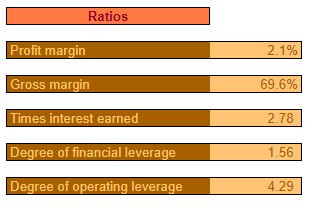
Year one of operations is characterized by low initial sales that grow quickly throughout the first 12 months of business. The first month of profitability is estimated to be Month six – September 2021.
As such, the Profit margin is very low for the year overall but, it is expected that the year will be profitable.
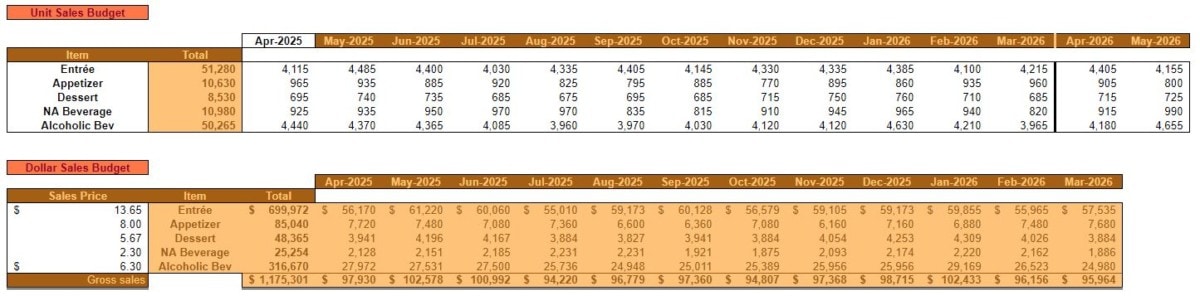
Click to enlarge
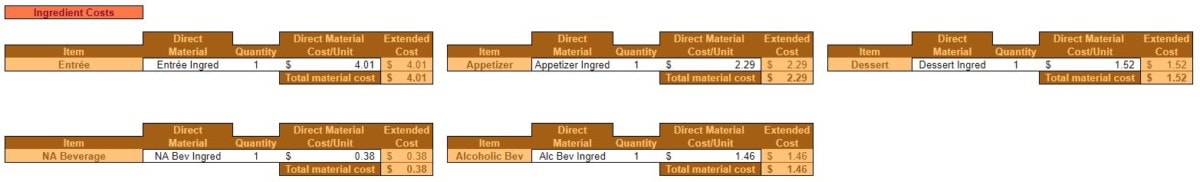
The Sales Budget breaks down the expected Unit volume and Dollar Sales for each category of products sold. These categories are:
Entrées
Appetizers
Desserts
Non-alcoholic beverages
Alcoholic beverages
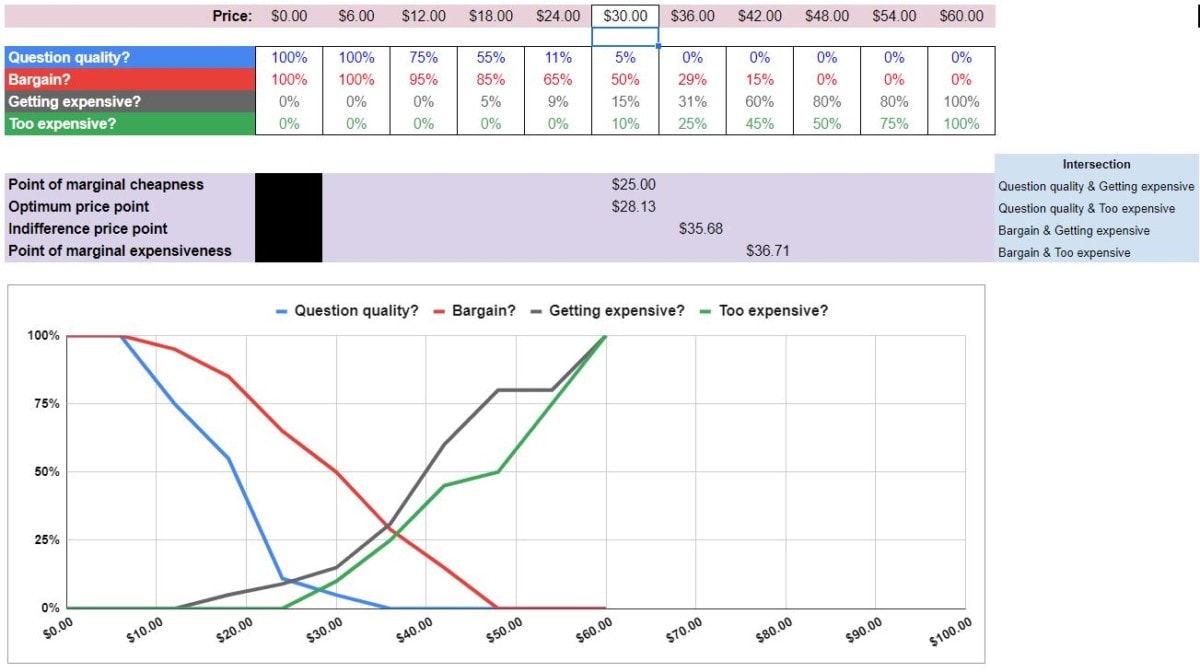
Each individual product in a category will have a different price, of course. However, for the sake of simplicity, items were grouped by category and an average Sales Price is estimated.
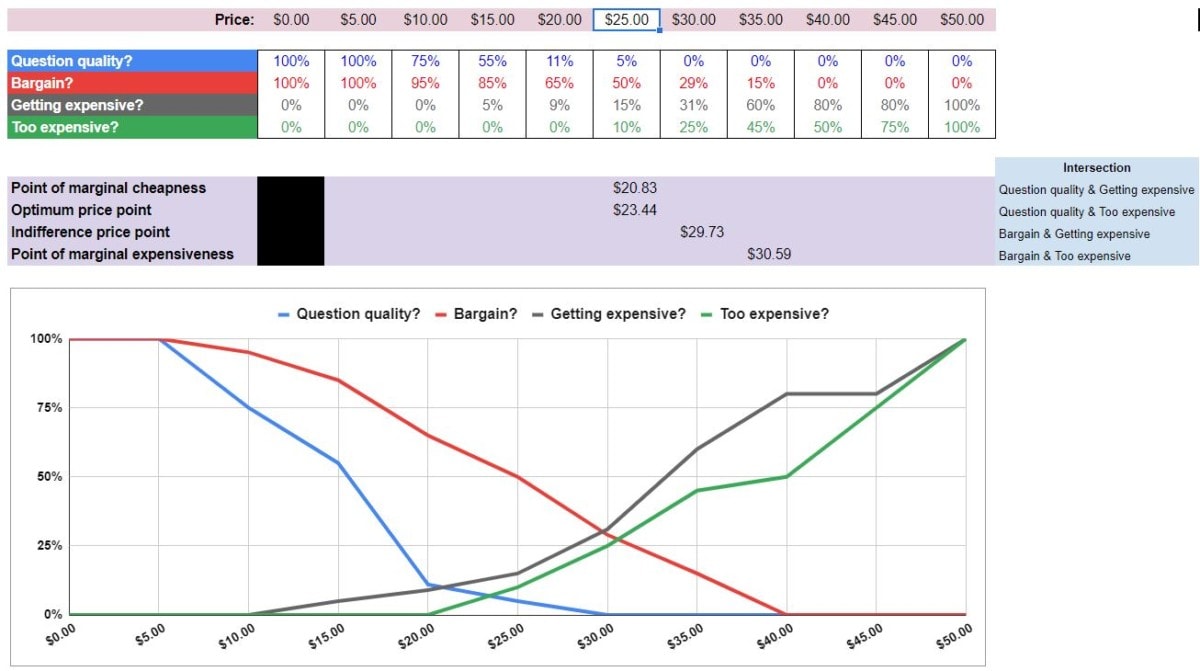
Sales prices will initially be set higher than average. At or near the “indifference price point.” At this price point, the number of customers that consider the price a bargain should be close to the number that feel it’s starting to get expensive.
This is done with the hopes that the Diner, LLC.’s novelty, image, and quality will still provide a perceived value for customers. Additionally, pricing as high as practical will help to offset the low initial Unit Sales after launch.
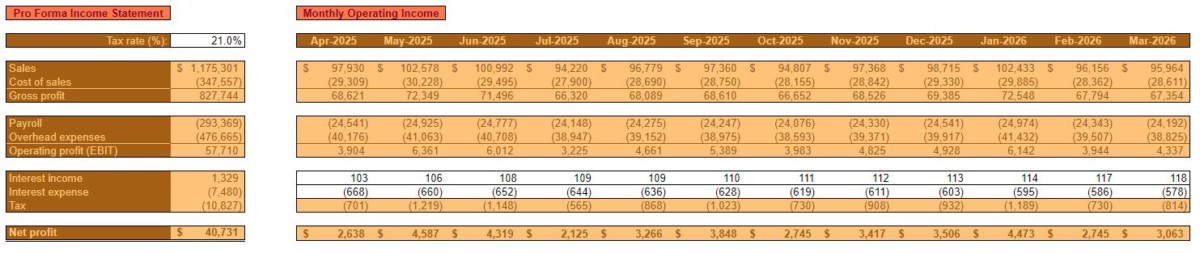
Restaurant operating budget year 2
Click to enlarge
Year two of operations is characterized by a leveling off of Unit Sales after reaching near practical capacity at the end of year one.
Additionally, it’s anticipated that Sales Prices will remain the same throughout the year after being on the high side in year one.
However, in spite of rising costs, overall sales are expected to increase significantly due to consistent demand throughout year two.
Click to enlarge
As mentioned, most costs, including ingredients, are expected to increase by an average of 3% in the second year.
As with sales categories, for the sake of simplicity, ingredients are grouped together into categories. Their costs represent an average of all the ingredients contained in a category.
Restaurant operating budget Year 3
Click to enlarge
In year three, unit sales are expected to continue to remain level. Sales Prices are anticipated to increase by approximately 5% to offset increased costs. Diner, LLC. is expected to have its highest year of profitability yet.
Click to enlarge
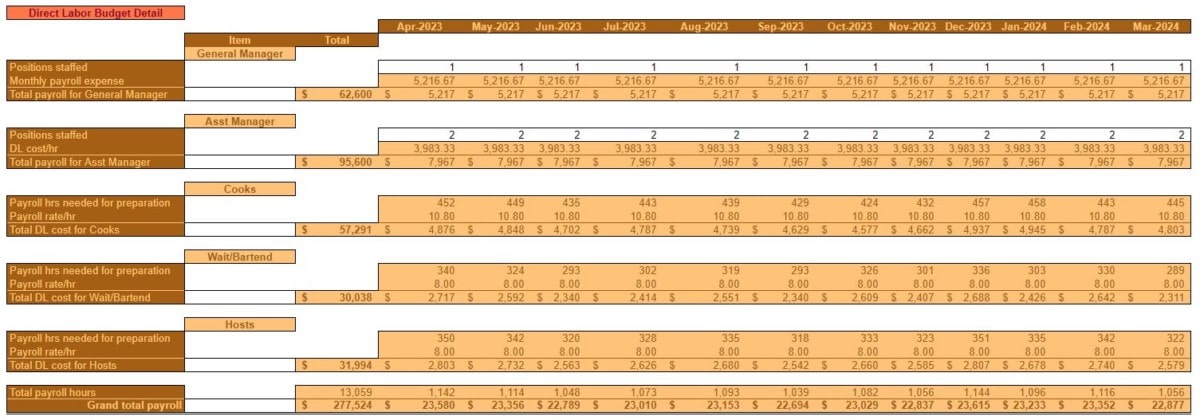
As was the case in year two, payroll is again expected to increase. This is due to an increase in wages and salaries of roughly 3%. It is Diner, LLC.’s intent to incentivize customer service and quality through above-average employee compensation.
In years one and two, the staff is expected to consist of:
One General Manager and one Assistant Manager, along with Cooks, Waitresses/Bartenders, and Hosts as needed, part-time, depending on sales volume. The General Manager and Assistant Manager are expected to cover any staffing shortcomings.
In year three, however, it is budgeted to add a second Assistant Manager position to relieve some of the responsibilities of the other managers.
Restaurant operating budget Year 4
Click to enlarge
With Unit Sales, for all practical reasons, expected to be maxed out, Sales Prices would need to be increased in year four in order to achieve meaningful revenue growth.
As is typical, all costs are expected to increase by 3%, on average, in year four.
One exception is the Rent/Occupancy expense. When operations are initiated, Diner, LLC. is expected to enter into a three-year lease. At the beginning of year four, the lease will have expired and a new lease will need to be signed. A 10% increase in Rent/Occupancy expense is anticipated.
Restaurant operating budget Year 5
Click to enlarge
By the end of year five, Diner, LLC. is expected to remain profitable. That is, as long as Sales Prices are kept adequately above costs without sacrificing demand.
In order for the Diner, LLC. to grow from this point, the opening of a new location or another type of expansion would need to take place.
Click to enlarge
Startup restaurant cash budget
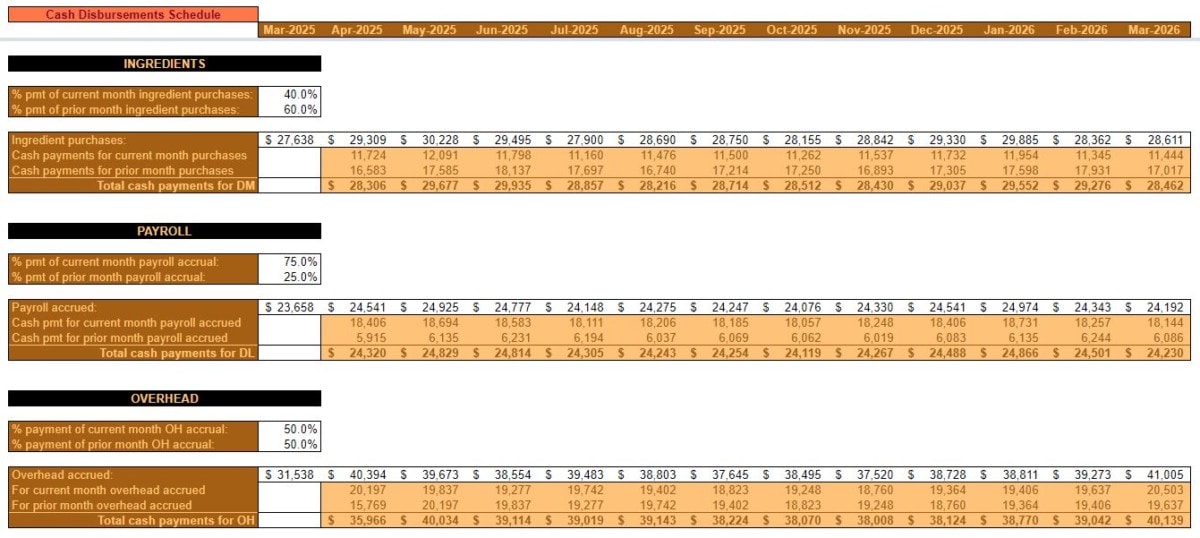
The cash budget forecasts the timing of cash collections and cash disbursements. This is done in an effort to ensure that Diner, LLC. remains solvent.
Obviously, the nature of the restaurants’ business model is such that cash collections are always made at the time of sale. So, no Accounts receivable are ever anticipated to be on the books.
However, ingredients, payroll, and overhead are not necessarily paid for in the same month but those expenses are incurred. Therefore, the timing of cash flow out will not necessarily correspond with expenses on the operating budget.
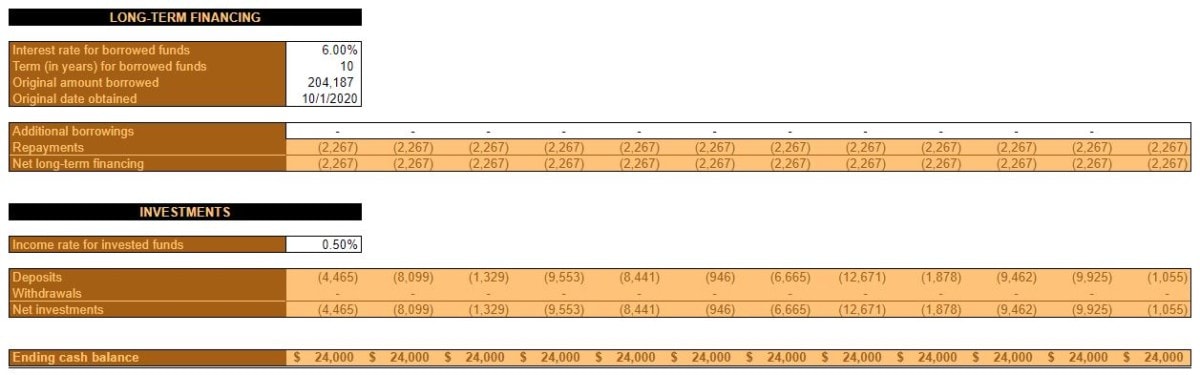
The cash budget is where a Desired ending cash balance is specified. Additionally, details on any financing (long-term and/or short-term) and savings account balances are also addressed.
Restaurant cash budget Year 1
In the time leading up to the first month of operation, a considerable amount of money will need to be borrowed by Diner, LLC. to pay for pre-opening expenses. The Beginning cash balance is set at $43,500 in order to offset low initial sales.
Click to enlarge
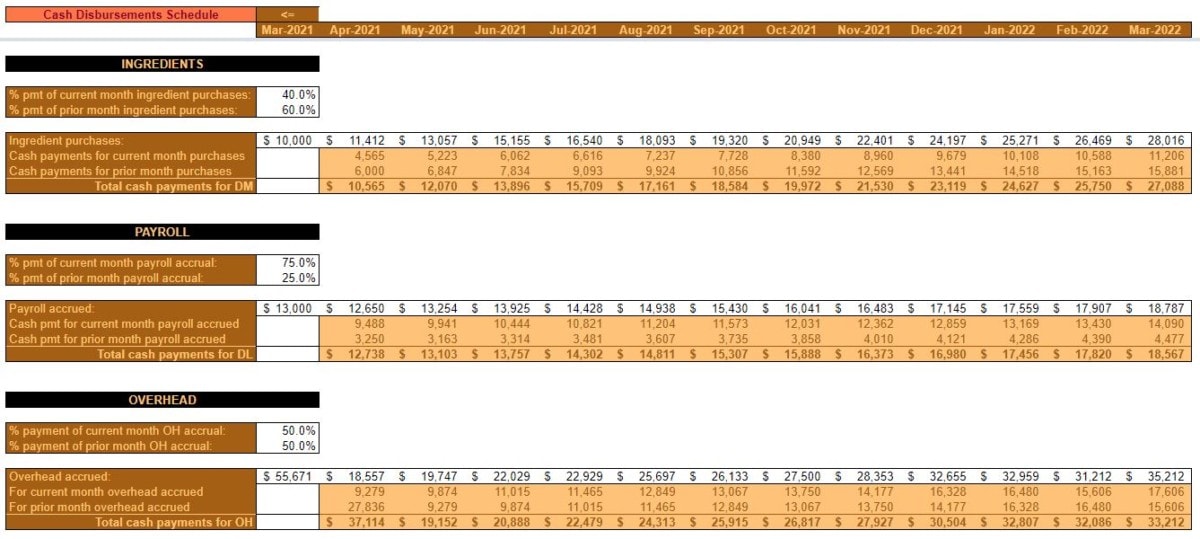
Pre-opening ingredient purchases, payroll, and overhead expenses are estimated and accounted for.
The timing of cash payments is estimated by assigning a % pmt of current (& prior) month for each expense type.
Restaurant cash budget Year 2
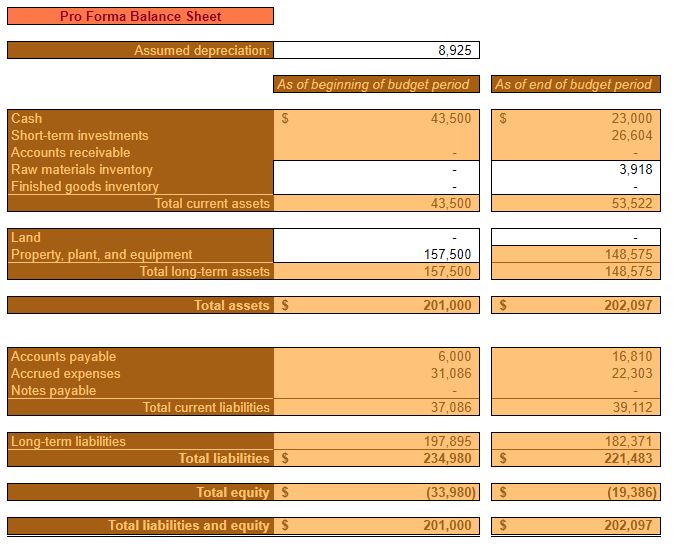
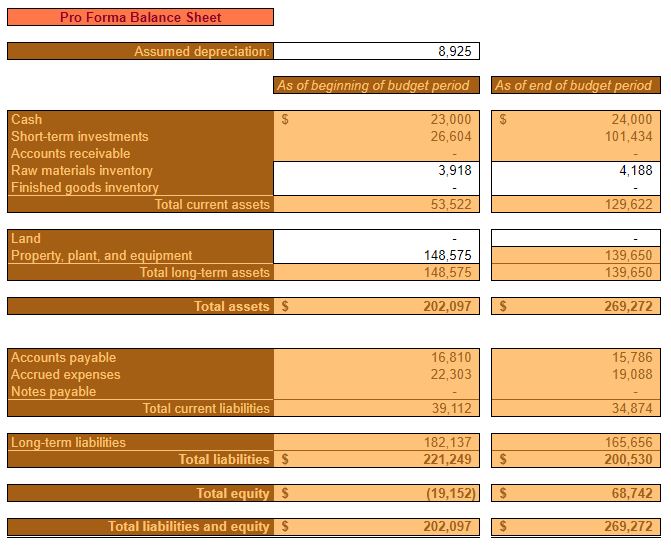
The increase in Unit Sales for year two is expected to help turn negative equity positive. Additionally, prudent cash management is expected to contribute to the security and solvency of Diner, LLC.
Click to enlarge
Maintaining an Ending cash balance of $24,000 every month puts the restaurant in a position where it doesn’t need to rely on any short-term or long-term financing. It also facilitates the ability to put excess cash into a liquid investment account. This investment account is available to offset negative, unforeseen, events. Or, to put towards future growth and expansion.
Restaurant cash budget Year 3
Year three is expected to see the continued reduction of debt and a subsequent increase in assets and equity. Certain balance sheet items like inventory, Accounts payable, and Accrued expenses are expected to increase in line with increasing costs as outlined in the operating budget.
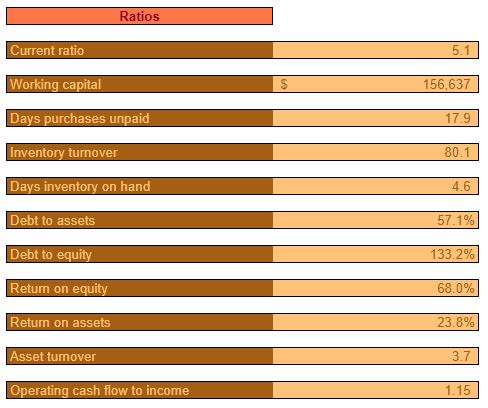
All ratios at the end of year three are expected to be relatively healthy. At this point, Diner, LLC. is expected to still have a relatively high Debt to equity ratio. This ratio is expected to continue to decrease, however.
Restaurant cash budget Year 4
Throughout year four, assets and equity will continue to grow.
Cash and short-term investments begin to make up a considerable portion of assets.
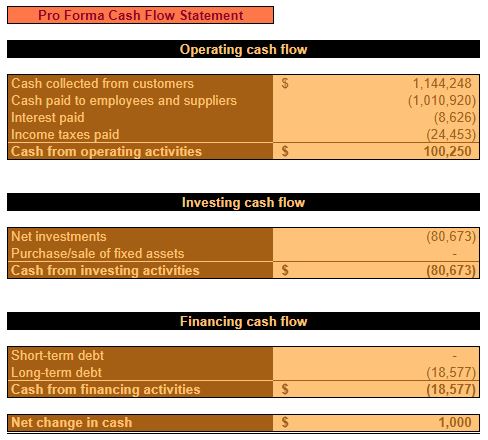
The year four pro forma cash flow statement offers a different perspective than the income statement and balance sheet. It shows how it’s anticipated to be cash positive from operating activities and how the majority of that cash will be used to pay down debt and put into a short-term investment account.
Restaurant cash budget Year 5
By the completion of the fifth year of operation, equity is estimated to be between $250,000 and $300,000. Cash balances continue to grow at approximately $1,000 per year, in order to account for increasing expenses.
Barring unforeseen events, Diner, LLC. should be expected to adequately cover expenses and to deposit a considerable amount of cash receipts into short-term investments.
This growing investment account will serve as a margin of safety for unforeseen circumstances and/or will allow for expansion or other projects – should that course of action be chosen.
*pricing strategy example at the bottom of this post
Download the Price Sensitivity Meter
Complete the form below and click Submit. Upon email confirmation, the workbook will open in a new tab.
Video transcript
00:06 hey guys back here with another video 00:10 finally most of my previous videos on 00:15 most of my recent videos have been on 00:17 the subject of QuickBooks Online and go 00:20 in a little different direction with 00:22 this one actually I’ve written quite a 00:25 bit on the website about business plans 00:30 and most of that so far is focused on 00:34 market research for a business plan and 00:37 this is kind of the last piece of 00:39 content on that particular subject and 00:43 from here it’s going to move on to move 00:49 on to writing the business plan in 00:51 earnest but anyhow rather than write 00:55 this one out as a blog post you know 00:58 those were kind of hit and miss as far 01:00 as traffic goes I thought I would just 01:01 do it as a YouTube video and see what 01:06 kind of reception that got and that’s 01:08 what brings us here so like I said this 01:10 is 01:12 part of the part of market research an 01:16 important part of business plans and in 01:19 particular it’s about pricing strategies 01:22 for for startups and really this will 01:25 also work for existing businesses too 01:27 you know you you probably have a little 01:30 more flexibility when you’re settling on 01:34 pricing as a start-up than you do as an 01:36 established business it can be kind of 01:39 hard to pivot into something else when 01:41 your customers come to expect a 01:43 particular particular pricing strategy 01:46 from you so but you know nevertheless if 01:49 you have an existing business and are 01:52 interested in the tool that I may do 01:55 along with this which we’ll get to in a 01:57 little bit and the strategies and that 02:00 there’s a like I said here 16 of them to 02:03 think about and let’s get into it here I 02:06 like to start every video I have with 02:11 kind of a quick answer or summary what 02:14 I’m gonna go over and doing the same 02:18 here so pricing will have a huge impact 02:23 on your business you know that’s your 02:26 probably like and no kidding 02:29 you probably already knew that and you 02:32 know but I had read somewhere wouldn’t 02:35 as kind of doing the research for this 02:37 video about how you know like a 1% 02:40 change in pricing can have up to an 8 02:43 percent change in sales you know and it 02:48 really is if you can 02:51 increased prices by 1% you know that can 02:55 have a depending on the the mix of 03:00 products you’re selling you know that 03:02 can have an enormous effect on enormous 03:06 effect on your on your sales and 03:08 therefore your profitability you know 03:10 keep in mind as we go through this that 03:12 not all strategies are going to be 03:14 appropriate for your business you know 03:17 there’s 16 of them it’s gonna seem a 03:20 little overwhelming and you know don’t 03:25 think that every strategy you know you 03:29 have to work in to your your particular 03:33 business somewhere you know it’s not the 03:35 case it might just be one strategies 03:37 right for you you know it is a bit of 03:40 information overload but I give you all 03:42 this information because you know so you 03:47 can be aware of this about every 03:50 strategy I was able to find I don’t know 03:51 that it’s every strategy period in terms 03:55 of pricing but it’s a quite a few of 03:59 them and a lot a lot to consider but you 04:03 know just you some will jump out at you 04:06 as being practical for your business and 04:08 you know those are the ones you want to 04:10 kind of move forward and maybe look at 04:12 implementing and keep in mind that they 04:14 can be combined and different strategies 04:17 can be used on different products and 04:19 services or different types of customers 04:23 and you know 04:27 things are in the small business world a 04:33 little a little crazy right now I mean 04:36 first potentially he gets shut down for 04:39 a couple of months on account of kovat 04:42 19 and now some small businesses 04:46 fortunately not many in the grand scheme 04:49 of things but you know unfortunate for 04:52 those that it’s impacted or victims of 04:55 rioting looting and other sorts of 04:59 things you know they’re paying the price 05:01 for something that they had no you know 05:06 had no part in no injustice that they a 05:09 pardon and you know of course that 05:11 stinks and the reason I bring all that 05:13 up is it’s you know it’s been a an 05:15 insanely volatile year to be a small 05:18 business owner and you know so as we go 05:22 through these strategies what I’m 05:24 getting at here is that it it’s 05:25 important I think you know not just in 05:29 pricing but in everything to start to 05:31 think about implementing procedures 05:37 policies strategies you know whatever 05:39 you want to call them just you start 05:40 start doing business more flexibly with 05:45 more flexibility and 05:49 you know be able to pivot you know they 05:52 not get you as RIT as rid of as much 05:56 rigidness as you can because it’s I 05:59 don’t know manda it’s a it’s been a 06:01 crazy year and it’s a crazy world and 06:04 maybe this is you know maybe we’ve seen 06:08 the worst of it for a while that maybe 06:10 we haven’t you know I honestly don’t 06:13 know I wish I did but you know like I 06:16 said I think it’s important to move 06:19 forward and the lessons that can be 06:20 learned from this is that yeah the 06:23 rigidity just won’t won’t work so you 06:26 know every business is different so I I 06:29 hate to speak in such generalities you 06:32 know if you’ve watched any of my other 06:33 videos ready and other my posts that you 06:37 know I hate I like to get specifics 06:40 where I can or you know concrete 06:42 information where I can and not not deal 06:45 in abstraction as much because you know 06:47 that doesn’t help you I mean it might 06:49 give you a little something to think 06:50 about but you know people people want 06:52 answers and you know so I beg your 06:56 pardon for that but you know that’s the 07:01 best way I can phrase it now you know 07:04 just you know with everything else but 07:09 in particular since we’re on the subject 07:10 of pricing strategies here just to 07:12 gravitate more towards the ones that are 07:14 more that are more flexible if you can 07:19 then kind of we go through the 07:22 strategies we’ll we’ll get to a tool 07:24 that I made in Google sheets so you can 07:27 download it for free it’ll be on I 07:30 always make a post of the videos when 07:34 I’m done and where I’ll have the slides 07:38 here and then transcript from the video 07:41 the video itself and in cases like this 07:44 when I reference a particular tool that 07:48 I’ve made a spreadsheet 07:49 this is spreadsheets for business after 07:51 all anyways I’ll make it available on 07:54 there and you can go and download that 07:57 and this is a it’s something called the 07:59 price sensitivity meter it was a concept 08:01 that I’d come across 08:02 that I thought was interesting and 08:04 potentially helpful and what it’ll do in 08:07 essence is give you a range of 08:09 acceptable pricing you know kind of kind 08:12 of give you a some numbers start working 08:15 with and then you can implement the 08:16 strategies that are appropriate from you 08:19 for you from them and like I said 08:23 transcript and slides all that business 08:25 will be on spreadsheets for business 08:27 comm soon 08:31 so you know pricing is a complicated 08:37 subject you know it seems relatively 08:40 straightforward and will be more 08:42 straightforward for some businesses than 08:44 others but you know it’s a complicated 08:48 thing people get hung up on it it’s a 08:52 you know there’s just a lot of factors 08:55 at play you know that there’s course 08:57 competing on price with your competitors 08:59 but then there’s the you know your value 09:02 properties proposition versus your 09:04 competitors your you know unique selling 09:08 proposition USP Matt how you position 09:11 yourself the customer service quality 09:14 and all those things factored in and you 09:18 know really it if you look back at the 09:22 last year two years ago five years ago 09:25 whatever I mean you know for a little 09:29 thought experiment look back at those 09:31 years and ask yourself you know if I had 09:36 increased prices I mean again and maybe 09:39 just a little bit you know 1% bump here 09:42 a couple dollars there you know if 09:45 you’re a super small business couple of 09:46 dollars on the right items might have 09:49 you know might have been the difference 09:52 between a mediocre year and a bumper 09:54 year might have been the difference 09:55 between you know ending up in red and 10:00 ending up into black it’s you know it’s 10:05 completely possible so you know it is a 10:10 complicated subject and the point of 10:12 this is to hopefully an army with a 10:15 little information excuse me 10:20 army little information to kind of see 10:24 through the fog and iron you know get a 10:27 firm grasp on what your pricing strategy 10:31 should be and again I’ll reiterate not 10:33 all these strategies are going to apply 10:35 to you you don’t have to work every 10:37 single one into the 10:40 into your business okay and pressing can 10:45 being overwhelming oops back pricing can 10:49 be overwhelming touched on that earlier 10:51 a lot of things to consider dismiss 10:53 strategies that won’t work you know I 10:56 would also urge you to where possible to 11:00 air on the higher side of pricing you 11:03 know if you’ve ever done any reading on 11:05 the subject or research you know you’ve 11:08 you’ve seen similar sort of things said 11:11 and it’s it can feel tough to do you 11:13 know cuz II you nervous about losing 11:16 sales on account of pricing and you know 11:21 but it’s always easier to reduce for 11:23 promotions and you know hell you can 11:25 even run promotions fairly frequently 11:29 speaking of which I have a post on 11:31 promotions on spreadsheets calm 11:34 spreadsheets for business calm I wish I 11:37 owned spreadsheets calm but I don’t 11:39 spreadsheets for business about pricing 11:44 in QuickBooks Online you know running 11:47 promotions in that and then one beyond 11:49 that which also comes with the 11:51 calculator in regards to you know just 11:58 running promotions in the effect it can 12:00 have and everything so it’s like a 12:01 little handy little tool to estimate 12:04 what the effects might be 12:10 you know and I mentioned also earlier 12:13 that you can use different strategies 12:16 for different products and services you 12:19 know different categories different 12:20 customers you know again it be be 12:26 flexible you know not not rigid so 12:31 consider all these strategies we’re 12:34 gonna go through and use the 12:36 accompanying tool play around with it 12:39 download it you know and then armed with 12:43 all that information rely on your 12:45 expertise your intuition and you know be 12:49 willing to make some mistakes some trial 12:51 and error in terms of pricing it’s you 12:53 know mistakes are gonna be made it’s 12:57 it’s like budgeting you know we’re 12:59 forecasting I’ll tell you right off the 13:02 bat you’re not gonna get not gonna get 13:05 it exactly right forecast your exact 13:07 unit sales exact revenue exact costs 13:10 exact labor needed you know marketing 13:13 that the point isn’t to you know this 13:17 isn’t school you’re not graded on how 13:18 close you get to its actual you know 13:21 it’s really just to go through the 13:23 thought experiment of the whole thing 13:26 and to you know just think at everything 13:30 from from different angles and net and 13:32 then you know so don’t don’t worry about 13:34 making mistakes with your pricing when 13:36 you know try something and learn your 13:41 lesson from it and if it’s good keep it 13:43 if it stinks then do something different 13:48 okay so we’ll get into the strategies 13:52 here 13:58 all right and I’ll try to go through 14:00 them fairly quick we’re about 14 minutes 14:02 in now and you know I realize that 14:08 longer videos people people lose 14:10 interest and I guess I can’t blame him 14:14 so like I said I’ll try to go through 14:15 strategies pretty quick and then we’ll 14:17 get we’ll get to the touch on a couple 14:22 of things and get to the tool how to use 14:24 it okay so the first strategy is price 14:27 leadership okay 14:29 this is where basically a single 14:31 business would dictate market price and 14:33 this one isn’t gonna be really practical 14:35 for a startup unless it’s a brand-new 14:38 and brand-new market brand new items 14:42 something nobody’s seen before maybe 14:44 that’s cases you startup probably not 14:46 you know but you know again I just want 14:50 to make you aware of it so this is 14:51 something that oligopolies would do 14:53 which is a similar to monopoly except 14:55 they’re a couple of firms rather than 14:57 just one and this is like Airlines 15:02 wireless carriers film TV music you know 15:05 basically they dictate the market price 15:08 they have enough control over the market 15:10 to be able to do that and any little 15:13 player that wants to come in and get 15:15 involved with that or any other business 15:16 that wants to try to come in and take 15:19 some of that market share has got a you 15:21 know gotta be aware that the the leader 15:24 of the market is dictating the price so 15:28 premium pricing this is 15:34 by companies selling high quality goods 15:36 or services and that might be you that 15:39 might be your business model and you 15:41 know luxury items in that and you know 15:43 it’s not always that the items are 15:46 luxury you know luxury is kind of a 15:51 flexible term but you know like some 15:53 clothing brands name-brand clothing 15:55 sometimes is a very low quality you know 15:58 and you you can buy you know whether 16:02 it’s shirts pants accessories whatever 16:05 from a name-brand and it’ll fall apart 16:07 right away you know it’s not it you 16:10 really you’re paying for the name so 16:12 that’s why I say you know Oh having a 16:15 brand name is an instance where you 16:17 could still use premium prep premium 16:20 pricing if you’re not selling 16:22 technically high-quality goods or 16:25 services you know the customers are 16:27 paying for the status the paying for 16:28 that name okay so some examples of that 16:31 and this is not to say these things 16:32 aren’t quality per se but they aren’t 16:34 it’s not a given luxury cars and 16:39 designer clothes and Apple products are 16:41 a couple of examples that I was able to 16:43 find so the opposite of premium pricing 16:48 is economy pricing this is where you’re 16:51 doing bottom dollar pricing okay and it 16:54 depends heavily on selling a high-volume 16:57 products um you know to make up for 17:00 those low margins you you know you’re 17:03 gonna have high margins probably premium 17:05 pricing low margins with economy so you 17:07 got to sell a lot with economy so in 17:09 order to get away with economy pricing 17:11 you’ve got to have a good understanding 17:13 of your cost okay because those margins 17:16 are so low you can’t afford not to 17:18 understand what it takes for you to get 17:21 a product to market in terms of cost 17:23 okay because you you could either you 17:29 could price it obviously too low and be 17:32 selling at a loss and not knowing it or 17:35 conversely you could be pricing it too 17:38 high and leaving room for other 17:45 competitors 17:46 with you know a better grasp under cost 17:49 and can beat you on price because that’s 17:50 what you’re competing on is price you 17:52 know when you’re doing economy pricing 17:54 and a couple of examples that are warm 17:56 Walmart and private labels like you’d 17:58 find at the grocery store next one here 18:02 is premium decoy pricing this one gets a 18:04 little more advanced not quite as 18:06 straightforward so it’s a similar to 18:09 premium pricing 18:11 but it uses a similar product or service 18:16 at a much higher price so it’s priced on 18:22 the high end with a healthy margin okay 18:24 something to use a premium decoy pricing 18:27 you got you got an item a okay with the 18:30 with a healthy margin and that’s the 18:32 item that you really want to sell okay 18:34 but then you bring in item B which is 18:40 similar similar enough for a comparison 18:43 you know maybe with a little added value 18:46 but then it’s just priced through the 18:48 roof I mean it’s a ridiculously 18:51 overpriced and so what this does is it 18:54 plays on the concept of single option 18:55 aversion this is the name of the term 18:57 and it basically says that you know 19:02 customers are less likely to choose an 19:05 attractive product or service if there’s 19:06 nothing to compare it to so you know if 19:11 your business model is such that your 19:15 business is that you it kind of revolves 19:17 around one product you know that it 19:21 could present an issue for you when it 19:23 comes to marketing and sales because 19:25 there’s nothing to compare it to when 19:28 you’re when you’re pitching it to a 19:30 customer they you know people need 19:33 context we make sense of the world by 19:36 how we compare things to each other 19:37 things are things are better worse 19:42 I mean really you know we we categorize 19:45 everything in that way this car is 19:47 better and everybody has a different 19:48 opinion of course there’s no that one 19:50 universal opinion but you know in this 19:52 instance you’re you’re playing on that 19:55 kind of human tendency to just if you 20:01 know if you’re just presented with one 20:03 option well I don’t know is this a good 20:04 value or a bad value you know I’ve got 20:07 I’ve got nothing to compare it to so if 20:10 that’s your type of product you might 20:11 consider something like this add some 20:14 token bells and whistles price it way up 20:17 so then the item you’re actually trying 20:18 to sell looks good by comparison okay 20:21 they’re like damn this is a value you 20:24 know because this other thing that has 20:25 just a little bit more you know is 20:30 priced at this so this must be a good 20:32 value you know that it’s a it’s a little 20:35 bit of marketing trickery there so an 20:38 example the Apple products will do it a 20:44 little bit to where they’ll and I made I 20:47 put a copy of the link that I referenced 20:50 there at the bottom but Apple products 20:53 are have in the past I don’t follow 20:55 Apple that closely but like like a phone 21:01 with a little bit more storage will be 21:04 priced disproportionately high you know 21:08 to getting a little more value and but 21:12 they’re you know but they’re making it 21:14 bad option unattractive it’s there if 21:17 somebody wants it I mean somebody will 21:18 buy it because they want the best that 21:21 quote-unquote the best but you know 21:25 they’re really trying to sell the one 21:27 the more reasonably priced when the 21:29 middle the quote-unquote middle you know 21:31 the good better best they’re trying to 21:32 sell the better version so and then the 21:36 Economist is another classic example and 21:39 you’ll see quite a bit if you never 21:41 delve into this type of research in this 21:44 subject in terms of pricing that it’s 21:48 like 21:49 they sell the electronic subscription I 21:53 hope I’m not misquoting this and then 21:55 the electronic for less the print 21:56 four-way hider well hardly anybody wants 21:59 the damn print when I can just get it 22:01 electronically you know so you’re like 22:05 well why would I pay that much more this 22:08 electronic subscription alone looks much 22:11 more attractive so kind of went on about 22:13 that one for a while but it’s a you know 22:15 it’s kind of a fascinating thing I think 22:17 because of them you know the 22:20 psychological element to it okay so a 22:25 similar pricing strategy is bundle 22:29 pricing 22:32 so you’ve seen this no doubt I know my 22:37 internet company does it TV and Internet 22:41 bundled it’s you no way you pay him way 22:44 less for each you got automobiles with 22:48 extras you know sunroof leather seats 22:56 bigger engine the you know the GT model 22:59 whatever it may be they’re gonna you 23:02 know price it together an automobile you 23:05 can’t necessarily go get a sunroof extra 23:08 aftermarket I mean technically you could 23:10 I suppose but you know and that’s not 23:12 practical most people but excuse me the 23:16 games will bundle also you know Nintendo 23:21 Sony they’ll all sell you know whether 23:24 it’s a bundle of games or bundling the 23:27 console with the games so it you selling 23:32 items together and you selling them at a 23:33 lower price than you would sell them 23:34 separately and it gives a customer 23:37 better value customer recognizes that 23:39 makes attractive but when it does for 23:42 you then is also increased the sales 23:44 volume so included another link at the 23:46 bottom they’re gonna read a little more 23:48 about where I got those examples from 23:51 okay value-based pricing this is based 23:58 on you know and keep in mind like I said 24:01 these these can be combined they’re not 24:05 all mutually exclusive you don’t have to 24:07 pick just one so don’t just want to 24:10 reiterate that so now you base pricing 24:13 is where you price something based on 24:15 how much value your product or service 24:17 provides basically you know what’s the 24:20 utility it gives the the person who 24:23 purchased it you know if you’re selling 24:28 something that gives every every 24:32 customer infinite happiness for the rest 24:34 of your life and you’re selling it for a 24:36 dollar 24:36 well you’re not using value-based 24:38 pricing okay that’s that’s worth a lot 24:42 of money you know to have infinite 24:45 happiness for the rest of your life you 24:47 know you could charge almost anything 24:49 for that 24:52 so it’s it’s basically pushing the 24:55 threshold of what the customer is 24:56 willing to pay based off of your value 24:59 proposition similar to project pricing 25:01 which we’re covering a little bit it’s 25:04 you know cost is not critical in the 25:07 sense that you still need to be making a 25:09 profit of course you know there you 25:12 won’t be in business for long but it 25:14 might be that the value of what you’re 25:17 selling is not much above your cost well 25:21 then you need to look at lowering the 25:23 cost or increasing the value of course 25:26 flipside you know the margin might be 25:28 really big so not it’s not to be 25:32 confused something with another one we 25:35 talked about earlier value pricing of 25:37 course that was economy pricing where 25:39 you know you’re selling low margins 25:41 high-volume okay so in this case it 25:45 could be you know that luxury 25:46 automobiles would fall but fall under 25:49 that category like I said some might be 25:53 overpriced others might be priced at the 25:55 value they provide you know they’re 25:56 high-quality automobile that oh you know 26:00 that is reliable and beautiful and 26:03 everything you want 26:05 and you know it’s priced accordingly but 26:08 you if you’ve got the money you pay that 26:10 because that’s what it’s worth to you 26:12 another example might be professional 26:15 services or consulting okay you know 26:19 particularly those for a business if 26:22 they’re providing a lot of value if 26:23 professional service is going to help 26:25 you make a million dollars more in sales 26:27 well and charging you a hundred thousand 26:29 dollars potentially is it’s well worth 26:33 of you know that’s what it’s worth I 26:35 mean you’re still earning an excellent 26:37 return 26:40 this one’s psychological pricing this is 26:42 one obviously it can be easily combined 26:44 with others it’s a we’ve all seen it you 26:47 see it everywhere you know we think we 26:51 can see through it but you know research 26:53 says that it that it works that they 26:55 sell businesses sell more products and 27:00 services when they’re priced with that 27:04 99 cents eighty-nine cents or just you 27:07 know just shy of a certain threshold you 27:11 know it’s not by seeing a one at the the 27:19 beginning of the 1999 price it you know 27:21 I get you know again I’m sure you think 27:25 you see through it I think I do but you 27:27 know apparently not everybody does but 27:30 you know if I seen that one instead of a 27:31 two instead of just pricing is straight 27:33 twenty you know it they’re more they 27:38 feel like they’re getting more of a 27:40 bargain so you know you sacrifice very 27:43 little in revenue to potentially sell a 27:46 lot more so definitely a strategy worth 27:50 considering and like I said we see in 27:52 retail at a time and see with 27:54 automobiles you know car price to 27:57 nineteen thousand something 29,000 some 28:01 thirty nine thousand something you know 28:02 it’s a frequently relied upon strategy 28:08 okay 28:11 tration pricing 28:15 so this is a this is a potential 28:19 strategy to use the first startup it’s 28:23 typically one used by new market 28:25 entrants and it’s used to accumulate 28:28 market share with low pricing basically 28:31 swoop in say hey we’re brand new to this 28:33 market look how attractive this pricing 28:36 is give us a shot okay and you know 28:40 hopefully that the pricing is good 28:46 enough that it will compel people to try 28:47 your product or service that day they’ll 28:49 be like you know might as well give 28:53 these people a shot you know this is a 28:55 this a hell of a bargain you know and 28:58 maybe maybe it stinks hopefully not but 29:01 in this what they’re thinking you know 29:03 maybe this product or service stinks but 29:06 you know at this price I gotta at least 29:08 try it okay so it’s short-term strategy 29:10 you don’t if you do it for long term 29:12 you’re gonna be doing economy pricing 29:14 and you know that’s tough for small 29:16 businesses to do economy pricing they 29:20 just don’t have the economies of scale 29:22 that a Walmart or whomever does so you 29:27 know again you want to keep this 29:28 strategy to the short-term and be ready 29:30 to transition to a new strategy you know 29:35 to raising prices to a more appropriate 29:39 level later and hopefully by getting 29:41 people to try your product or service by 29:44 luring them with the penetration pricing 29:46 your unique selling proposition you’re a 29:49 quality customer service whatever it may 29:52 be will compel them to remain customers 29:54 then you know you’ll probably have some 29:56 fall-off of demand of course but you 29:58 know hopefully then you’ve got gotten in 30:01 there and claimed a little bit of the 30:04 market for yourself so you know you can 30:07 then move on to a new strategy build 30:11 your business off of that initial grab 30:13 of market share and a couple examples 30:16 businesses that have done this is 30:17 Netflix and not the Netflix is expensive 30:21 now by any means and this potentially 30:25 better value now than it was but you 30:26 know I mean what was it 30:28 $5.99 799 or something when it first 30:31 started you know very very inexpensive 30:34 and it’s worked its way up there since 30:36 and you know that people at that price 30:40 said I even if you know I mean trillion 30:43 find something to watch them here will 30:45 try it for $7.99 a month whatever you 30:48 know so they they penetrated the market 30:50 stole market share away from the cable 30:52 companies or the movie theaters 30:55 potentially or you know the the whole 30:57 gamut of different sub interest 31:01 industries that they compete against 31:09 you know Google Fiber did this I don’t 31:14 know what that’s priced at now but you 31:17 know if this was back when it first came 31:19 out and they had gigabit an Internet and 31:21 you know it was absurdly inexpensive I 31:25 think they kicked it off here not far 31:27 from me and was it Topeka or Kansas City 31:30 Kansas or something like that and you 31:34 know yeah in order to get people to try 31:36 it they went with the low price and I 31:38 would imagine the price has gone up 31:40 since then so you know any any business 31:46 that uses a low introductory price is 31:51 using penetration pricing strategy 31:56 so a strategy that runs in contrast to 32:00 that is skimming pricing okay now when 32:04 you see this used as when research and 32:07 development or costs or just the cost in 32:12 general of bringing a product to market 32:14 are high okay so there was a lot a lot 32:18 of a lot a lot of capital expended 32:21 before this product was even able to be 32:26 offered for sale okay so so the 32:29 reasoning is we’ve got to charge a 32:32 pretty high price just you know we’re 32:35 not we’re not gonna make as many sales 32:37 as we potentially could but we you know 32:40 we need to make big sales to get big 32:42 money coming in to recoup those costs to 32:45 get closer to breaking even you know do 32:49 to make some big strides towards 32:52 breaking even and then as time goes on 32:55 and you know the early adopters buy it 32:57 okay then you’re able to lower the price 32:59 a little bit and you know then people 33:04 are maybe you’re like okay it was this 33:07 now it’s this so that’s a bargain and 33:09 you to you know a few more customers and 33:11 so you’re selling more and your 33:13 economies of scale are getting better 33:15 and the price can continue to be lowered 33:18 and you know and for this particular 33:22 strategy and the businesses that use it 33:24 it’s often necessary to start lowering 33:29 that price because if it’s a rapidly 33:32 moving industry you know electronics 33:35 computer equipment whatever it may be 33:39 um you know you better you damn well 33:43 better lower that price because 33:44 something new 33:46 better fancier you know faster smaller 33:51 whatever it may be is is on the horizon 33:54 if is if it isn’t already there so you 33:57 know that the lowering the price isn’t 33:59 just to make a higher volume of sales 34:02 it’s like I said out of necessity 34:05 because what it is that you initially 34:07 brought to market it ain’t so cutting at 34:09 cutting edge anymore 34:10 okay so again this is a short term 34:13 strategy and like I said you’re selling 34:16 to early adopters and 34:17 it’s kind of the opposite of the 34:19 penetration pricing and you know it’s 34:21 the cutting edge technology you know 34:25 game systems with the recent 34:27 announcement of the PS 5 even though I 34:29 don’t think they priced it yet 34:31 that I’ve seen you know those gaming 34:35 consoles are always priced in that 34:36 manner with the skimming you know the 34:39 price their highest when they’re first 34:41 introduced and as time goes by that 34:43 price goes down and by the time there’s 34:45 a next-generation console out well 34:46 forget it you can pick up the second 34:50 generation console for pennies on the 34:53 dollar 34:58 trucking along here we’ve got 35:01 pre-emptive pricing and this is another 35:03 short-term strategy now this is one that 35:06 would be used by somebody’s already in a 35:08 market and is responding to a new 35:12 entrant into the market and what they’re 35:15 doing is the lowering pricing so it’s 35:19 similar to penetration pricing but again 35:24 they’re already established in the 35:26 market they’ve already got their market 35:27 share and they want to keep it okay so 35:29 now look in the game market share and 35:31 they want to keep what they got and you 35:33 see this used by monopolies and big 35:36 businesses they’ll even have lost 35:39 leaders in some instances you know 35:41 grocery stores who sell bread or milk 35:44 for a slight loss because you know they 35:48 the prospect of spending so little on 35:52 bread or milk is so irresistible to so 35:54 many customers well they’re gonna come 35:56 in for the bread and milk and they’re 35:58 just gonna do the grocery shopping there 35:59 because grocery shopping is a pain in 36:01 the ass they’re not gonna go to the new 36:04 grocery store and hang about it are 36:07 already at a grocery store you know they 36:08 just said that you know then they make 36:10 up the the lost margin on you know the 36:16 lost leaders with other higher margin 36:20 products or with volume and so what what 36:23 does I do you know of course that 36:24 discourages competition that discourages 36:27 the new guy the little guy from getting 36:31 into the market so this is a defensive 36:34 tactic basically and like I said not one 36:37 typically used by startups and some 36:39 examples you know it had it happens and 36:44 I mean I think Walmart you know their 36:45 grocery stores and it was Walmart of 36:47 course which is a little infamous for 36:49 this 36:49 I imagine Walmart still does it in some 36:52 respects but you know I they the example 36:59 I I found was a prescription prices 37:01 where they would sell some prescription 37:03 drugs you know sell them either at a 37:06 very low margin or as lost leaders and 37:08 you know prescriptions are can be a big 37:12 chunk of people’s budget and you know 37:15 the prospect of saving money on them is 37:17 like I said it’s irresistible well okay 37:20 so we’re gonna get our prescriptions 37:21 filled at Walmart and we gonna get back 37:23 in our car and drive a mile down the 37:26 road to go to the groats other grocery 37:28 store we just gonna do our grocery 37:29 shopping at Walmart you know well a lot 37:32 a lot of people you know and on my 37:35 mother she would she’d drive all around 37:37 town buying each individual item it’s on 37:40 sale from each individual grocery store 37:42 I think if if there were more than 24 37:45 hours in a day but most people are just 37:48 going to you know do the grocery 37:51 shopping there so you know I thought it 37:54 seems like such a kind of 38:00 I don’t know if sort of thing you feel 38:03 like is done all the time but I really 38:05 had our time find an example so I’m sure 38:07 there are more out there I’m sure it is 38:09 done and maybe it’s just not as 38:11 documented as easy as you might know as 38:14 you might think it is rather but anyhow 38:18 that it is pre-emptive pricing probably 38:20 not not something you’ll have to worry 38:23 about but something should be aware of 38:29 okay so cartel pricing we’re all 38:32 familiar with the word cartel and 38:36 you know the reason is you know because 38:41 this is sometimes how pricing is done 38:46 you know when they sell drug cartels 38:48 sell commodities of course you know 38:51 heroin you know heroin users not real 38:55 particular about their supplier as long 38:58 as the quality’s the same I’m 39:00 speculating here and not speaking from 39:02 experience and but you know drugs are a 39:05 commodity so it’s a it’s in essence a 39:09 gentleman’s agreement to keep prices 39:10 high so if you got two competitors it’s 39:12 like why sit here and fight on price you 39:17 know that just digs in to our margins if 39:21 there’s you know a few just a few of us 39:23 let’s just say you know nope this is 39:26 what we’re pricing it at okay and we’ll 39:29 compete through other channels you know 39:30 and drug cartels probably you know don’t 39:34 compete terribly fairly but in principle 39:39 you know like I said you would agree to 39:41 compete there other chance whether it’s 39:42 marketing or trying to lower your own 39:44 cost things like that you know to to get 39:49 an edge so it’s not a strategy that will 39:55 work with too many businesses in the 39:57 marketplace because you know between two 40:01 people two businesses okay three maybe 40:05 four 40:05 good luck five forget it you know I mean 40:09 I’m I’m you know speaking hypothetically 40:14 they’re you know the number it just 40:17 depends on them the business I guess but 40:19 the point being eventually if you have 40:22 too many competitors somebody’s gonna 40:24 take the easy road somebody’s gonna say 40:27 now I’m just gonna I’m gonna lower my 40:29 prices and try to steal market share you 40:31 know somebody will give in somebody will 40:33 cave and then that in turn forces all 40:37 the other market participants to do the 40:39 same thing so he got examples are OPEC 40:45 you know 40:48 drug cartels of course in the federal 40:51 reserve is in essence a cartel of banks 40:55 and Siemens in Europe and again I found 41:00 a link or references that example okay 41:06 so cost plus pricing this is a pricing 41:11 strategy that focuses purely on the cost 41:13 and it just adds a fixed percentage to 41:16 the cost of products or services so the 41:20 old legend was that Nebraska Furniture 41:24 Mart before Berkshire Hathaway bought it 41:28 sold it costs plus 10% and did a high 41:34 volume of business but this is still not 41:36 a pricing strategy I would recommend 41:38 recommend and you know Makana Cost 41:42 Accountant and 41:43 so I you know recognize the importance 41:47 of understanding your cost that this is 41:49 a kind of a lazy lazy pricing strategy 41:52 and cost by no means should be the only 41:55 factor to consider and when it comes to 41:57 pricing 42:01 examples that I found were cutting-edge 42:06 technology smart phones other 42:08 electronics 42:12 and that they were is a little hard to 42:14 find some more specific examples but 42:17 like I said there was a Nebraska 42:19 Furniture Mart I do remember that from 42:21 back when I read a lot of books on 42:23 Warren Buffett 42:27 okay so dynamic pricing this is a 42:34 flexible pricing strategy that changes 42:37 with demand so it basically prices go up 42:42 as demand goes down I’m sorry prices go 42:48 up as demand goes up excuse me 42:50 prices go down as demand goes down to 42:52 lure customers in and we’re talking that 42:56 these prices can change inside of a day 42:59 you know and so very quickly very very 43:03 dynamic it’s the name and you know a lot 43:07 of times you’re gonna need software with 43:10 a quality algorithm to keep up with 43:13 those changes in demand and to make sure 43:16 that you don’t get hosed and examples 43:18 are hotels and airlines 43:24 freemium pricing this is a combination 43:28 of the words free and premium premium 43:32 course and basically where you offer for 43:36 free a bare-bones version of your 43:39 product really just to kind of whet 43:41 people’s appetite give them a chance to 43:44 interact with it and see field like a 43:48 like a sample at a grocery store at 43:50 Costco or Sam’s or whatever and the goal 43:54 is of course to get customers to like it 43:57 your little free taste test and then 43:59 upgrade to a paid version and it’s in 44:04 some essence more of a marketing 44:08 strategy than a pricing one but you know 44:11 I did include it in here because it’s 44:13 worth we’re thinking about and you see 44:15 this a lot with the software and 44:17 software is a service in particular 44:23 okay so we’re getting getting down in 44:26 nitty-gritty here to more hourly pricing 44:31 this is a pricing strategy that’s 44:34 exclusively for services you know it’s 44:39 where you trade time for money and it’s 44:41 not advised I wrote a post on my other 44:44 side invest some money calm about 44:46 business models and kind of the 44:49 hierarchy and which are the most 44:51 attractive and trading time for money is 44:53 at the bottom it is the least attractive 44:56 and it’s not advised because you can’t 44:59 scale you can’t make more time in the 45:02 day no matter how hard you try no matter 45:05 what you do and you know it’s some 45:11 people when they first get into owning 45:14 their own business is bookkeeping or 45:15 freelancers or that do that and it’s 45:19 it’s simple in some respects certainly 45:22 but you know it’s a it just puts a cap 45:25 on your success so it’s not recommended 45:27 and but examples and there are examples 45:31 that put employees because that’s 45:33 exactly what most employees do you know 45:35 those that aren’t on some sort of 45:37 commission or large bonus program trade 45:42 time for money you know it’s what I do 45:45 and it’s ill-advised it’s not why you 45:49 got into business for yourself I mean it 45:52 you know aside from the freedom and the 45:55 control of course but you know 45:59 focuses on input you know your time and 46:02 labor or someone or another employees 46:04 time and labor it’s the same you can’t 46:06 create any more hours in the day for 46:08 other employees either but it focuses on 46:11 that input rather than the output that’s 46:13 the value received by your customer so 46:15 again not an advised strategy typically 46:19 but you know you have to be we’re aware 46:23 of its existence 46:29 project pricing is kind of the opposite 46:32 of hourly pricing and it’s also 46:34 exclusively for services because it’s a 46:37 flat fee charge for a deliverable it 46:41 might include you know products in there 46:47 too in terms of the pricing so a may be 46:51 exclusively for services but it’s 46:54 typically a services pricing strategy 46:57 for services and similar the value 47:00 pricing you know the fee you charge is 47:03 for deliverable and it’s hopefully based 47:06 on the value received by the customer 47:08 for that deliverable and it focuses on 47:11 the output you know the customers value 47:12 received rather than the input time and 47:14 labor some examples that do this it can 47:18 be done with some of the other examples 47:19 bookkeeping freelancing and that but you 47:23 know other examples are consulting 47:25 contractors and freelancers like I said 47:30 they can do it too so alright those are 47:33 the pricing strategies and I’ve been 47:36 going on for a while here but keep 47:41 pushing along and 47:45 talk about a little bit now about some 47:46 factors to consider when you’re talking 47:50 about pricing and some of those main 47:54 factors to consider are costs your 47:56 customers competitors new products and 47:59 market segmentation segmentation rather 48:02 get into that here so costs and pricing 48:07 I said cost plus is not typically a 48:13 recommended strategy but it is critical 48:16 that you understand your cost okay so 48:19 again just because I say cost less is 48:21 and how you want to pry something 48:22 doesn’t mean you can just be willy-nilly 48:24 with understanding your costs critical 48:26 that you understand your cost you want 48:28 to get as accurate as possible knowledge 48:32 of what each product and service cost 48:34 you deliver to customers okay so you 48:36 know your true margins and keep in mind 48:38 cost is more than labor and materials 48:40 there’s overhead there’s sgna expenses 48:44 and there’s just the manner in which you 48:46 allocate costs okay there’s a lot it’s 48:48 there’s no cut and drying method for 48:50 doing that some are going to be better 48:52 than others 48:53 some are gonna be more accurate than 48:55 others is what I mean an activity-based 48:58 costing I’ve got a page on that on the 49:02 website and you know that’s a generally 49:07 regarded as a well it’s certainly more 49:10 accurate than just generic costing but 49:15 excuse me it’s also a very heavily 49:18 involved process so not to be taken 49:23 lightly but if it’s done and with some 49:26 with some sense and taking seriously and 49:29 seeing through can provide some good 49:31 insights okay so you know the other 49:34 thing about constitu is categorization 49:36 ok that’s important with whether you you 49:40 understanding what of your costs are 49:43 fixed and what are variable because this 49:44 is gonna impact your operating leverage 49:46 you guessed it another subject I have a 49:50 post on on the website and you know 49:53 operating leverage to use the hi fix use 49:56 of five high fixed costs is 49:58 it gives you the ability to learn 50:02 extraordinary returns if you can sell 50:04 enough 50:05 okay so customers ultimately when it 50:09 comes to pricing your customers have to 50:10 buy in okay you have to understand what 50:15 they expect in terms of customer 50:17 services quality and of course pricing 50:20 and you know customer service and 50:25 quality aren’t gonna affect your cost so 50:27 it’s kind of a circular circular sort of 50:30 thing a feedback loop and you want to 50:32 know your customer avatars I talked 50:34 about that on some of my business plan 50:37 posts particularly and get down here 50:41 some of the earlier ones what is it yeah 50:47 business plan demand talks about 50:49 customer avatars and that’s basically 50:51 the demographic makeup of your customers 50:54 you know that you’re kind of in terms of 51:00 gender age income all those demographic 51:05 factors what you’re you know who your 51:10 customers are so you want to know them 51:12 okay you wanna know what compels them to 51:14 make purchasing decisions and beyond 51:16 that you want to have a firm grasp on 51:19 your unique selling proposition 51:20 something I’ve written about on invests 51:23 the money website and you know this is 51:27 basically what makes you your business 51:29 unique okay and this is how you separate 51:33 yourself from your competitors and you 51:35 know can can then charge what charge 51:39 your best price 51:42 competitors you’re gonna want to do 51:44 little detective work on on them and 51:48 understand you know how they position 51:50 themselves with strategies they use how 51:53 much do they offer in terms of customer 51:55 service and quality and what is their 51:57 unique selling proposition okay because 52:00 you know your customers are making 52:02 choices between you and competitors you 52:05 want to understand who you’re up against 52:07 okay you want to you want to do your 52:09 scouting report 52:12 so new when it comes to new products and 52:14 pricing and in this case we might be 52:16 talking new to you not the market and 52:20 you know a lot of times you do want to 52:23 come out of the gates and try to capture 52:25 market share quickly and have a high B 52:27 through penetration pricing strategy but 52:30 it depends on the market saturation 52:32 depends on the sophistication the 52:34 competitors whether that’s the strategy 52:36 you have to adopt but again I want to 52:40 remind you that is a short-term strategy 52:43 it needs to be part of a larger plan and 52:45 larger plan you know when it comes to 52:48 new products to don’t discount the value 52:50 of transparency and authenticity with 52:52 your customers you know when especially 52:56 if you’re making direct sales you know 52:59 why are you charging what you charge 53:01 okay a customer like might like that you 53:05 know they understand you’ve got to make 53:06 a profit and you know if they get taken 53:10 care of and feel like they’re in good 53:12 hands they’re a lot of times might be 53:15 willing to pay a little higher price and 53:18 you know they they appreciate you being 53:20 upfront and really given them the 53:24 information they need to compare the 53:27 value proposition between you and the 53:29 competitors so you know don’t as a rule 53:34 of thumb 53:34 yeah B be transparent in that respect I 53:37 think your customers will probably 53:39 appreciate it and then market 53:43 segmentation pricing I touched on this 53:46 earlier you know not all your customers 53:50 are the same different avatars other 53:52 differences that could really affect the 53:54 cost that’s needed to serve those 53:56 customers geography the amount they buy 54:00 and the timing of the sales you know did 54:04 they buy off and do they buy in peak 54:07 season not peak season things like that 54:09 okay so we’re not talking about price 54:11 discrimination here charging essentially 54:15 the same customer customers to different 54:19 customers to different prices no I mean 54:21 we’re talking about real things that 54:23 effect you know that you can justifiably 54:26 charge different prices for so don’t you 54:30 know depending on your business don’t 54:32 just make a blanket 54:35 prices pricing strategy you know think 54:37 about is it are there certain customers 54:40 that you could and should charge more 54:42 because they cost more to serve because 54:44 you know they’re getting a higher value 54:46 whatever it may be last thing we’ll 54:51 touch on here before the pricing tool is 54:57 the business plan and pricing okay so 54:59 like I said this is part of a bigger 55:02 series on business plan in particular 55:07 you know market research for a business 55:09 plan and you know pricing effects market 55:14 research of course who your competitors 55:16 are gonna be and it’ll affect the demand 55:20 you know demand and pricing are more you 55:25 know generally speaking inversely 55:28 related though you know that can be 55:30 worked around pricing will affect your 55:33 market size your serviceable available 55:35 market and the serviceable obtainable 55:37 market what you charge in price might 55:41 affect the location of your business 55:42 okay some locations are going to be more 55:44 conducive to higher prices and/or lower 55:47 prices the demographics where you are 55:49 you know he you got to think about that 55:52 again depends on your type of business 55:56 it might affect how you calculate market 56:00 saturation and I think that was my last 56:03 post on 56:05 market research yep market saturation 56:07 okay 56:09 and not post talk about finding and 56:12 setting a benchmark okay as you’re 56:14 researching for your business plan or 56:17 just for your annual planning you know 56:23 your pricing will affect what you choose 56:26 your benchmark and number four will 56:28 determine you know how Sacchi 56:32 saturated the market might be it’ll 56:35 affect your marketing of course and 56:37 it’ll affect your financial projections 56:39 of course you know your budgeting 56:42 capital budgeting operating budgeting 56:45 and financial budgeting and all of your 56:49 income state or all of your financial 56:50 statements income balance sheet and cash 56:52 flow okay 56:57 let’s talk a little bit about tool for 56:59 pricing I will put a link in the 57:01 description and this tool and there’s a 57:05 little snapshot of it 57:06 now I’ve got it up here so I can 57:09 directly reference it too but it’s in 57:12 the slides there and it’s inspired by 57:15 something called a Van Weston dorp as a 57:18 price sensitivity meter or just price 57:21 sensitivity meter for short 57:24 Dutch fellow I think came up with it and 57:28 what you’re doing in essence when you 57:31 use this tool you’re answering four 57:33 questions for a range of prices so for 57:37 for every price 57:40 in this range or not you know not every 57:43 price to the penny but you know for a 57:46 bunch of different prices you’re 57:47 answering four questions okay 57:49 these questions are what percentage of 57:51 people would question the quality of 57:53 this product or service at these prices 57:56 okay 57:57 ie they would think it’s too cheap 57:59 something’s wrong with it 58:00 it’s none nothing worth a damn is going 58:04 to be this inexpensive okay what 58:07 percentage of people would think that 58:08 the product or service is a bargain at 58:10 these prices okay so another way of 58:14 thinking that is it’s not expensive it’s 58:16 a bargain alright for each of those 58:20 prices what percentage of people would 58:22 think this product or service is getting 58:24 expensive so it’s no longer a bargain 58:26 it’s just it’s starting to get any 58:29 expensive range okay and what percentage 58:33 of people would think this product or 58:35 service is too expensive to these prices 58:38 ie that one doesn’t need an ie too 58:42 expensive too expensive you know what 58:44 that means I know what that means 58:48 okay so those are your four questions 58:50 and so when you answer these four 58:52 questions over a range of prices okay so 58:56 right here see here we got our range of 58:59 prices and we’re answering this question 59:01 the percentage of people that would 59:04 think 59:07 you know that would answer these 59:09 questions as follows 59:11 or is it shown over here at these prices 59:13 and shown here and what that does is 59:16 graph it out for you and then this well 59:19 I put in the table here to give you the 59:21 exact number but then you can see it on 59:22 the graph too and each of these points 59:24 where they cross provide you with the 59:27 information okay a couple of links real 59:33 good links at the bottom there on this 59:37 subject so like I said provides pride 59:44 the graph and the table provides pricing 59:47 insights and ideas and a what’s known as 59:50 a range of acceptable pricing okay so 59:53 the intersection of lines what do they 59:55 tell you all right 60:07 and I didn’t do this right well I’ll 60:09 tweak this table okay so we’ve got 60:17 marginal cheapness okay and if you’ve 60:22 ever watched my videos before which you 60:24 probably haven’t because not many people 60:25 have but you know I’m not above tweaking 60:29 a table on the fly here 60:43 okay 60:51 okay so the first one here we’re 60:53 questioning quality and getting 60:55 expensive intersect this is known as the 60:57 point of marginal cheapness okay or PMC 61:00 it means that any lower of a price could 61:06 mean that you’ll lose too many sales to 61:07 a perceived lack of quality okay so you 61:14 know there are there are basically 61:17 already quite a few people who think 61:19 that the product is cheap bordering on 61:22 too cheap so lowering it anymore 61:24 in theory isn’t gonna give you a bigger 61:28 volume of sales to offset the people 61:32 that just won’t buy it because they 61:33 think it’s not worth a damn okay so the 61:37 next point the optimum price point is 61:39 they call it and doesn’t mean you have 61:40 to choose this price point it’s just 61:43 this name is where the same percentage 61:48 of people and this is hopefully a low 61:50 percentage of people 61:52 feel the the product or service is too 61:55 expensive and they think the quality is 61:58 questionable okay so you’ve got both it 62:00 this is where both extremes intersect 62:02 okay but where they intersect this hope 62:06 again hopefully a low percentage because 62:08 these people aren’t going to buy in 62:11 either instance because they’re gonna 62:13 either question the quality or they’re 62:15 gonna think it’s too expensive its 62:18 overpriced so it’s the point you’re 62:20 minimizing those extremes okay the next 62:29 one is indifference price point where 62:32 bargain and getting expensive 62:44 intersect 62:50 so here this is the same hopefully high 62:53 percentage of people are in that middle 62:57 ground okay where a lot of them and and 63:01 this is the one where I see the most 63:03 kind of people who’ve written on it 63:05 recommended that you get your price if 63:07 you’re you know again I’d take 63:10 everything into consideration but this 63:12 is a good starting a point okay 63:14 ironically not the quote unquote optimum 63:16 price point just what they were named 63:18 and you know and I guess the name stuck 63:21 but the rationale changed over the years 63:23 it’s kind of an old model but so it’s 63:28 the same again hopefully high percentage 63:30 of customers feel the product is it’s 63:31 just starting to get expensive and same 63:35 percentage of people think it’s a 63:36 bargain okay so these are the people 63:39 they’re gonna make purchases all right 63:42 so that you know again this is where 63:48 potentially you would have the highest 63:50 volume depending on the quality of your 63:51 information and if finally the last one 63:54 is the point of marginal expensiveness 63:57 okay so bargain and too expensive where 64:00 those lines intersect 64:07 so it’s basically the same as the point 64:13 of marginal cheapness just flipped on 64:16 its head you know it means any higher of 64:18 a price you 64:21 you know you just gonna see too big of a 64:24 drop-off in in demand to to really help 64:32 your sales okay if it gets any more 64:35 expensive demands probably gonna fall 64:37 off and there just aren’t enough people 64:39 that feel that this is you know beyond 64:45 this point and there aren’t a big 64:48 percentage of people they’re gonna feel 64:49 that you know that either this is 64:56 a bargain or even getting expensive you 65:00 know beyond this point a lot of people 65:02 are gonna start to think it’s too 65:03 expensive too many people okay so you 65:08 know you you do that you fill this 65:11 information out you know the 65:13 intersections are over here on the table 65:15 you can see the prices but for 65:17 everything I entered up here here’s our 65:19 point of marginal cheapness eighty four 65:22 ninety nine any less than that so many 65:24 people are gonna think that it’s junk 65:26 and it won’t buy it the demand will be 65:29 there you know we got our optimum price 65:31 point ninety three thirty two and down 65:36 here we’re same percentage of people or 65:39 if the question quality and think it’s 65:41 too expensive that’s where the extremes 65:43 are minimized okay we got our 65:45 indifference price point here where our 65:48 moderate our purchasers are maximized 65:50 percentage-wise 65:51 that’s a $115 and then we got our point 65:56 of marginal expensiveness beyond this 65:57 too many people are going to think it’s 65:59 too expensive the demand won’t be there 66:03 so yeah like I said they and their 66:08 sections are over here and we’ll go over 66:10 how to use the table here next 66:14 almost done two more slides hang in 66:17 there I’m trying to hang in there myself 66:19 been going on an hour in six minutes 66:21 ended up my videos always go longer than 66:26 I anticipated but you know it’s a labor 66:29 of love 66:30 sure selling a labor of monetary reward 66:34 but nem okay how do you use the price 66:38 sensitivity meter well if you can 66:41 conduct an actual survey of customers or 66:43 get your hands on that information 66:44 otherwise and great use it okay 66:49 if you can’t do that 66:53 indefinitely research it further if 66:55 that’s the path you’re gonna take cuz 66:57 you want to understand the wording of 66:58 the questions there’s ill you know it’s 67:00 kind of an art unto itself okay 67:03 obviously I’m using a hypothetical 67:05 example here and just speculated but um 67:10 you know if you don’t if you don’t think 67:12 you can practically conduct the survey 67:14 or get this information from potential 67:15 customers then you have to speculate so 67:19 first thing you do is enter the average 67:21 or medium price you know take them 67:24 whatever the first price that comes to 67:26 mind 67:27 okay this doesn’t have to be exact and 67:29 enter it right here in h2 okay so from 67:31 there it’s going to calculate down to 67:34 zero and it’s gonna calculate up give 67:37 you a range of prices up to double the 67:39 price okay that’ll happen automatically 67:45 again I’ll make the point if you’ve ever 67:48 used any of my other tools you know the 67:50 white cells okay that’s where you put 67:53 information in shaded cells have 67:55 formulas okay so don’t type over them 67:57 type in the white cells and excuse me 68:01 you’ll be good to go 68:05 okay so for each question and are the 68:07 percentage of customers who would or you 68:09 think would agree so at zero well it’s a 68:16 hundred and a hundred okay so we’re 68:18 going to say 68:21 everybody would question the quality at 68:24 zero and by default everybody would 68:28 think it’s a quote unquote bargain there 68:31 and you know this just has to do with 68:34 if you enter zero here well first of all 68:38 it’ll give you an error okay because it 68:40 kind of violates the rules it’s 68:44 less people are always gonna question 68:46 the quality then think it’s a bargain 68:47 okay less people are always gonna think 68:51 it’s too expensive and think it’s 68:53 getting expensive okay so me describing 68:57 it I might not do it justice 69:01 if you tinker around with this a little 69:02 bit I think it’ll it’ll become intuitive 69:05 you know it just takes a little getting 69:06 used to and it’s you know in essence you 69:09 want your lines like this so like I said 69:11 this question quality is the blue line 69:13 here is always less than the red line 69:16 alright because you know this is worse 69:22 than bargain 69:24 okay so fewer people are gonna think 69:26 that conversely too expensive it’s 69:30 always gonna be fewer people and think 69:32 it’s getting expensive okay and you see 69:35 the lines sloped down this way for the 69:37 bottom to slope down this way for the 69:39 top so again there’s logic worked into 69:42 the table here where you can’t go from 69:44 oh well ninety percent people question 69:47 quality at twenty but ninety five are 69:49 gonna question it at forty well that 69:51 wouldn’t make sense okay why would more 69:53 people question the quality of forty 69:55 dollars than would at twenty twenty is 69:57 less than forty so if you try to do that 70:01 that it’ll say no no violates the rules 70:06 try again and that’s just to keep you 70:08 from entering information that you know 70:14 would basically render the tool useless 70:16 so I put that in there for your own good 70:18 you know and particularly as you’re kind 70:20 of like getting used to it tinkering 70:22 with it 70:25 you know it it just helps got as kind of 70:29 a check they’re just like hey you know 70:31 that’s not what you want to do and like 70:32 I said you’ll get used to it and you’ll 70:33 you’ll understand become a little more 70:35 intuitive to you that at first glance it 70:38 if you’re just watching this video it 70:39 might not be but again I would encourage 70:40 you to download it try it a little bit 70:43 and read up on it some more you know 70:45 they there might be a damn good 70:49 possibility someone else explains it 70:50 better than I do okay so talk a little 70:54 bit about the the logic here question 70:57 quality and bargain must be equal or 71:01 decrease as the price increases okay 71:04 price goes up fewer people are gonna 71:07 think it’s a bargain fewer people are 71:08 gonna question the quality you know 71:11 question quality it means that it’s so 71:14 low something must be wrong with it 71:16 why are they trying to give this away 71:20 okay conversely getting expensive and 71:24 too expensive must be equal as the price 71:27 increases or increase okay as the price 71:32 increases more people are gonna think 71:33 it’s too expensive more people are gonna 71:35 think it’s getting expensive all right 71:37 it’s pretty straightforward okay so the 71:40 percentage that question quality must be 71:42 equal to or lower like I said earlier 71:44 than think it’s a bargain 71:45 if you were you know this is a worse 71:52 description okay you know so there’s 71:57 always gonna be fewer people that think 72:00 that or there has to be in terms of this 72:04 within the context of this tool you know 72:08 anything’s possible but you know like I 72:11 said this is just kind of the logic that 72:12 you have to use to be able to get get 72:14 anything from this tool because if you 72:15 throw this logic out the window then the 72:17 tool is useless and you know so 72:23 and I touched on earlier so the 72:24 percentage that feel it’s too expensive 72:25 must also be equal to or lower than the 72:27 percentage to feel it’s getting 72:28 expensive fewer people are going to 72:30 think it’s too expensive I think it’s 72:32 just starting to get expensive game 72:35 trechie present prevents this logic can 72:38 be violated your 72:44 losing point of marginal cheapness 72:45 optimum price point indifference price 72:47 point and point of marginal 72:48 expensiveness are automatically 72:50 calculated and the graph is 72:51 automatically updated so for example 72:56 like if we take this and say this the 73:01 question quality it was 15 10 5 73:08 you see a little bit see the graph 73:11 change down here and then with some of 73:14 those first edits he saw the price the 73:18 point of marginal cheap cheapness change 73:20 see it jumps okay because it changes all 73:26 right so it’s the same as you you know 73:28 particularly as you get to update and 73:29 these values in the middle that’s where 73:30 you gonna see these changes in the 73:32 prices but you’ll see the graph a bit II 73:36 no matter where what changes you make 73:39 some ok and went on our fifteen seventy 73:45 five minutes yeah 73:46 it’s a long one I’m done you know I did 73:51 included this slide in with mostly with 73:54 my quickbooks online videos and it 73:59 doesn’t directly apply here but i 74:00 slipped it in anyways and you know 74:02 depending on where you’re at with your 74:03 bookkeeping if you DIY in it and you 74:08 hate it and you know you want to work 74:13 more on your business than work in your 74:14 business and do less data entry because 74:17 you think that’s boring and you’re right 74:19 then check out bot keeper you know they 74:23 use AI to automate your bookkeeping 74:25 tasks they can do it in quickbooks 74:27 online and like i say gives you the 74:29 opportunity help your business grow it 74:32 spend less time on menial tasks and 74:35 there will be a link down in the 74:37 description for that 74:41 okay that’s all I got man if you stuck 74:45 with me thank you hope you found some 74:48 value there some things to think about 74:50 and like I said pricing is a complicated 74:53 manner but when we’re spending time on 74:57 check out the tool try it again I you 75:00 know don’t let spreadsheets scare you I 75:02 try to make my spreadsheets as 75:04 simplistic as possible and give you the 75:07 documentation you need to use them and 75:10 get value from them because that’s what 75:11 they’re there for 75:12 you know so any you know the old and 75:17 it’s an old saying I’ve only seen it 75:19 said once and I thought it was great 75:20 though they said you know better to make 75:23 mistakes in a spreadsheet then in real 75:26 life you know when I’m not doing the 75:28 quote justice but something like that 75:30 but I am I’ll leave you all with that 75:33 thanks for watching 75:35 take care
Pricing strategy example
As has been customary for my business plan posts, I’ll be trying to apply what write about (or record, in this case).
I’ve been using a startup that seeks to manufacture an all-natural topical hair regrowth treatment for my examples thus far. Though the previous post on market saturation called the viability of that idea into question – I’ll continue to use it for consistency’s sake.
As far as pricing strategies go, I knew I wanted to use psychological pricing – because why not? If it convinces a few more people to buy than would have otherwise, it’s worth it.
Also, due to the nature of the product (vanity) I always figured that premium pricing would be appropriate. Not excessive, but I knew I wanted to price on the high end. Again, I can always run promotions.
I also wanted to be mindful of value. This is, admittedly, not a miracle product. It’s just a supplement. If it cured all hair loss, I could charge just about any price for it. But, it doesn’t. So, I need to be mindful of just how much value I’m providing.
With those strategies in mind, I went to Amazon and searched for competing products. I did this for both men and women because I thought it would be smart to price those customer segments differently. I could make slight tweaks to the formula to justify the difference in pricing.
I thought that a women’s hair regrowth product would be priced higher. The reason I thought this was because of the (surprising) preponderance of women concerned about hair loss. I was wrong, however. Women’s hair regrowth products tended to be priced lower than men’s.
After getting a feel for the pricing for each segment, I plugged my assumptions into the Price Sensitivity Meter.
This post was created to provide one of the most thorough resources available on the internet in terms of SWOT analysis templates. Additionally, ideas for completing your small businesses SWOT analysis are also included.
A SWOT analysis helps you to understand the environment your small business operates in. Understanding your environment will help you to capitalize on your strengths, shore up your weaknesses, capitalize on opportunities, and neutralize threats.
In total, there are 15 templates available for download. Each one with a different design and representing a different type of small business.
The businesses are:
Yoga studio
Healthcare
Restaurant
Retail
Financial Advisor
Web Design
Auto Repair
Life Coach
Pet Services
Real Estate
Cleaning Service
Bed & Breakfast
Bookkeeper
Construction
Consulting
These templates come in a variety of formats including Google Sheets (Excel), Google Docs (Word), and Google Slides (PowerPoint).
Download the SWOT analysis templates
Complete the form below and click Submit. Upon email confirmation, the workbook will open in a new tab.
Filling out the form above will open a spreadsheet with the Google Sheets (Excel) templates.
On the Slides & Docs SWOT worksheet, you will see links to the Google Slides (PowerPoint) and Google Docs (Word) templates. Hover over the template you want to see and click the link that appears to the upper-left.
Sheets (Excel) SWOT analysis templates
The spreadsheet templates are good if you need flexibility in terms of size. Columns and rows can be adjusted as needed. If you need to incorporate any sort of math, spreadsheets will work well. Also, generally, spreadsheet templates are easier to customize than presentations or documents.
On the flip side, spreadsheets aren’t ideal for distribution to outside parties. The presentation or document templates would serve you better for that.
Ranked SWOT for a yoga studio
This SWOT analysis template is a relatively simple 2×2 layout. It gives you the ability to assign a numbered ranking to each Strength, Weakness, Opportunity, and Threat. This ranking gives you the ability to quantify elements of your internal and external environment in order to better focus on what matters most.
Ten rows are provided for each factor. More rows can be inserted if needed.
Competition SWOT for a healthcare company
Click to enlarge
This elaborate spreadsheet template doesn’t just look at your company – it looks at your competitors too. Doing so allows you to measure yourself up against the competition.
At the top, the Company Information section is where you’ll enter the Name of your company and your competitors. If you like, you can also enter a Location, Website, Revenue, Employees, and other Notes for each business.
The Company Names you enter will be carried down to the Strengths and Weaknesses sections. Since, in theory, you and your competitors share the same External Environment, Opportunities and Threats are not broken out by company.
This is a great template for companies in competitive industries. It forces you to look beyond your own environment in order to determine a strategy for gaining market share.
Flow chart SWOT for a restaurant
Click to enlarge
This spreadsheet template incorporates some simple graphical elements. Through the use of arrows, the reader’s eye is led through each of the factors.
The expanded cells allow for longer bullet points to be entered if needed. Plus, the horizontal format might provide better readability. If you are planning on distributing a spreadsheet template to outside parties, this would be the one to use.
SWOT interaction for retail
Click to enlarge
This is one of the more in-depth templates.
As recommended in my Church SWOT Analysis post, you should think about how the different factors interact with each other. For instance, how can Strengths be used to neutralize Weaknesses? How are Weaknesses preventing you from capitalizing on Opportunities? And so on…
This template allows you to document the relationships between the Internal and External Environmental factors. Doing so will (hopefully) help you to come up with goals to use during your strategy formulation stage.
With all of the information contained in this template, bullet points can’t be too long. However, rows can be inserted, if needed.
Google Slides (PowerPoint) SWOT analysis templates
Complete the form above to access these templates.
Presentation templates are good for…presentations, of course. They are designed more for form than function. Graphical elements that might not be practical in spreadsheets can be incorporated into presentations.
Presentations also aren’t as easy to customize as spreadsheets. Elements can get out of alignment and harm the effectiveness of the visuals. So, I would recommend only changing the text unless you know what you’re doing. Be sure to use Ctrl+Z if you make any mistakes!
If you want to use one of these templates, you can copy the slide and paste it in your presentation.
Simple SWOT for a financial advisor
Click to enlarge
This clean layout is straightforward and simple. It uses a lot of whitespace and nothing extraneous. Just the “facts,” with plenty of room to type bullet points. This makes it easy to read and understand.
Cylinder SWOT for a web design company
Click to enlarge
Here, a few graphical elements are added for visual interest. Strengths, Weaknesses, Opportunities, and Threats are each listed on a separate cylinder.
Additionally, as is done with most of the templates, Internal factors and External factors are colored slightly different for distinction. The use of the cylinders doesn’t allow for as many bullet points as with the simpler templates. This is a good option for those who believe in minimizing words on slides.
Graphical SWOT for an auto repair business
Click to enlarge
Here’s another unique graphical template. Similar to the previous cylinder template. It uses the typical 2×2 format, but with thought bubbles (or clouds…) for each factor.
I think it’s a little more visually engaging than the cylinder template. However, it also has limited room for bullet points. So, it is a good choice for those who would rather elaborate verbally.
Pie chart SWOT for a life coach business
Click to enlarge
This presentation template takes a step back to a simpler design.
It is made to look kind of like a pie chart. A pie chart with all the pieces the same size. This implies that each factor is of equal importance.
Lots of whitespace here. Good for someone who wants the focus to be on the information presented. That much whitespace means not much room for bullet points though. So, if you use this template, you had better keep them succinct.
Puzzle piece SWOT for pet services businesses
Click to enlarge
Determining how are your Strengths, Weaknesses, Opportunities, and Threats fit together can be a bit of a puzzle. This notion is represented by the graphic on the left of the slide.
Though graphics are used, the areas where the factors are listed is very clean and simple. There is room for six to eight bullet points for each factor. This presentation template is a good choice for someone who likes to incorporate just a little bit of design in their presentations.
Icon SWOT for a real estate company.
Click to enlarge
Here the typical 2 x 2 format is abandoned for a horizontal theme.
Additionally, the use of imagery is relied upon. Each factor has it’s own relevant icon to help reiterate what is being examined in this SWOT analysis.
This is a good template for factors that require a long explanation. In fact, entire sentences can be written for each bullet point. If you’re long-winded (like me) and don’t mind some graphics, this is a good template for you to use.
Columns SWOT for a cleaning service
Click to enlarge
Contrasting with the previous template, this one is a vertical design.
Here, you will want each bullet to be short and sweet. This is a good choice for presentations that went to grab attention to the fact that this is a SWOT analysis. A fact that will be tough to ignore with the acronym spelled out across the top.
It’s also a simple format that has a unique look. Most other templates don’t utilize a vertical format.
SWOT analysis templates for Google Docs (Word)
Complete the form above to access these templates.
Document templates can be used internally or externally. They have some of the pizzaz of presentation templates but without as big of a risk of ruining the formatting.
They also might make a good alternative if users are nervous about spreadsheets (yes, those people exist!). Almost everybody who is comfortable with a computer is comfortable with a document.
If you want to use one of these templates, simply copy the text and paste it into your Doc. If you’re using Word, you should be able to do the same thing without downloading.
Simple SWOT for a bed-and-breakfast
Almost identical to the simple presentation template.
This is the old reliable 2×2 design. A little bit of color is added to help it grab attention. There’s an average amount of room for each bullet point, but you should have enough room to list as many as you need.
Simple and straightforward. No frills.
Strategic planning SWOT for a bookkeeper
This SWOT analysis template has more than just the typical factors (Strengths, Weaknesses, Opportunities, and Threats). It allows you to list your objectives beforehand. This makes it clear what you hope to accomplish by undertaking this analysis. This will help you, and others, stick to the task at hand better.
Also, at the bottom, you can write a brief summary of the impact on your strategy formulation as a result of this analysis.
This document template is a good option if you’re planning on seeking input electronically.
Summary SWOT for a construction company
This document template has a typical 2×2 matrix. But, it has an additional section at the bottom where you can write a summary of what you learned.
It is similar to the Strategic Planning SWOT, but without the objective section. Also, rather than astrategy, you’ll include a summary at the bottom. 2-3 sentences that capture the essence of the whole analysis.
This template doesn’t have a ton of room for a lot of bullet points, but there is room for medium sentence length. It is perfect for communicating the most important points from the SWOT analysis.
Guidance SWOT for a consulting company
At first glance, this might seem like yet another simple 2×2 matrix. But, what this document template has that the others don’t, is guidance questions. Questions that help put your mind on the correct path for determining your Strengths, Weaknesses, Opportunities, and Threats.
If this document template is to be shared between others in your organization, then you might find it helpful to have the guidance. It’s also helpful if this is your first SWOT and you have no idea where to start.
This guidance, obviously, takes up some of the room for bullet points. So, if you don’t feel you can keep them short and sweet, you might choose a different template.
What is a SWOT analysis?
A SWOT analysis is a thought exercise for understanding the internal and external environment that your business operates in. It is sometimes known as “situational analysis.” Its purpose is to help in strategic planning. Specifically in conjunction with your mission statement in order to set goals and formulate a strategy for the coming year.
SWOT analysis has four main sections. These are, of course, strengths weaknesses, opportunities, and threats.
Strengths and weaknesses represent your internal environment. These are factors that are within your company’s control. Factors that you can do something about. That’s important to remember as you formulate a strategy based on these factors.
Opportunities and threats are factors outside of your control. Opportunities are good of course, and threats bad. These two factors represent your external environment. Since they’re outside of your control, these are the factors (opportunities) that you want to leverage and factors (weaknesses) that you want to hedge against.
Strengths are the things that your business does well. The things that your competitors and customers would say you do well. Things that you know you do well. This is no time to be humble. If you do it well, if you’re proud of it, then list it as a strength.
Weakness is the opposite of strength. Again, think about what others might say are your shortcomings. Just as you shouldn’t be humble with strengths, you shouldn’t be prideful with weaknesses. If you’re like me, you’re your own worst critic. That’s fine. At least for this exercise. List everything that really holds you back.
Opportunities are the things happening outside your walls that can benefit you. The genesis of opportunities is limitless. They can come from anywhere. So don’t be close-minded. If I can benefit you – list it.
Threats, of course, are the opposite of opportunities. But, they are also outside of your control. Much like the coronavirus pandemic we’re going through as I write this, there ain’t much I can do about it. All I can do is figure out how I want to respond to it. Don’t turn a blind eye to threats. Take control of what you can.
What’s the purpose of a SWOT analysis?
A SWOT analysis is a key component of strategic planning. In order to formulate a plan that has a chance of success, you need to understand the environment you operate in.
Think about a sports team. As a coach/leader, you need to understand what your own players can and can not do. This is your internal environment.
But you also need to understand what the other team is capable of. How they can hurt you, and what their shortcomings are, etc. This is your external environment.
With all of this knowledge, you can put together a game plan that gives you the best chance of winning possible.
The formulated strategy doesn’t have to be rigid. Just as you would in an athletic contest, you have to be willing to adapt. Your ability to adapt will be enhanced by an understanding of your internal and external environment.
How to use a SWOT analysis
Like most elements of strategic planning, SWOT analysis gets a lot of its value through the simple act of doing it. Taking the time to dedicate just a little bit of thought to these matters goes a long way.
Beyond that, the first thing you want to do is download the templates above.
Then, you want to start brainstorming strengths, weaknesses, opportunities, and threats. Set a timer if you need to and just start jotting down everything that comes to mind. There are no wrong answers. You don’t need to keep everything you write down. The point is to get in the right mindset and get some momentum in regards to the internal and external factors that affect your business.
Next, you might want to do a little research on some of the bullet points you brainstormed. Whether it be internally – by examining your own reports and financial statements. Or, externally via the internet. The point here is to find information that either backs up or negates what you brainstormed.
Now with a big old brainstormed list, you can start narrowing things down. On this site, I often reference the Pareto principle. The Pareto principle states that 80% of the results are usually attributable to 20% of the variables. Keep this in mind and focus on the most impactful strengths, weaknesses, opportunities, and threats.
Finally, though not every template allows for it, you want to think about how these factors interact. What do I mean by that? What I mean is – how your strengths affect your weaknesses, weaknesses affect your opportunities, opportunities affect your threats, and so on…
Set the foundation for sound strategic planning by using these SWOT analysis templates
Download (and use!) the SWOT analysis template that’s right for you from above. Beyond that, read this post on Church SWOT Analysis. Though you probably run a for-profit business, the principles will still apply. This information will help you perform a SWOT analysis that contributes to a sound strategic plan.
Also, check out the related posts below. SpreadsheetsForBusiness.com was created to help small business owners, like you, to get control of their businesses and succeed.
Customer profitability is measured by subtracting allocated costs from customer revenue.
The trick is to logically allocate costs – specifically Selling, General, and Administrative expenses. Understanding your customer profitability will help you make better decisions. For instance, what new customers to target and which of your current customers to part ways with. Having more good (and less not-so-good) customers will make your life as a small business owner more enjoyable.
Download a copy of the Customer Profitability workbook
Complete the form below and click Submit. Upon email confirmation, the workbook will open in a new tab.
Why is it important to analyze customer profitability?
You’re probably wondering if some of your small business’ customers are unprofitable.
In the back of your mind, you know that some customers are better than others. Some customers are a huge headache and don’t bring in that much revenue. Others are a pleasure to do business with and drive the majority of your revenue.
It’s more than just revenue
Sure, you have an inkling of which customers are good and which are… not-so-good. But until you run the numbers, you’ll never know.
What you find might surprise you. Maybe the customer who’s a huge headache is worth it? Or, maybe the customer who seems ideal is actually unprofitable?
Revenue is the starting point. But customer profitability has as much to do with costs as it does revenue.
Build a better business with a customer profitability analysis
By understanding which of your customers are the most profitable, you can make better decisions in the future.
You will have a measurement to decide if you need to dedicate more time and resources to certain customers. Or, if you need to fire them.
Your “ideal customer” will become clearer. This will allow you to focus your marketing toward other “ideal customers.”
Also, by getting rid of not-so-good customers, you’ll likely save a huge emotional toll on yourself and your employees. Work will become more pleasurable. Which, in turn, can only help you achieve your vision for your small business.
How does a business measure customer profitability?
You know that profit = revenue – expenses. So, customer profit must equal customer revenue – customer expenses.
Customer revenue is easy enough. Your accounting software should be able to provide you with a report that tells you what you sold to who. If not, that’s Job #1 – to piece together this information or start measuring it going forward. You can’t measure customer profitability without it.
If you’re following along in the Customer Profitability workbook, you can enter customer names in row 5 of the Customer Profitability worksheet. Additionally, enter Customer revenue in row 7.
Also, for the sake of consistency, I would advise you to enter a Start and FinishTime period. This goes in cells C3 & D3 respectively. These dates won’t affect any formulas. They will, however, help ensure that your revenue and costs are compared consistently.
Costs of Goods Sold/Cost of Sales
Cost of goods sold (COGS), also known as Cost of sales (COS), are the costs your business (more or less) directly incurred to deliver that product/service to the customer.
Again, your accounting software probably captures this for you in a report somewhere.
QuickBooks Online captures this information in a report called Profit and Loss by Customer. It can be found by navigating to Reports (left menu) > Standard (tab) > Business overview (section).
Here’s what that report looks like when downloaded into a spreadsheet:
Credit: qbo.intuit.com Click to enlarge
Based on how you set up your customers and products/services in QBO, your COGS will automatically be recorded in this report. That’s a big chunk of costs right there! Customer Gross Profit is taken care of.
What if you don’t have a report that totals customer revenue and COGS?
You can estimate these totals with the Customer Rev/COGS (Optional) worksheet. It will just take a little more legwork.
First, list all your Products/Services in column B. Then for each Product/Service list the average Price you sell it for. Also, the average Cost.
Again, I’ll try not to get too technical. “Cost” in this case, includes material, labor, and overhead. The total costs incurred to produce one Product/Service. If you’re unsure whether to include a particular expense, leave it off. It can always be allocated on the Customer SGA Allocation worksheet.
After you’ve listed Products/Services, Price, and Cost, then you’ll want to enter the QUANTITY PURCHASED by each customer.
At the bottom, you’ll see Revenue and COGS by customer summed. These amounts can then be entered on the Customer Profitability Worksheet. They won’t carry over automatically because this worksheet is optional.
With Customer revenue and Customer cost of goods sold entered, Customer gross profit and gross margin will be calculated. Your Customer Profitability worksheet should look something like this:
Click to enlarge
The shading of the Customer gross margin cells will change slightly to highlight those customers with the highest gross margins.
What about Selling, General, and Administrative expenses?
Everything up until this point has been fairly intuitive. This is where the good customers get separated from the not-so-good, though.
Selling, General, and Administrative (SGA) are those expenses that are not directly tied to any individual Product/Service. This is why you don’t see these expenses included in the QBO Profit and Loss by Customer report.
But, these expenses are very real. They are (or, at least, should be) necessary to serve your customers. So, they should be accounted for any time you speak of “profitability.”
How do you allocate these expenses to individual customers though?
You can think of each type of Expense as a pie. It’s up to you to decide on the most appropriate way to slice that pie for each customer. There are no wrong ways to slice that pie. Some are just better than others.
Start by listing Expenses in column B on the Customer SGA Allocation worksheet. Break them down into as much detail as you’re comfortable with.
For each Expense, enter an Amount to be Allocated in column C. Remember to stick to the Time period specified on the Customer Profitability Worksheet. You don’t want to allocate too much or too little.
Drivers – slicing the pie
Now, comes the creative part…
Think about what drives that Expense. Specifically, what the customer does that makes that Expense increase.
For example, Automobile expenses could be allocated by the number of miles driven for a client. Meals and Entertainment could be allocated by the number of meetings and events you took part in with the client.
Again, there are no wrong answers here because there are (usually) no perfect ways to slice the pie. Use your best judgment. If you completely draw a blank, you can always allocate that Expense evenly across all customers.
Try not to do that if at all possible, though. It’s the allocation of these costs that really separates the profitable customers from the unprofitable ones.
Back to the Customer SGA Allocation worksheet.
Enter the method of allocation in column D. Then, for each customer, break the Amount to be Allocated down in that manner. The Total of that breakdown (column O) needs to equal the Amount to be Allocated.
If all of the Totals don’t match, you’ll see an error message in cell P25.
Customer SGA expenses are totaled at the bottom and carried over to the Customer Profitability Worksheet.
Your completed Customer SGA Allocation worksheet should look something like this when you’re done:
Click to enlarge
The final product
If you look back at the Customer Profitability Worksheet, you’ll see that Customer SGA expenses are subtracted from Customer gross profit to give you Customer operating profit. Aside from taxes, this is essentially your bottom line for customer profitability.
Customer operating margin is also displayed. Again, the shading in these cells will change to highlight those customers with the highest operating margin.
A chart, comparing your customers is also included to help with understanding.
Your final product should look something like this:
Click to enlarge
How to improve
Good news! The first step to improving customer profitability is to understand it. After using this workbook, you should have a better understanding of customer profitability.
Next, look for common themes among your best (most profitable) customers. Is there anything they have in common?
How did you acquire these customers? Can you replicate it?
Can you do more business with these customers? You don’t want to grind on your best customers too hard. But, are there any more of their problems you can fix with your solutions?
Don’t just look at your customers either. Look into the mirror a little bit too. Is your company making some customers not-so-good? This might not be comfortable. But, some introspection could help you convert some of those not-so-good customers to the light side.
If some of the not-so-good customers are hopeless though, you might have to fire them. This can be a delicate situation. However, sinking money into customers that you don’t even enjoy dealing with is destructive. Do your homework on the best way to do so and let them be someone else’s problem.
Sorting through demographic information is one of the first steps in doing market research and competitive analysis. This is stuff you’ll need to know in order to prepare an effective business plan. Without this information, you, as a founder, don’t know if there is a sufficient market to support your business. You will also be starting off at a disadvantage when planning other aspects of your business.
**Note: this business plan demographics guide was written just before the Census Bureau changed its primary portal for data from the American FactFinder to Data.Census.Gov.
Download a free copy of the workbook used in this post
Complete the form below and click Submit. Upon email confirmation, the workbook will open in a new tab.
Keep in mind that this workbook is only designed to work with table S0201, Selected Population Profile in the United States. Any other table might not be in the correct format.
About these posts
This series of posts was written to convey my take on how to write a business plan. My intent is to follow up with several more posts after this one.
I’m using the U.S. Small Business Administration (SBA) Plan your business guide as my outline (link). In true SpreadsheetsForBusiness.com fashion – I plan to include free downloadable spreadsheets where appropriate.
Rather than just recycling the same information you could find elsewhere, I’m going to take this journey with you. I’ll be building my own business plan as I write these posts. This is my first business plan, so you’ll be learning right along with me.
My business plan
My plan is based around a hypothetical business that will manufacture and market a hair regrowth product for men (and women, I suppose). The plan is to manufacture the product with all-natural ingredients.
What are business plan demographics?
Sorting through demographic data for your business’ potential customers is the first step in understanding what type of person (or business) might be interested in your product or service.
It can provide an unofficial ceiling to the number of customers you might expect. It’s from this information you can get into more detail about demand, market saturation, pricing, and so on.
Common demographic information includes:
Gender
Age
Race
Income
Education
Marital status
Employment status
Geographic area
Why worry about business plan demographics?
Focusing on marketing to specific individuals helps you plan with clarity. The saying goes: “you can’t please all the people all the time.” By not trying to market to everyone a little bit, you can focus your efforts on creating a really good experience for some people.
Whatever your business is, it probably is a reflection of yourself. Your interests and talents, that is. Who you market to will also depend on your characteristics and preferences. So, as you choose the demographics of your avatar, consider who you identify with and would be comfortable marketing to.
How to find and analyze business plan demographics
The market for a product or service is quantified by the number of people who make it up and the total amount of money they spend. We can quantify the size of the market by segmenting people based on their demographic characteristics
Of course, since most of this information is numerical, I’ll be using a spreadsheet to keep track of what I found and what changes in variables mean for the market of my aspiring business.
Also, I’ll be using online resources for the sake of time and simplicity. Theoretically, market research could involve things like focus groups and surveys. That’s more involved than I want to get for this idea, so, I’ll stick with the free information.
The SBA has a nice list of resources for market and competitive analysis here.
Demographic information
Here, we’re just looking for basic information about the people who I might be selling to. For instance, how many people are in the age range that I would market to? How much money do they make? Are they single and looking to mingle? Or, are they in committed relationships and proud of their bald head (like a certain “old man” I used to know and miss very much)?
Here, you can find Census data about your state, city, or even zip code. Not every business is going to be nationwide. Some, like a restaurant, will be very local.
Also, if your business will market to other businesses (B2B), then the information contained here may or may not be pertinent to you. Try another part of the Census website called the Small Business Edition (link) if you’re not finding what you need.
Since, as of now, I envision my business being nationwide (at the very least regional), I chose to use the “Guided Search.” From there, in the “Topics” section, I chose to look at information pertaining to age, sex, age group, income/earnings (households), and marital status.
I can always delve into more detail or retrieve different information at a later time. My hope is that this gets me started.
Click to enlarge. Credit: factfinder.census.gov
Additionally, on the next screen, I chose to break the information down by region. I included all regions so that I could total them for a view of the entire country.
Finally, on the last screen, I opted to see the one table that outlined this information in 2017, the latest year available.
Don’t bother with the “Download” Action. It will give you your data in a different format than it is displayed.
Click to enlarge
Instead, just highlight everything in the FactFinder table and copy + paste it in a spreadsheet.
Click to enlarge Credit: factfinder.census.gov
Fixing errors
From there, do a Find and replace in your spreadsheet to get rid of the errors that are a result of a “=” being placed in front of the “+/-.01” in the Margin of error column. Replace the “=” with an apostrophe. Be sure to Also search within formulas.
Filtering for the demographic information I need
My goal here is to get a range of the number of potential customers based on a set of demographic statistics. I have a lot more information than I need, so let’s see if we can widdle this down into something more useable.
To do this, I added some columns to the Demographic Info worksheet.
First of all, I added a column (Estimate #) that aimed to translate some of the percentage population information into quantities. The format of every download from FactFinder isn’t going to be the same. But, an attempt was made to give you access to both percentage and quantity information for each line item.
Additionally, you’ll find a column named Enter 1-10 to rank demographics. Here, you’ll be able to rank demographic information and narrow down your market on the Pick Demographics worksheet.
Maybe you have a couple of different mixes of demographics in mind. That’s fine. Once you are satisfied with one mix of demographics you can highlight the information on the Pick Demographics worksheet, then copy and paste the values (Ctrl + Shift +V) into one of the boxes on the Customer Avatars worksheet.
This allows you to keep tabs on several different customer profiles as you move forward with your business plan.
Keep in mind, this is just the first step of the business plan. The whole point of a plan such as this is to be proactive. In order to be proactive, you’re going to have to be flexible.
If, as you move along through the steps, you reconsider your target demographic – that’s fine. Just circle back and refine your avatars and make adjustments to other parts of the plan as necessary. Don’t get discouraged if you have to do this. That isthe whole point of this exercise.
My avatars
For my avatars, I created four, relatively similar mixes of demographic characteristics.
Gender and income
All include males. Though females can also suffer from hair loss, I am assuming that males would be the primary customer and who the majority of marketing would be geared toward.
Next, every mix of demographics included individuals with earnings as opposed to those with retirement income, with Social Security income, or any other type of public assistance.
Right now, I anticipate that this product would be sold at a premium price due to its uniqueness and all-natural ingredients. This would mean that customers would likely need to earn above-median incomes in order to be in a position to buy a product such as this. Assumptions such as this might change as I progress through this business plan.
In three out of my four avatars, I made assumptions about the relationship status of these men. The demographics included were Now married, except separated, Never married, and Separated. These were my three main avatars.
Education
The fourth included Males, With earnings, and who were High school graduates. This is my “catch-all” avatar. The real total addressable market for my product is probably between this population and the total of the three mentioned above.
The main difference between the three main avatars had to do with education. I assumed that men who were single might be more likely than married men to purchase a product such as this, I lowered the EDUCATION ATTAINMENT to Some college or associate’s degree.
Defining a target market with business plan demographics
Be sure to download your own copy of the workbook used in this post. Just fill out the form at the top.
What other sources would you use to find demographic information for your business plan?
How about the avatars? How would you have screened them further?
Businesses use operating leverage to keep costs fixed when they expect extraordinary sales volume. Keeping costs fixed means that businesses can carry more of that revenue to net profit.
The degree of operating leverage is a formula used to calculate how much operating leverage a business is employing. This formula tells you what will happen to operating profit when revenue increases or decreases.
The degree of operating leverage can be calculated two ways.
The first calculation looks at past costs:
Degree operating leverage = % change in Operating profit (EBIT) ÷ % change in Sales
If you don’t know your cost mix (variable vs fixed) then you don’t know how it’s affecting your small business. You don’t know if it would be advantageous to change the mix. And, if you did, what would happen. You don’t have a complete picture of your business and, therefore, aren’t making fully informed decisions.
Download the operating leverage workbook
Complete the form below and click Submit. Upon email confirmation, the workbook will open in a new tab.
Degree of operating leverage and fixed costs
Operating leverage is the use of Fixed costs in order to amplify changes in Operating profit due to a change in sales.
Fixed costs might be considered risky because they do not change no matter how much you produce. But, they also don’t rise if you produce (and sell) more. The risk and reward go hand-in-hand.
The degree of operating leverage is a ratio that tells you how much your Operating profit will change due to a change in Sales.
For instance, if your degree of operating leverage is 5.0, then a 10% increase in Sales will translate into a 50% (5.0 × 10%) increase in Operating profit – all other things being equal.
Conversely, a 10% decrease in Sales will translate into a 50% decrease in Operating profit. The pendulum swings both ways.
Which formula should you use to calculate degree of operating leverage?
You can determine your small business’s degree of operating leverage through a couple of easy calculations. Or, you can just plug your numbers into the free workbook!
Some suggest calculating the degree of operating leverage as follows:
% change in Operating profit (EBIT) ÷ % change in Sales (Source)
For instance, comparing this year to last year, let’s say your Sales increased 10% and your Operating profit increased by 29%.
29% ÷ 10% = 2.9. That was your degree of operating leveragelast year. This formula doesn’t tell you what it is now.
In order to calculate your degree of operating leverageright now, use the following formula:
Total contribution margin ÷ Operating profit (EBIT)
If you’re not familiar, Total contribution margin = Sales – Total variable costs. Not just manufacturing variable costs (Variable COGS), but SG&A variable costs too.
Degree of operating leverage and profit
Your degree of operating leverage can give you insight into the risks you run from your cost structure (mix of fixed and variable). It tells you how susceptible your Operating profit is to changes in demand.
It will also allow you to know how much you need in Sales to breakeven. The higher your Fixed costs, the higher that breakeven point will be.
Beyond that, it tells you if your Fixed costs are in line with your ability to generate Sales. If that ability is high, then your company can benefit from the leverage provided by Fixed costs and can earn excess returns.
Conversely, if those Fixed costs are locked into assets that won’t contribute meaningfully to Sales, then they are going to be a drag on Operating profit. You’re always going to be fighting against them.
Financial and operating leverage are similar in that they employ the use of fixed costs in order to (hopefully) amplify the effects of sales on net profit and operating profit respectively.
Here are a few of my thoughts on the subject:
Since financial leverage is owed for years to come, it is, obviously, long-term. Therefore, it should be used on long-term projects. Projects that will bring in extra revenue for years to come. Hopefully, even, beyond the point when the interest is paid off. Don’t use financial leverage for something that will provide a one-time spike in sales.
Operational leverage, on the other hand, is tied to assets that can be disposed of. They’re not very liquid assets, certainly. But they are typically a burden that can be relieved of easier than contractually owed interest. Real estate can be sold, salaried employees can be laid off. And so on…
Ironically, financial leverage is frowned upon and looked at as riskier than operating leverage. However, both essentially serve the same function. They’re components of the income statement entered at different places.
Fixed expenses can be a powerful lever or concrete boots that drag your company down. It’s all about how those fixed expenses are put to work.
How to understand and act on your degree of operating leverage
Once you know what your Degree of operating leverage is, then you will know what changes in Sales will mean for your Operating profit. If you don’t anticipate that Sales can be increased, then you’re going to have to explore means to reduce Fixed costs.
On the other hand, if you anticipate the Sales will improve next year, then you have to ask yourself if you’re willing to add more Fixed costs (that will further increase Sales). If you’re confident you can do so, you might have a really great year.
A change in sales or variable costs and the effect on a company’s financials
As can be seen on the Effects of changes worksheet – a 10% increase in Sales, Variable COGS, and Variable SG&A would translate into a 29% increase in Operating profit from the Base case. This is to be expected since the Degree of operating leverage for the Base case was 2.90 (10% × 2.90).
Keep in mind that Variable costs would increase at the same percentage as Sales – as is their nature.
The flip side is also true. A 10% decrease in Sales and Variable costs means a 29% drop in Operating profit (-10% × 2.90).
Note that the Breakeven Sales amount doesn’t change in either scenario. This is because Fixed costs didn’t change.
A change in fixed costs and the effect on a company’s financials
“Why would fixed costs change?” you might ask. “They’re fixed,” you say.
Well, in theory, they don’t. But in practice, they might.
First, not many costs are 100% fixed or variable. It’s a sliding scale. Over a long enough timeline, all costs are variable they say.
Also, Fixed costs are often tied to fixed assets. Fixed assets are acquired and disposed of over the years. Salaries, which can comprise a lot of Fixed costs too, fluctuate with the hiring and loss of employees.
So, as you can see, it’s not much of a stretch for Fixed costs to change.
When they do, we can see that a 10% increase in Fixed costs translates into a 19% decrease in Operating profit. Not at all what we would expect from our Confirmation equation. 0% × 2.90 = 0%! Operating profit shouldn’t change!
But in this hypothetical example, it did. And, in real life, it could.
Of course, the opposite was true too. A 10% decrease in Fixed costs meant a 19% increase in Operating profit.
Notice, too, that a change in Fixed costs meant a change in the opposite direction for the Breakeven Sales amount. Not surprisingly.
What will the degree of operating leverage tell you about your company?
Don’t forget, you can get insight into the degree of operating leverage for your own business by accessing the accompanying spreadsheet for this post. Just enter your information in the white cells on the Your degree of operating leverage worksheet.
Fill out the form at the top of this post ↑ for quick, easy, free access.
What are your thoughts on the use of operating leverage vs financial leverage?
What is your degree of operating leverage and would you like to increase or decrease fixed costs?
Financial leverage is simply the act of borrowing money to invest. This is done with the hope of earning a return on that money. A return that is greater than the cost. Often, the potential for gain is disproportionately bigger than the cost. But, the cost is fixed and will be the same regardless of the return earned. Small businesses must learn how to effectively manage their degree of financial leverage. Otherwise, they could find themselves buried under the weight of repayment.
Let’s talk about some of the advantages and disadvantages of financial leverage. Also, how the degree of financial leverage ratio can provide insight into net income.
Download your copy of the workbook used in this post
Complete the form below. Upon email confirmation, the workbook will open in a new tab.
Financial leverage advantages
Financial leverage is a strategy that can be employed to boost gains. The cost of borrowed money (typically) doesn’t change. So, if that money can be used in a way that earns returns beyond the cost of borrowing – a small business can end up way better off than it would have otherwise.
I always say that every investment comes down to three things – cash in, cash out, and time. If the cost of leverage (cash out) is low enough and the terms are favorable (time), then the cash in has the best opportunity to be big enough to make financial leverage worthwhile.
High financial leverage helps small businesses avoid dilution of earnings from the issuance of equity. It also gives them the ability to put more money to work than they would have otherwise. Both of these advantages can translate into excess returns.
Additionally, interest is tax-deductible. This lessens the tax burden that a company would realize if the same funds were raised through equity. Keep in mind that interest is a fixed cost. A fixed cost that can negatively affect a small business if operating profits aren’t high enough.
Financial leverage is a better fit for some businesses than others
On my sister site, I’ve written often about the benefits of certain business models. For businesses with the right business model, more financial leverage could be very beneficial. This is if it brings in more long-term customers. These business models are conducive to earning a good ROI on borrowed money.
Handling debt responsibly = the ability to borrow more in the future
If a small business effectively employs financial leverage, their creditworthiness improves. With improved creditworthiness, they will (likely) be able to borrow more in the future. If they continue to execute effectively, they can earn compounded returns.
The cost of borrowing (rate) could drop with a successful history of repayment. This could decrease the cost of future financial leverage. Lower cost should mean lower risk. Lower risk increases the likelihood of employing it in a successful manner.
Financial leverage disadvantages
Just as it has the potential to boost gains, financial leverage can also boost losses. Every dollar borrowed represents a little more risk. Again, that’s why the return from the borrowed monies means so much.
But, the lender doesn’t care if your small business makes 10x the cost of borrowing. Or, if it “only” makes 100% of the cost of borrowing. It expects its money back, plus interest, either way.
Borrowing money will increase your cash flow out. If the cash flow in isn’t enough to offset that, then, sooner or later, insolvency will ensue.
It all depends on the context
A lot of the negative stigma surrounding borrowing stems from the personal sector. In the personal sector, when people borrow, they often do so to buy consumer goods. Things that don’t earn any sort of return. These items actually depreciate in value. For example, cars and technology.
Nobody flinches when somebody borrows an ungodly sum of money to buy a house. This is because a house (for better or worse) is expected to increase in value.
Just as certain business models are conducive to financial leverage, others are not. Consider business models that sell time for money or one-time purchase items. These businesses will have to be confident in their financial modeling to ensure that they can earn an adequate ROI on financial leverage.
Finally, the perception of leverage depends on timing. During boom times, the companies borrowing look like geniuses. Conversely, if the economy turns against a business that has irresponsibly borrowed, then they could look foolish.
Financial leverage + operating leverage?
There are two general types of leverage that a small business can use. Operational leverage (which I plan to write about next) and financial leverage. The degree of operating leverage measures the effect of fixed costs (not interest) on operating income.
Beware compounding leverage by adding operating (fixed costs) to financial, or vice versa. This could sneak up on a small business. It could create a situation where management is caught unprepared. The result is potentially catastrophic. It’s important that scenarios like this be modeled out and planned for.
Most people understand the risks associated with borrowing money (financial leverage). The risks of operating leverage are a little more camouflaged.
Make sure you plan around your company’s (potential) total leverage situation. Annual strategic planning with an operating budget allows you to do just that.
Regulatory authorities might paint an overly rosy picture
When interest rates are kept low, the hurdle rate (minimum ROI to justify investment) is also lower. This incentivizes small businesses to take on projects that they might not otherwise. Less is demanded of investments. The pursuit of extraordinary returns might stop short in favor of quick-and-easy (but “good enough”) returns.
Also, by making interest tax-deductible, the effective cost of leverage is lowered even further. This further incentivizes small businesses to use financial leverage. Doing so could amplify any of the previously mentioned disadvantages.
Financial leverage example
The Degree of Financial Leverage shows the amplification that borrowing money can provide to profits and losses. So, for instance, in the example operating budget, the Degree of Financial Leverage is 1.4. This means, at this level of borrowing, that for every 10% change in Operating Profit, Net profit would increase by 14% (10% × 1.4).
That sounds great, but the opposite is also true. If Operating Profit declined by 10%, then this level of borrowing would cause Net profit to decrease by 14%. That’s the nature of leverage. It amplifies gains and losses.
I created a spreadsheet to model the changes in profit due to changes in other line items. It helps to better understand how the income statement is affected by financial leverage,
I started with a Base case income statement for a small business that has $1 million in sales. This example business also has a 20% operating margin with $500K in debt at a 5% Interest rate. Its Net profit is approximately $138K.
This company’s Degree of financial leverage is 1.14 ($200,000 ÷ [$200,000 – $25,000]).
Only one variable was changed at a time. Here’s what I found:
The effects of an increase or decrease in sales
A 10% increase in Sales translates into a 50% increase in Operating profit – all other things being equal. As expected, this 50% increase in Operating profit translates into a 57.1% increase in Net profit. This is because the Degree of financial leverage is 1.14 (50.0% × 1.14 = 57.1%).
The same thing happens, in the opposite direction. When Sales drop by 10%, Operating profit decreases by 50%. Net profit drops by 57.1%.
The effects of an increase or decrease in COGS and SG&A expenses
Since COGS is less than Sales, a 10% change doesn’t have as big of an effect on Operating profit. The result is a drop in Operating profit of 35%. As expected, the resulting change in Net profit is -40% (-35.0% × 1.14 = -40.0%).
SG&A expenses, being even lower, have less of an impact on Operating profit. A 10% increase only lowers Operating profit by 5% and Net profit by 5.7% (-5.0% × 1.14 = -5.7%).
Of course, things work the same in the opposite direction. A -10% change in COGS increases Operating profit by 35% and Net profit by 40%. A -10% change in SG&A expenses increases Operating profit by 5% and Net profit by 5.7%.
The effects of an increase or decrease in Long-term Debt & Interest rates
As shown above, changes in the income statement that result in increases to Operating profit are amplified in Net profit by the Degree of financial leverage.
But, what about changes below Operating profit? As expected, a 10% change in either the amount of LT Debt or the Interest rate, results in a corresponding 10% change in Interest expense.
This hypothetical small business carries a sizable amount of LT Debt. Still, Interest expense is still a relatively immaterial expense. Thus, the effect of a change in LT Debt and Interest rates is only ±1.4% on Net profit.
Click to enlarge
Going forward with a new Degree of financial leverage
Because of the nature of the Degree of financial leverage calculation (Operating profit ÷ [Operating profit – Interest expense]), when Operating profit increases, the Degree of financial leverage decreases – all other things being equal. The opposite is, of course, true too.
What does this mean?
It means that if your small business increases Operating profit this year, then your Degree of financial leverage is going to go down for next year. Which isn’t catastrophic. But, it means that a similar gain in Operating profit next year won’t translate into the same boost in Net profit.
To get that, your small business would have to borrow more funds.
On the same token, if your company has a decrease in Operating profit this year, then your Degree of financial leverage will increase for next year. This increase will amplify the effects of a gain in Operating profit next year. But, it doesn’t necessarily mean that you’ll end up ahead of where you would have been if you would have increased Operating profit in year 1.
Shortcomings of the Degree of financial leverage ratio
Again, the Degree of financial leverage ratio is calculated as follows:
Big companies typically borrow money through the issuance of bonds. This means that they only pay interest until the bond matures.
Small businesses, like yours, don’t issue bonds. The nature of borrowing can vary, but often, loans are repaid on an installment basis. E.g. payments consist of both principal and interest.
So, a ratio that only measures the effects of Interest expense doesn’t completely capture the impact of financial leverage. For small businesses anyways.
Two extreme examples
First, consider a small business that borrowed 10x their previous year’s revenue. If they did so at a very low interest rate, their Degree of financial leverage would also be relatively low. But, having borrowed a disproportionate amount of money, they would theoretically have the opportunity to boost Sales/Operating profit greatly.
Also, consider the other extreme. What if a company borrowed a very modest amount of money? But, was forced to pay an exorbitant interest rate? In this instance, the Degree of financial leverage would be relatively high. But, the company’s opportunity to use this leverage in a beneficial manner is limited.
Finally, in order for the Degree of financial leverage to accurately predict the change in Net profit, Taxes must remain at a constant percentage. E.g. they can’t be 21% of Operating profit – Interest expense (EBT) one year and 22% the next. The Forecasted Change in Net profit won’t equal what’s calculated in the Confirmation.
The amount of LT Debt and the Interest rate/expense must also remain constant for the “Operating profit × Degree of financial leverage = Change in Net profit” equation to work out.
So, obviously, the Degree of financial leverage has limitations. It is designed for big businesses – not necessarily small ones. It is based on amounts in the income statement, and not the cash flow statement. Thus, no consideration is taken for the effects of principal repayment.
If its limitations are kept in mind, and if reasonable changes are forecasted, then it can provide guidance on the potential benefits or detriments of financial leverage.
How financial leverage affects business decisions
Plug your small business’ information into the Your degree of financial leverage worksheet. It will help you better understand how your borrowing might help or hinder you in the coming year.
Financial leverage, in and of itself, is neither good nor bad. It’s all about how it’s employed. If it’s used to buy (rather than sell) consumable assets that provide little or no return – it’s wasted. If it’s allocated to resources that increase productivity (or earn extraordinary returns) – it’s a valuable tool for small businesses.
What are your thoughts on the use of financial leverage?
What are some of the advantages and disadvantages I neglected to include?
How about some ways that you’ve effectively employed financial leverage in your small business?
Periodic sales promotions give small businesses the best chance of boosting sales and profitability when they are carefully planned.
Care must be taken to not use periodic sales promotions as a crutch when sales fall short of expectations.
QuickBooks Online price rules give small businesses the opportunity to efficiently apply promotional pricing to products and services.
Small business owners, who are concerned about what effects sale promotions might have on revenue, can use this information to lower uncertainty
Periodic sales promotions
Weekly/monthly/holiday sales, aka periodic sales promotions, are something we’re all familiar with. The “one day only sale!” The “Memorial Day sale!” The “semi-annual sale!” Or, the most famous, the “Black Friday sale!” are all examples.
Before we get too far into it, let’s split hairs on the terminology a bit. A periodic sales promotion shouldn’t be confused with a discount or a markdown. A discount is a reduction in price for a particular group of customers. A sales promotion, typically, would apply to all customers.
A markdown is a “permanent” lowering of the price of goods in order to incentivize purchase so that they can be removed from inventory. This would be done for items that are slow-moving (or not moving at all).
Periodic sales promotions are a means of reaching periodic sales goals
Periodic sales promotions can help complement the efforts of salespeople and advertising. Whether your business markets to consumers or other businesses, a periodic sale can stimulate buying on the part of your customers.
Periodic sales promotions should compel your customers to purchase immediately. So, the nature of your promotion will have to be such that it bridges your customers’ culture with your sales goals. For example, are you trying to get customers to switch from a competitor? Or, are you trying to penetrate a whole new market?
Don’t launch a periodic sales promotion without a plan. Consider how the promotion will impact your business at different volumes. Decide what products/services should be included. Consider your best-case and worst-case scenarios so that you are mentally prepared for whatever your customers throw at you.
The upside of periodic sales promotions
Dead and slow inventory takes up valuable space. Worse yet, it ties up valuable cash. If you have inventory that is turning over slowly, you might consider how you can work it into a periodic sales promotion in order to make room for inventory that will actually sell. Doing so would be preferable to getting pennies on the dollar by discounting.
I wouldn’t offer a sale that revolved solely around dead and slow inventory, however. That might be a dud. Perhaps you might consider marking down dead and slow inventory extra – beyond the normal terms of the promotion. An example for a car repair business – a 10% off sale on brake replacement for President’s Day, with slow-moving tires offered at 40% off. Take advantage of the increased traffic to get the most that you can for the dead and slow inventory.
A periodic sales promotion might incentivize people who wouldn’t buy otherwise. If the promotion only runs for a few days, the sense of urgency could be increased. People who may only have a vague idea of what your business is about could be compelled to “check you out” while the sale is going on. Furthermore, the first-timers, if they are excited about what they found, might tell others.
Since a periodic sales promotion will hopefully bring in a lot of new faces, it’s an opportunity to collect some basic information. Even just an email address or a like on Facebook. Knowing more about your customers in general and those that were lured by the sales promotion specifically will help you to meet their needs better.
The downside of periodic sales promotions
Even the least savvy business person knows that if you sell something for less, you’ll make less profit on it. Periodic sales promotions will result in lower margins. The hope is – to make up for that with increased volume (quantities).
But, if you are able to pull off a successful periodic sales promotion, be careful not to begin to rely upon them. The siren song of a boost in sales/gross profit might prove irresistible if future sales don’t reach the levels you hoped. If periodic sales promotions are part of your strategic planning, then great. Run with it. Just don’t start using them as a crutch if things aren’t going as well as hoped.
When a customer purchases something at a reduced price, you might not be able to get a read on their future purchasing behavior. That is, beyond the fact that they’ll buy “x” amount of something at “y” price.
We’ve all heard the old adage “price, service, quality…pick two” when it comes to offering a value proposition to customers. If your business aims to excel in service and quality, but begins to succumb to the temptation to lower prices to boost sales, then you might see yourself transformed into a low-price provider – at the expense of service or quality.
It always comes down to…planning
Again, at the risk of being redundant, it all comes down to planning. Give your periodic sales promotions the thought and planning they deserve. Don’t just “knee-jerk.” Working it into a plan will give it the best chance of being successful.
Every industry is different. Every small business within an industry is different. There is no “one size fits all” solution to planning for periodic sales promotions. Nevertheless, since this website is SpreadsheetsForBusiness.com, after all, I took a stab at it.
Download the periodic sales promotion planning tool.
Complete the form below and click Submit. Upon email confirmation, the workbook will open in a new tab.
Click to enlarge
This is a very high-level workbook since it isn’t specifically made for any particular business/industry. Hopefully, however, it can give you a starting point for thoughtfully planning your own periodic sales promotion. Helping to ensure that it fits in with your strategic plan and helps your business reach its goals.
Periodic discounts in QBO
How to apply this knowledge in your accounting software, though? Well, here’s how you might go about it in QuickBooks Online.
We’ll look at periodic sales three different ways through the eyes of a restaurant:
First, an across-the-board 10% discount for everything. We’ll call it an “anniversary sale.”
Second, a 20% off of Mexican food and drinks promotion for Cinco de Mayo.
Finally, a weekly 15% off promotion for select desserts.
If you haven’t, read my previous post on the particulars of QBO price rules (levels). What follows won’t necessarily go into as much detail.
I’ll be using the sample company within QuickBooks Online Accountant. By default, this sample company is a landscaping business. For the purposes of these examples, I’ll make some changes to make the examples better reflect a restaurant business. But, if you see some odd things related to landscaping pop up in the screenshots or the video – that’s why.
In the previous example, we created a “dummy” price rule that provided no discount. We did this so that the price rule would not be applied by default during a sales transaction. However, in this example, for our restaurant, we want it to be automatically applied so that we don’t forget to give it to our customers. So, in this case, we’ll forego the creation of a “no discount” price rule.
Click to enlarge
Anniversary promotion
The across-the-board 10% discount is easy to set up. In the price rules screen, we’ll create a rule called Anniversary Sale. This rule will only be in effect over the weekend of April 27, 2019.
Since it is an across-the-board discount, All customers and All products and services will remain selected by default. A 10% decrease in price will be applied.
Simple.
Click to enlarge
Cinco de Mayo promotion
Next, we’ll look at the Cinco de Mayo promotion. In this case, it’s only our restaurant’s Mexican fare that’s on sale. Also, the sale only runs over the weekend – May 3, 2019, through May 5, 2019.
In this price rule, we selected the products in our Mexican subcategory. We then chose to decrease the price by 20%.
Click to enlarge
Weekly dessert promotion
Finally, we’ll tackle the restaurant’s weekly (Wednesday) discount on desserts, designed to get people in the seats during the slow mid-week time period.
This was approached in much the same manner as the Cinco de Mayo discount. Except, there is no Start date and no End date. This is an ongoing promotion. All products in the Desserts category were selected for inclusion and they were decreased in price by 15%.
Click to enlarge
Periodic sales promotions
When it comes to pros & cons, advantages & disadvantages, upside & downside posts, I always overlook a few. What are some of the pros and cons I missed for weekly/monthly/holiday sales promotions?
What other considerations need to be taken into account before a small business launches a weekly/monthly/holiday sales promotion?