How do I make an inventory list and other spreadsheets for my restaurant?
Spreadsheets serve as a great complement to, or replacement for, the other software a restaurant might rely upon. Spreadsheets can handle nearly any task you require of them. They are very versatile. Small restaurants, with a limited software budget, might find them particularly useful.
The author states that a computer is “Second only to a good set of knives”. And spreadsheets are “the cat’s meow.” They can help a restaurant with organization.
Spreadsheets can intimidate some people. But, they are only as complicated as you make them. It is suggested that you take a course if you must. Particularly if you want to take advantage of the power of formulas.
Spreadsheets will make your life as a restaurant manager easier. Once you take a little bit of time to climb the learning curve.
Spreadsheets can fill in gaps in functionality for pieces of software. Many POS systems and most accounting software will export to .csv format – which can then be imported into a spreadsheet.
Some of the things a restaurant can use spreadsheets for
Staff scheduling
Drop in pre-made shifts for each employee
Order sheets
Purchase orders for ingredients
Automatically calculate tax and totals
Vendor lists
A master list of all vendors with name, address, phone, and email
Keeping good documentation will help with financing. Good documentation provides detail about how and why your startup restaurant will be successful. Spreadsheets are an excellent tool for providing documentation.
Afraid that all your time and effort will leave you saying “Why did my SBA loan get denied?”
Lack of collateral
Applying at too big of a bank
Personal credit score less than 680
Business credit score (SBSS) less than 160
Poor business plan and financial projections
Lack of business equity
Poor/lack of documentation
Lack of industry experience
Applied for more/less than the lenders maximum/minimum
These are some of the reasons your SBA loan might get denied. At least according to a sampling of Reddit users. Reddit can be helpful, particularly in cases like this. It is usually a cesspool though. So, I saved you a trip.
SBA loans are highly sought-after because they have reasonable interest rates and long repayment terms. If you’re considering pursuing an SBA loan, browse through the following testimonials to get a better feel for how hard it can be to get approved. Hopefully, it will help you be better prepared and will increase your odds of approval – if you decide to apply.
Do you need collateral for an SBA loan?
user/TheSuperDanks
If you have minimal collateral, good fucking luck.
My buddy who is extremely credit-worthy had to basically sign his life over to get his SBA loan. He owns 2 houses, has great credit, etc. The program is just a ton of paperwork.
This Reddit user seems to think collateral is needed for an SBA loan. Granted, they didn’t apply for the SBA loan themselves. It was a “friend.” However, as you read on, you’ll see that a lot of other users corroborate the notation that considerable collateral is almost always necessary.
Here’s an idea of what types of collateral the lender might be looking for:
Real estate
Equipment
Inventory
Accounts receivable (AR)
Personal assets
Chances of getting approved for an SBA loan
user/prosignandgraphics
I have applied twice and received an education in the process.
Application Attempt #1: full business plan, a lot of drive, lots of experience in my field, a great idea but no assets to secure the risk = NO WAY
Application Attempt #2: 5 years of experience under my belt, solid cash flow, good chunk of savings, equipment and A/R to secure the loan risk = YES, how much do you want?
So basically, if you already have the money / collateral / cash flow you have a good chance of getting the loan. If you have no assets, cash flow, accounts receivables, savings etc. then your chances plummet to practically nothing.
This user, again, cites the importance of collateral.
If they’re to be believed, they had a lot going for them when they tried to get approved for their first SBA loan. However, they had no assets to help secure it.
It should be noted that they also had five years of experience upon the second application. It’s unknown how much they experience they had upon the first application. The implication is that they had very little.
Nevertheless, while the experience helped, it seems obvious that collateral contributed to them getting approved the second time around.
So, what are the chances of getting approved for an SBA loan?
Well, it seems to depend on the type of bank you apply at.
Large banks are choosier – only approving approximately 25% of SBA loans.
Small community banks and credit unions are what SCORE recommends that small businesses use. They might be on to something because these types of institutions will approve almost twice as many SBA loans. Source.
Are you personally liable for an SBA loan?
user/Pseudo_Prodigal_Son
So the easiest way to make sure your loan gets approved is to own an asset that is worth as much as the loan amount.
Almost all banks doing SBA loans will want an asset to guarantee the loan. And unless the business has large assets (e.g. a building) they can use as collateral, they will want to use your house as collateral. If you business fails, they will take your house. If you don’t own a home or have other suitable collateral, they will not give you a loan.
This user gets a little more specific regarding collateral. They state that the assets you use for collateral need to be worth twice the loan amount.
While that might not be technically true, it’s generally believable. I’ve worked in personal lending for a while and I know that lenders rarely lend 100% loan-to-value (LTV).
Why do banks loan less than 100% LTV? Because, in a worst-case scenario, when they have to repossess the asset, they’ll rarely get what it’s “worth.” The liquidity of the asset can be very low and/or they’re in a hurry to sell it. Not to mention the asset is probably in less-than-stellar shape. Therefore, they get less than market value. That’s why they like to lend less than 100% LTV.
How much less depends on other factors related to creditworthiness.
As mentioned above, personal assets can potentially be used as collateral in lieu of business assets.
Also, if you own more than 20% of the business, you have to provide a personal guarantee for the SBA loan. Because of these factors, you are most certainly personally liable for an SBA loan.
What credit score is needed for an SBA loan?
user/__Focused__
Loan broker here.
Most SBA-backed lenders won’t touch a deal that is below $50K. Your credit is also bordering on the minimum (many want 680+) and a loan would likely weigh heavily on your assets and/or downpayment.
Here, we see a user touch, again, on collateral. However, they also focus on some different requirements. Specifically, the minimum personal credit score of 680 and the minimum loan amount of $50K.
Keep in mind that there are SBA loan options for less than $50,000 – as mentioned in other testimonials.
The personal credit score needed for an SBA loan is set by the lender, not the SBA. So, the minimum personal credit score will vary.
Generally speaking, if your personal credit score is below 640, it’s very unlikely that you’d get approved for an SBA loan. In fact, plan on having a personal credit score of at least 680 to be “good enough.” As always, though, an even higher personal credit score can only help you.
As far as a business credit score goes, plan on having an SBSS (business FICO) of 160 or greater. No less than 140. Source.
What documents are needed for an SBA loan?
user/sawbucks
I’ve been successful at acquiring two separate sba backed loans. As another has mentioned you will have to write a business plan showing how you intend to use the money, how that plan will increase your revenue, and also how much additional revenue you intend to see. I used my first loan to purchase an existing business and had to show how I intended to improve the current business and come up with 3 years of projections and show how each part of my plan would affect these numbers over time. It was very involved including phone interviews with the underwriter and a very deep dive into the business itself. I was told something like 70% of sba loans dont get approved but if you have strong financials and a strong plan for the money I think youd be ok.
This user had to come up with a full business plan and financial projections.
This intensive documentation shows the lender that you have thoroughly thought out how you’re going to invest those SBA loan proceeds in your business. You’ve also considered the environment your business will operate in and what effect it will have on your operations.
Numbers don’t lie (usually), so you can’t hide behind abstract promises when you are forced to come up with solid financial projections.
Beyond the documents needed for the SBA loan, notice how the lender also made them qualify their assumptions. So, be prepared to “defend” your position when you apply for this type of financing.
How long does it take to hear back on an SBA loan?
user/abcriot
I just got an SBA loan for $100k, guaranteed by the state (CA). I have a service based virtual business out of my home. I’ve been in business less than 1 year, which is seen as risky. They required I put a capital injection of 20% ($20k), so I had to show that I in my year of business I had put at least $20k of my own cash into my business.
The whole process wasn’t to hard, but it was long. I started in November and got funded the second week of March.
The user also claims that the hardest part of getting an SBA loan was the wait.
Their experience doesn’t seem to be too out-of-the-ordinary. From start to finish the process for getting an SBA loan seems to run anywhere from 60 to 90 days. More in some cases.
It’s hard to say when in November this user started the loan process, but, at the most, it only took them one month longer than usual to hear back on their SBA loan.
This could have been due, in part, to the amount of time it took them to assemble the needed documentation. It’s difficult to know. As specified in other testimonials, the documentation requirements can be considerable.
Therefore, try to assemble the needed documents ahead of time. Also, don’t wait until you absolutely need the financing to apply. By the time you hear back, you could have missed the opportunity you hoped to capitalize on. Or, if times are tough, you might have missed the chance to right the ship.
Can you get an SBA loan for a startup?
user/nickwimp
Can you provide a overview of what’s required to qualify for a SBA loan? my father and I are starting a machine shop and need a total of 350k to get the doors open. machine costs are around 250k. Thanks
user/saxscrapers
Solid, well-thought out business plan. Personal credit scores above 640 or if not, a really good story for why so low. All owners greater than 20% guaranteeing loan. For start ups, equity injection of 20-30% (or more- it would only help). Post-transactional (after loan has been made) liquidity of the owners to fund any short term expenses that were not foreseen or some sort of outside income. Good experience of the owners/managers.
If you have all of those things, you should be pretty good. All banks have different credit tastes and prefer some industries to others, so just because one bank is not interested doesn’t mean a different one wouldn’t be willing to work with you.
This testimonial, and a few that follow, are from an “ask me anything” (AMA) Reddit post. In this post, an individual claiming to be a credit analyst for an SBA lender answered some other user’s questions.
This particular user asked about getting an SBA loan for their startup machine shop.
The credit analyst touched on some previously mentioned requirements such as credit score and personal liability. They also mentioned the “skin in the game” needed to get an SBA loan for a startup.
As mentioned previously, 20% equity is pretty standard. This shows the lender that you have something significant at stake. Which, in turn, increases the likelihood that you’ll repay the loan rather than walking away from the venture if times get tough.
The credit analyst mentions that 30%, or more, will only increase your chances of getting an SBA loan for a startup. In the lender’s mind, the more you have at stake, the more you’ll work to succeed.
The credit analyst goes on to mention how financial projections are important. But, they aren’t going to be precisely correct. So, consider how you might finance any near-term startup expenses that you didn’t anticipate.
Finally, the credit analyst mentions something that hasn’t yet been addressed in a testimonial. That’s industry experience. This is an intangible that can help you get an SBA loan for a startup. It won’t necessarily overcome some of the quantifiable requirements (credit score, equity, collateral). But, it can help influence a lender that might be on-the-fence about some of the other aspects of your business plan.
Does an SBA loan show up on a credit report?
user/moneymonda
Do you run business and personal credit reports in the loan approval process? If so on the business credit reports, are they through experian or dnb or something else? How much do the business credit scores weigh on the approval process since it can be common for a small business to not have many (if any) tradelines reported to the bureaus?
user/saxscrapers
We absolutely run personal credit reports on all guarantors of the business (SBA requires anyone with 20% or more to guaranty, or if a spouse owns between 5 and 20%, but the other spouse has over 20%, they both must guaranty). The initial bank i was with did not order business credit reports as they were rather small, but the bank i am with now does. Depending on the type of business, trade line history can range from not applicable (for cash businesses) to pretty important. The business credit reports are from either DnB or CreditSafe and show tradeline history, and collections or tax liens that are outstanding or were in the past and any UCC liens on the business. The business credit reports aren’t as influential as the personal credit scores, but do carry some merit.
This user asked the credit analyst if both personal and business credit reports were run during the SBA loan application process. In particular, they wanted to know what agencies were used to pull credit. Finally, they were interested in what weight was placed for each (personal and business) credit report.
From what the credit analyst conveyed, personal credit reports are almost certainly going to be run on any individual with significant ownership in the business. And, possibly on their spouse.
Business credit reports are a different story. This is up to the lender and may depend, in large part, on the industry you operate in. Additionally, the credit analyst stated that business credit reports didn’t weigh as heavily as personal credit reports. Which is somewhat counterintuitive since SBA loans are, technically, business loans.
Knowing that credit will be pulled might lead you to ask “will an SBA loan be reported on my credit in the future?”
Details are hard to find here, but it seems that the SBA loan will show up on your business credit report. Not on your personal credit report. Even though you will likely provide a personal guarantee on the loan. Source.
How many times can you get an SBA loan?
user/luxorius
How long does it take to obtain a SBA loan, on average? What is the smallest and largest loan size available, typically? What is the duration of the instrument? Do SBA loans typically fund a company more than once? What is the minimum balance sheet coverage and other collateral coverage that SBA loans are backed by? What types of ratios and covenants comprise SBA loans?
user/saxscrapers
From start to finish, if you have all documents needed to underwrite your loan, it can take as little as 2 months from application to closing, but those are pretty rare. Time is always a huge variable, and depending on the nature of the transaction, they can take as long as 6 months or so.
Smallest loan size depends on the bank. The bank I work at doesn’t do anything less than around $150K. There are microloan providers which only focus on loans less than $100K or so.
Duration is 7 years for working capital, 10 years for leasehold buildout/business acquisition, 25 years for real estate purchase or refinance, building improvements and possibly for equipment purchase if you can prove the equipment you are purchasing will have a useful life of 25 years. All SBA loans are fully amortized with no balloon payment.
There is no minimum balance sheet coverage for SBA loans. There is a minimum of 10% tangible net worth for USDA loans.
The great thing about SBA loans is that they are designed for borrowers that don’t meet conventional collateral requirements. Banks are specifically told to not turn down loans based on a lack of collateral given all other factors of the loan are positive (cash flow, credit scores, management capability). The one thing to note, though, is if the loan isn’t fully secured, banks are required by the SBA to lien personal real estate of the guarantor/principal if there is 25% or greater equity in the real estate.
There are circumstances where the same company will get multiple SBA loans but that is a pretty uncommon occurrence. You will see guarantors with multiple businesses that have different sba loans for their different businesses.
Ratios that we use the most are current, quick, debt to tangible net worth, gross profit margin, net profit margin, days receivable, days payable and days inventory.
This user had a lot of questions and the credit analyst took the time to answer them in-depth. So, there’s a lot to address here.
First of all, the credit analyst confirmed what had been addressed in an earlier testimonial. That the quickest you can expect the SBA loan process to go is two months. What was surprising was that they also said it can take up to six! This reinforces my earlier advice to plan well in advance.
The largest SBA loan you can get is $5 million. This is a firm number.
The smallest, though, depends on the lender. Keep in mind that the SBA has several different loan programs, some of which are designed for smaller loan amounts. This would be a good question to ask before the loan application process starts. So that you don’t waste your time and hurt your credit if the amount you need is below the lenders minimum.
From there, the credit analyst addresses the term of SBA loans. This depends, in large part, on what the proceeds will be used for. If it will be used for expenses (working capital) the term will be short. If it will be used for long-lived assets, the term can be longer. Of course, the longer the term, all things being equal, the lower the payment.
Next, we have some new insight, not discussed in any of the other testimonials. It comes back to the topic of collateral. According to the credit analyst, if your collateral isn’t worth enough to fully secure the loan, the lender will put a lien on your personal residence. In fact, they’re required to by the SBA.
While SBA loans are hard to get approved for, in light of collateral requirements. These requirements can actually be in your favor. Remember the testimonial earlier that mentioned having 2x the loan amount in collateral? That’s probably a good rule-of-thumb to keep in mind, should you decide to pursue an SBA loan.
The credit analyst goes on to briefly touch on financial ratios. These will vary by industry and be calculated in your financial projections.
Finally, maybe the most pressing question in this testimonial is “how many times can you get an SBA loan?”
This depends on what you mean by “how many times.”
Of course, if you got an SBA loan and paid it off you can get another. Assuming that the loan stayed in good standing, I could only see it working in your favor.
What about multiple SBA loans at once?
Well, it technically can be done. Up to a given SBA program’s limits. Source.
But, according to the credit analyst, it’s pretty uncommon. It’s unknown if this is because of how hard it is to get approved for an SBA loan. Or, for another reason. The exception is an individual who owns multiple businesses and takes out an SBA loan for each.
Why did my SBA loan get denied?
As you can see, there are many reasons an SBA loan might get denied. These loans are hard to get approved for and the requirements are stringent. Fortunately, there are other options if you decide an SBA loan isn’t right for you or you get denied. Good luck!
The financial projections section of your business plan is where you forecast your sales, expenses, cash flow, and capital projects for the first five years of your small business’s existence.
This is a critical section for readers of your business plan. It tells them:
How you expect your startup to perform financially
When you expect your new business to be profitable
How profitable you expect it to be
These are things you’d want to know as an investor, right? It’s up to the reader to decide whether they think your forecast is feasible.
Additionally, as an entrepreneur, it forces you to consider, thoroughly, what the first five years of business might look like. This will give you a good plan to work off of, will help you to be proactive, and will increase your likelihood of success.
Finally, the financial projections are the foundation of your funding request. Of course, your funding request, after all, is the primary purpose of your business plan.
Without knowing how much cash you need to launch and operate early-on, you won’t know how much you need to ask for. The funding request relies heavily upon financial projections, particularly the capital budget.
An example of a funding request, for this same business, will be posted separately.
This example of financial projections is built off of two previous posts:
Download the restaurant financial projections spreadsheet
If you’d like to download the spreadsheets I used to make these financial projections for a restaurant that can be done below. Keep in mind that these were (hastily) built off of budgets for a manufacturing company and tweaked for the restaurant industry. However, they should serve as a good starting point.
Complete the form below and click Submit. Upon email confirmation, the workbook will open in a new tab.
Startup restaurant financial projections
The financial projections for Diner, LLC provide a well-thought-out, cohesive, and comprehensive forecast of the restaurant’s performance from initial funding through the fifth year of operation. These forecasts will validate the feasibility of the concept and the appeal of an investment in this venture.
The financial projections for Diner, LLC include an initial capital budget for all of the fixed assets and other costs necessary to launch the restaurant.
Additionally, five years of pro forma income statements are included. These pro forma income statements are built off of a detailed five-year operating budget.
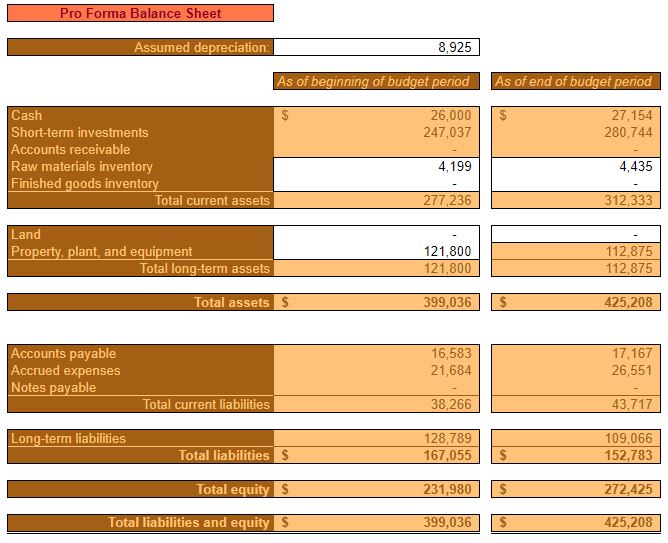
Furthermore, five years of pro forma balance sheets are also included. These pro forma balance sheets are built on five years of detailed cash flow analysis.
For the purpose of brevity, not every detailed budget is included in this business plan. However, all are available for decision support, upon request.
Items in italics represent those directly referenced in the financial projections.
Startup restaurant capital budget
The capital budget summarizes Diner, LLC.’s forecasted operational and cash flow results over the next fifteen years. It takes into account:
Fixed assets needed to operate the restaurant
Launch costs necessary to begin operations
Cash-on-hand needed to launch the restaurant
To cover unanticipated expenses
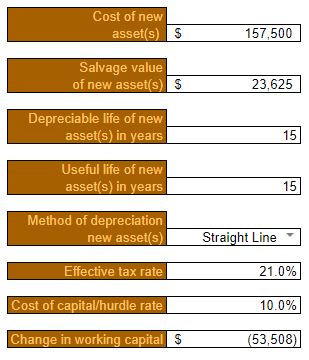
Fixed assets necessary to operate Diner, LLC. are estimated to cost $157,500.
The salvage value after fifteen years is estimated at $23,625.
On average, all assets are assumed to have a depreciable (and useful life) of fifteen years.
Fixed assets will be depreciated using the straight-line method.
The effective tax rate, for purposes of calculating a depreciation tax shield, is estimated at 21% throughout the capital budget.
A discount rate of 10% is used to calculate NPV and other capital budgeting metrics. This discount rate considers the cost of borrowing (6%) and adds an additional risk premium of 4%. 6% is the estimated interest rate for an SBA 7(a) Small Loan and is calculated by adding 2.75% to the current Prime Rate (3.25%).
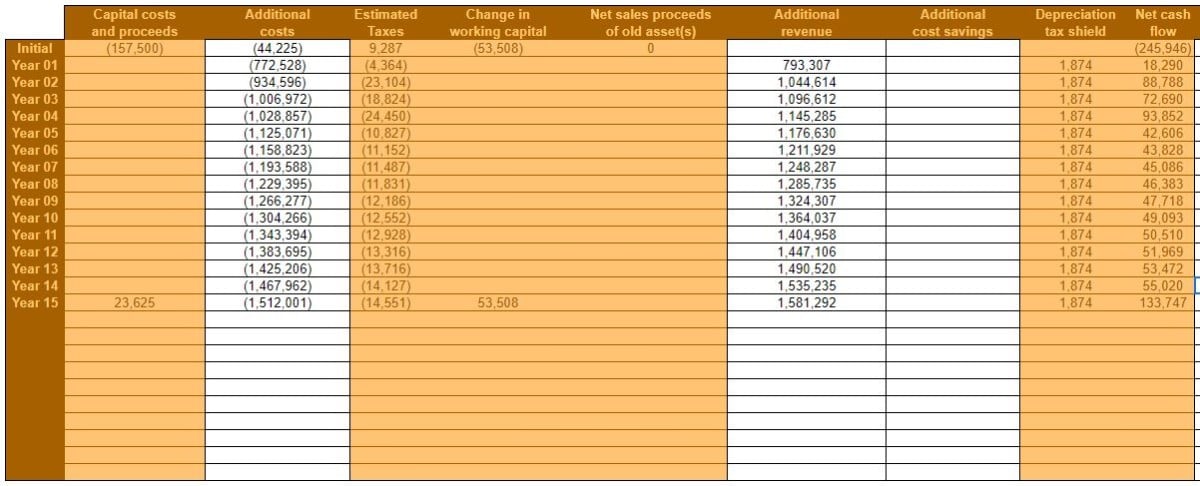
Click to enlarge
Initial Additional costs include launch costs that can’t be depreciated. E.g. professional services, organization & development costs, and other pre-opening costs.
Additional costs for Year 01 through Year 05 are pulled directly from the operating budget. Additional costs for Year 06 through Year 15 are assumed to grow at a rate of 3% per year after Year 05.
Additional revenue for Year 01 through Year 05 is also pulled directly from the operating budget. Additional revenue for Year 06 through Year 15 is assumed to grow at 3% per year after Year 05.
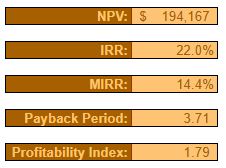
Over the course of fifteen years, the Summary of the capital budget shows:
Net present value (NPV) of $194,167
Internal rate of return (IRR) of 22%
Modified internal rate of return (MIRR) of 14.4%
Payback period of 3.71 years
Profitability index of 1.79
It’s worth noting that if the restaurant were to be sold at the end of fifteen years, the NPV would be considerably higher – accounting for the proceeds from a sale.
Startup restaurant operating budget
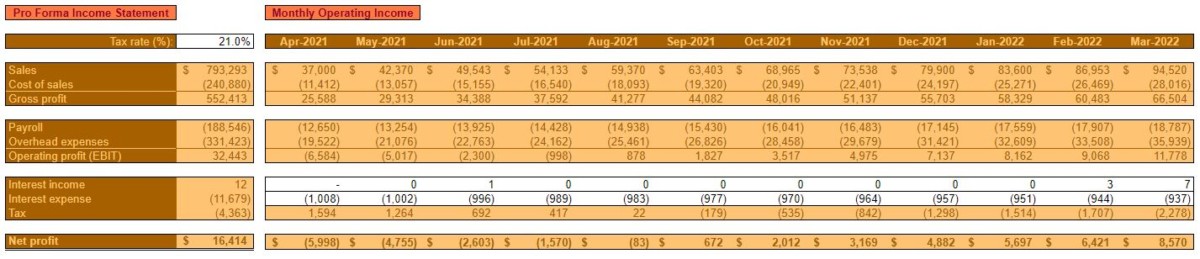
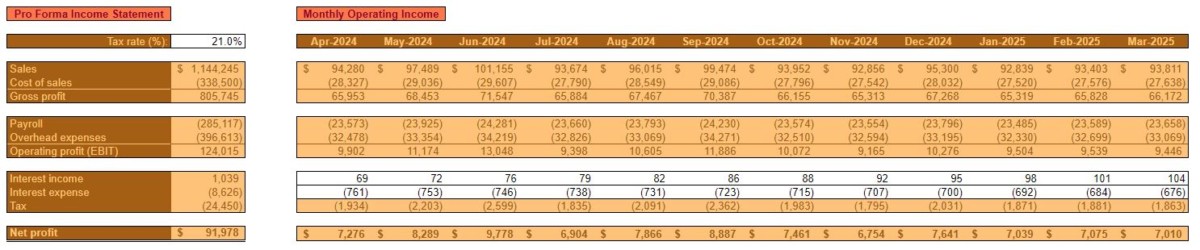
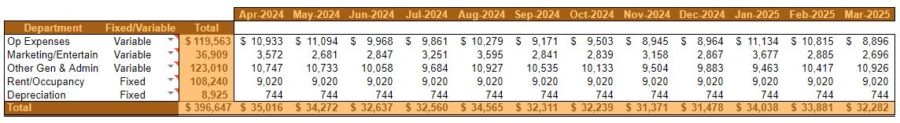
In the operating budget, Diner, LLC.’s sales, ingredients (cost of sales) payroll, and other overhead expenses are forecasted by month. Additionally, annual amounts are shown in a Pro Forma Income Statement. Each individual component of the budget is analyzed and forecasted separately in an attempt to be as comprehensive and realistic as possible.
Restaurant operating budget Year 1
Click to enlarge
Year one of operations is characterized by low initial sales that grow quickly throughout the first 12 months of business. The first month of profitability is estimated to be Month six – September 2021.
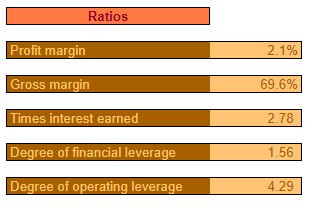
As such, the Profit margin is very low for the year overall but, it is expected that the year will be profitable.
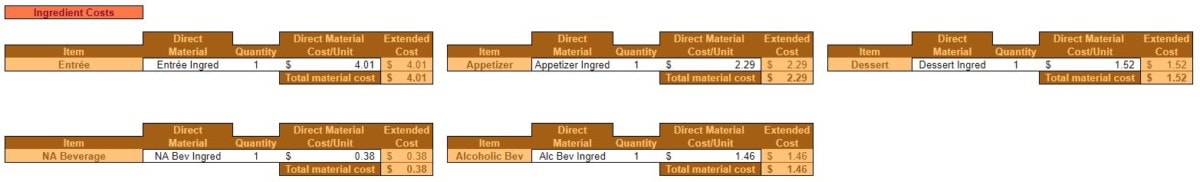
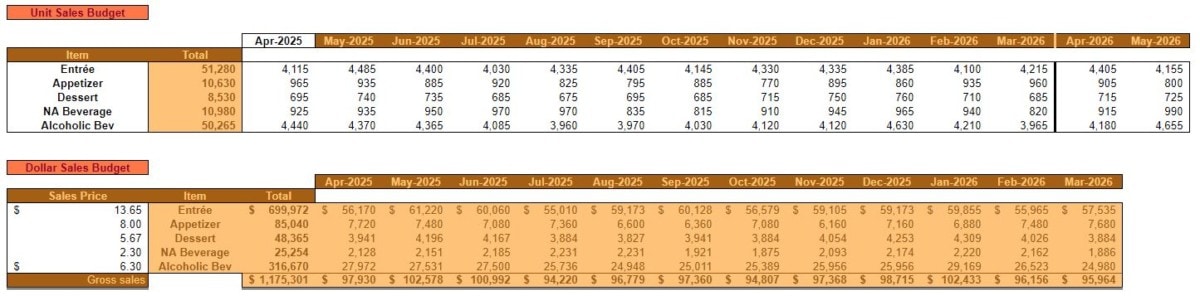
Click to enlarge
The Sales Budget breaks down the expected Unit volume and Dollar Sales for each category of products sold. These categories are:
Entrées
Appetizers
Desserts
Non-alcoholic beverages
Alcoholic beverages
Each individual product in a category will have a different price, of course. However, for the sake of simplicity, items were grouped by category and an average Sales Price is estimated.
Sales prices will initially be set higher than average. At or near the “indifference price point.” At this price point, the number of customers that consider the price a bargain should be close to the number that feel it’s starting to get expensive.
This is done with the hopes that the Diner, LLC.’s novelty, image, and quality will still provide a perceived value for customers. Additionally, pricing as high as practical will help to offset the low initial Unit Sales after launch.
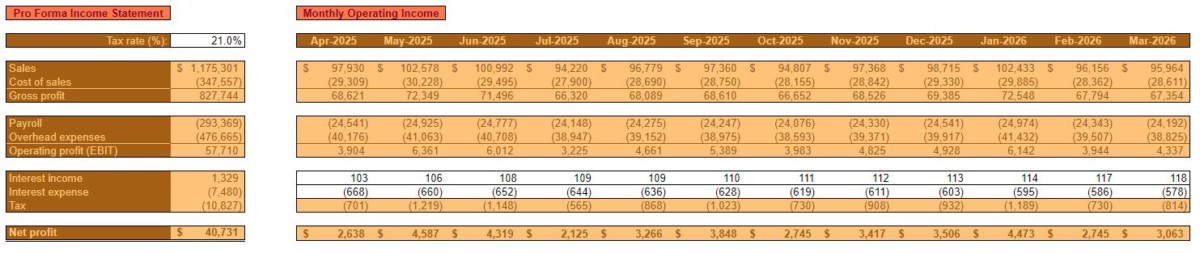
Restaurant operating budget year 2
Click to enlarge
Year two of operations is characterized by a leveling off of Unit Sales after reaching near practical capacity at the end of year one.
Additionally, it’s anticipated that Sales Prices will remain the same throughout the year after being on the high side in year one.
However, in spite of rising costs, overall sales are expected to increase significantly due to consistent demand throughout year two.
Click to enlarge
As mentioned, most costs, including ingredients, are expected to increase by an average of 3% in the second year.
As with sales categories, for the sake of simplicity, ingredients are grouped together into categories. Their costs represent an average of all the ingredients contained in a category.
Restaurant operating budget Year 3
Click to enlarge
In year three, unit sales are expected to continue to remain level. Sales Prices are anticipated to increase by approximately 5% to offset increased costs. Diner, LLC. is expected to have its highest year of profitability yet.
Click to enlarge
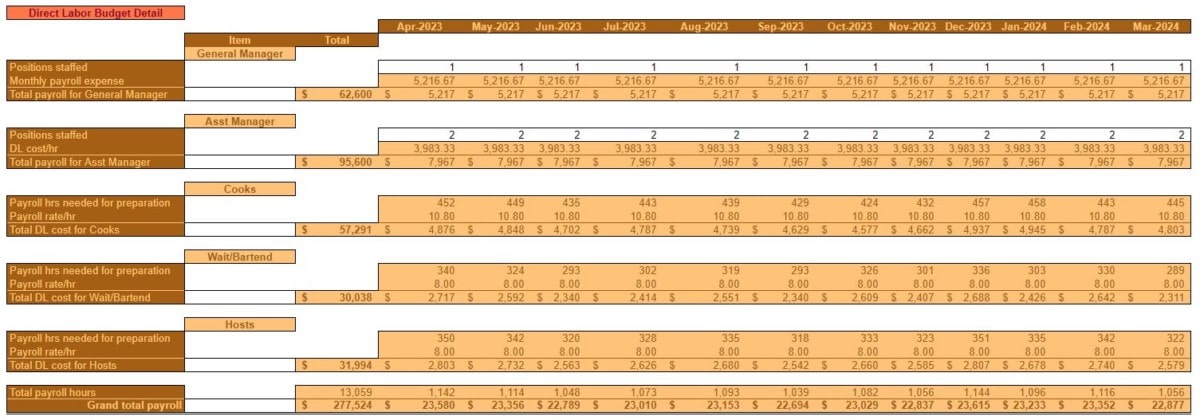
As was the case in year two, payroll is again expected to increase. This is due to an increase in wages and salaries of roughly 3%. It is Diner, LLC.’s intent to incentivize customer service and quality through above-average employee compensation.
In years one and two, the staff is expected to consist of:
One General Manager and one Assistant Manager, along with Cooks, Waitresses/Bartenders, and Hosts as needed, part-time, depending on sales volume. The General Manager and Assistant Manager are expected to cover any staffing shortcomings.
In year three, however, it is budgeted to add a second Assistant Manager position to relieve some of the responsibilities of the other managers.
Restaurant operating budget Year 4
Click to enlarge
With Unit Sales, for all practical reasons, expected to be maxed out, Sales Prices would need to be increased in year four in order to achieve meaningful revenue growth.
As is typical, all costs are expected to increase by 3%, on average, in year four.
One exception is the Rent/Occupancy expense. When operations are initiated, Diner, LLC. is expected to enter into a three-year lease. At the beginning of year four, the lease will have expired and a new lease will need to be signed. A 10% increase in Rent/Occupancy expense is anticipated.
Restaurant operating budget Year 5
Click to enlarge
By the end of year five, Diner, LLC. is expected to remain profitable. That is, as long as Sales Prices are kept adequately above costs without sacrificing demand.
In order for the Diner, LLC. to grow from this point, the opening of a new location or another type of expansion would need to take place.
Click to enlarge
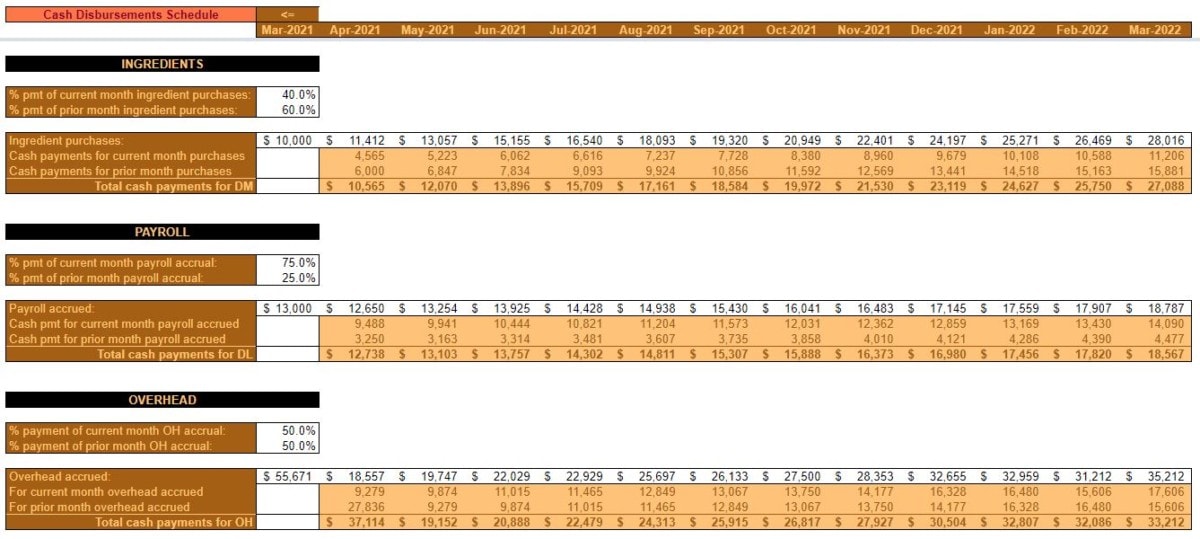
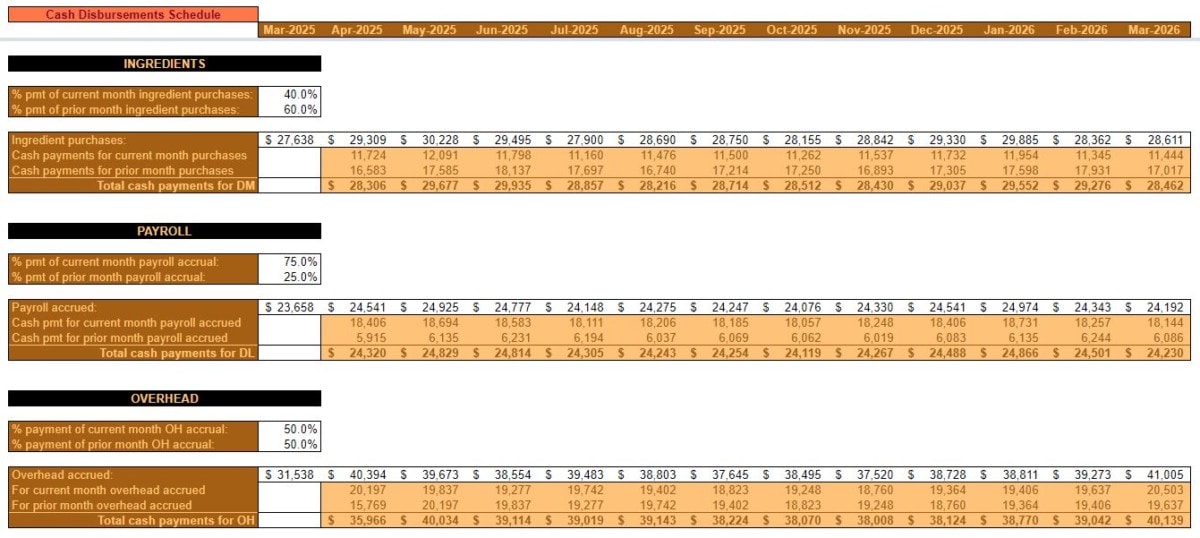
Startup restaurant cash budget
The cash budget forecasts the timing of cash collections and cash disbursements. This is done in an effort to ensure that Diner, LLC. remains solvent.
Obviously, the nature of the restaurants’ business model is such that cash collections are always made at the time of sale. So, no Accounts receivable are ever anticipated to be on the books.
However, ingredients, payroll, and overhead are not necessarily paid for in the same month but those expenses are incurred. Therefore, the timing of cash flow out will not necessarily correspond with expenses on the operating budget.
The cash budget is where a Desired ending cash balance is specified. Additionally, details on any financing (long-term and/or short-term) and savings account balances are also addressed.
Restaurant cash budget Year 1
In the time leading up to the first month of operation, a considerable amount of money will need to be borrowed by Diner, LLC. to pay for pre-opening expenses. The Beginning cash balance is set at $43,500 in order to offset low initial sales.
Click to enlarge
Pre-opening ingredient purchases, payroll, and overhead expenses are estimated and accounted for.
The timing of cash payments is estimated by assigning a % pmt of current (& prior) month for each expense type.
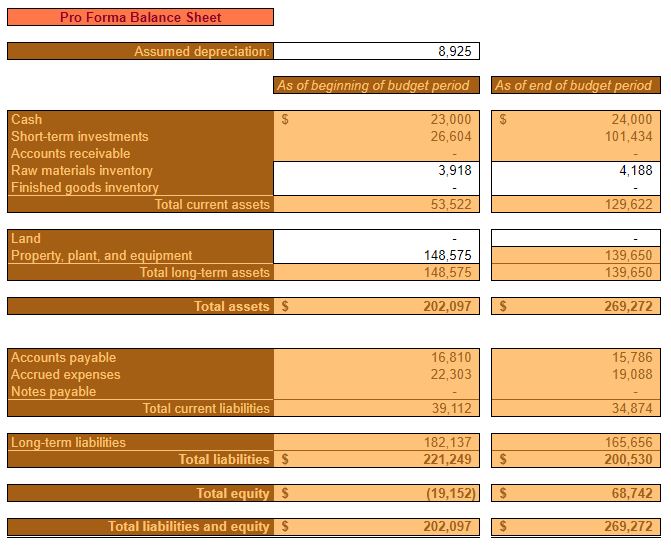
Restaurant cash budget Year 2
The increase in Unit Sales for year two is expected to help turn negative equity positive. Additionally, prudent cash management is expected to contribute to the security and solvency of Diner, LLC.
Click to enlarge
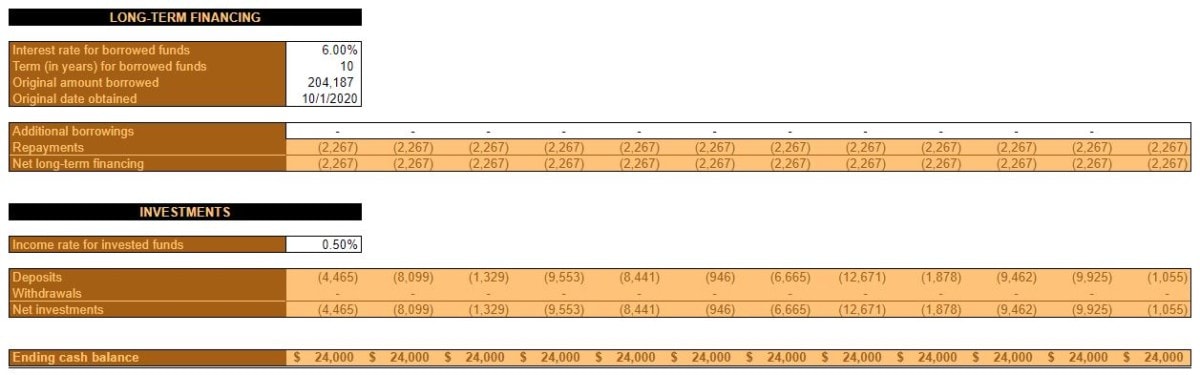
Maintaining an Ending cash balance of $24,000 every month puts the restaurant in a position where it doesn’t need to rely on any short-term or long-term financing. It also facilitates the ability to put excess cash into a liquid investment account. This investment account is available to offset negative, unforeseen, events. Or, to put towards future growth and expansion.
Restaurant cash budget Year 3
Year three is expected to see the continued reduction of debt and a subsequent increase in assets and equity. Certain balance sheet items like inventory, Accounts payable, and Accrued expenses are expected to increase in line with increasing costs as outlined in the operating budget.
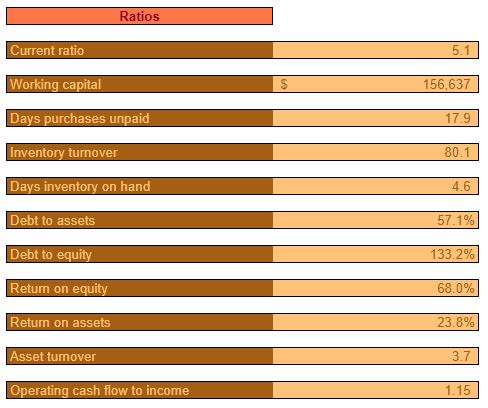
All ratios at the end of year three are expected to be relatively healthy. At this point, Diner, LLC. is expected to still have a relatively high Debt to equity ratio. This ratio is expected to continue to decrease, however.
Restaurant cash budget Year 4
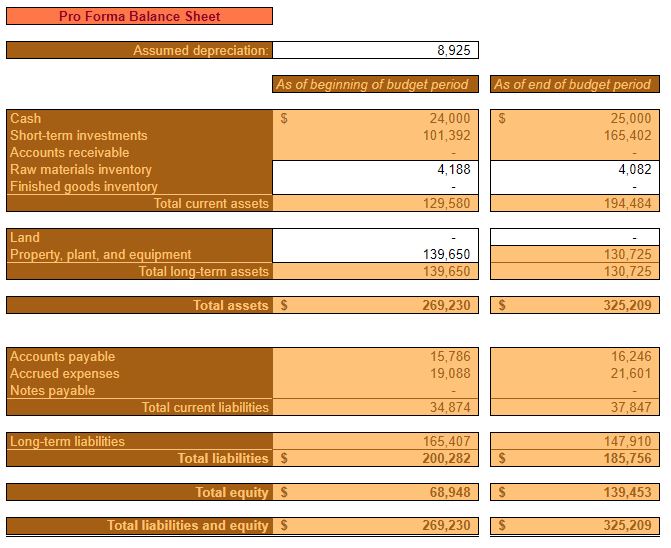
Throughout year four, assets and equity will continue to grow.
Cash and short-term investments begin to make up a considerable portion of assets.
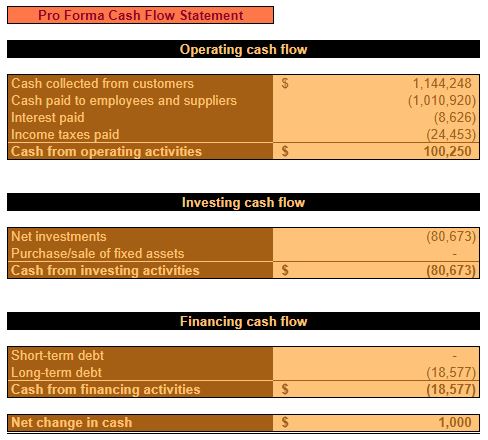
The year four pro forma cash flow statement offers a different perspective than the income statement and balance sheet. It shows how it’s anticipated to be cash positive from operating activities and how the majority of that cash will be used to pay down debt and put into a short-term investment account.
Restaurant cash budget Year 5
By the completion of the fifth year of operation, equity is estimated to be between $250,000 and $300,000. Cash balances continue to grow at approximately $1,000 per year, in order to account for increasing expenses.
Barring unforeseen events, Diner, LLC. should be expected to adequately cover expenses and to deposit a considerable amount of cash receipts into short-term investments.
This growing investment account will serve as a margin of safety for unforeseen circumstances and/or will allow for expansion or other projects – should that course of action be chosen.
“How do startups get financial projections?” Financial projections for a business plan start with forecasting an operating budget and then a cash budget for the first five years of business. With these budgets, pro forma income statements and balance sheets can be created. Coupled with the inclusion of capital budget(s), an all-around picture of your startup’s financial future will come into focus.
The financial projections section of your business plan is the foundation for the funding request section. It’s also, in part, where you quantify the viability of your business idea. Lenders and investors will be very interested in this particular section. There are three primary components of the financial projection section.
A capital budget for these types of big cost/reward ventures can help you with the timing and amounts of revenue, expenses, and cash flow in the budgets that follow.
The reader of your business plan will appreciate the supporting information Plus, the extra analysis will help ensure that you are spending your funding wisely.
Start with sales
As emphasized in the operating budget template for small biz post, most financial projections start with forecasting sales. Why? Because of the volume of sales you (expect) to make, will drive how much you spend.
In the calculating funding requirements post, the point was made that you should project your financials out for five years. Yes, it’s nearly impossible to accurately predict your monthly revenue several years from now. However, the reader of your business plan will want to know that you’ve at least thought that far out.
Keep in mind that month 1 of your forecast probably won’t be the first month you expect to make sales. Rather, it will be the first month after you receive your funding requirements.
Your first month of sales might come well after that.
Spending money to make money
Now, knowing how much you expect to sell, you’ll have a better idea of what you’ll have to spend to make those sales.
It’s here that it’ll become obvious why you started forecasting after you received your funding requirements. Because, depending on the industry your business is in, you might have to spend a significant amount of your funding just getting set up. For instance, you might need to spend money on things such as:
Licenses, permits, and registration fees
Beginning inventory
Deposits
Down payments on fixed assets
Utilities
Other startup expenses
Plug these expenses into the appropriate months following the receipt of your funding requirements.
Once your pre-launch expenses are forecast, then you can focus on your operating expenses – the ones that will correspond with earning revenue. Different industries will have different costs in different proportions. But, here are some categories of costs to consider as you complete your forecasted operating budget:
Materials
Labor
Overhead (utilities, depreciation, real estate)
Marketing and sales
Administration (accounting, human resources, IT)
Match these costs up with your forecasted revenue and subtract them from that revenue. You should now have monthly estimates of your operating profit for the next five years.
Interest and tax expenses will be deducted from operating profit to arrive at the forecasted monthly net profit.
Remember your capital budget? Don’t forget to account for the revenues and expenses related to your projects and capital expenditures. A capital budget is built on cash flows in and out. So, you might have to adjust the timing of corresponding sales and expenses.
Pro forma income statement
With your revenue, cost of revenue, selling general and administrative expenses, interest expense, and income tax expense estimated, you can now put together yearly pro forma (expected) income statements.
This pro forma income statement will serve as a snapshot of your (hopefully increasing) profitability over the next five years.
Cash budgeting
The cash budget, not to be confused with the cash flow statement, specifies when cash will actually come into and leave your business.
The operating budget stated when you’ll make the sales, but not when you’ll actually collect cash. Some businesses collect cash more or less immediately. Restaurants and retail, for example. Others issue invoices and have to wait to collect cash. Some might even have customers who never pay.
Forecasting sales for the reader of your business plan is important. But, beyond that, they’re going to want to know when you’ll actually collect on the sales. That’s the point of the cash budget.
Why make a cash budget if it’s so similar to the operating budget?
A cash budget tells the reader of your business plan that you take cash flow seriously. That you understand cash must come in quickly and leave slowly – to the extent that it’s practical.
As mentioned, the cash budget is built off of the operating budget.
Just simply adjust all of those sales into the future and enter them in the month you expect to collect cash.
Alternatively, for each expense, adjust it to the month in which cash will actually leave your bank account.
From there, all that’s left to do is make a note of your starting cash. Then, add the cash you expect to collect every month and subtract what you expect to spend. This will leave you with a new cash balance at the end of every month which, in turn, becomes your starting balance the following month.
You haven’t forgotten about your capital budget, right? Those capital expenditures and projects can have a huge effect on cash flow. Make sure they’re being accounted for in your cash budget.
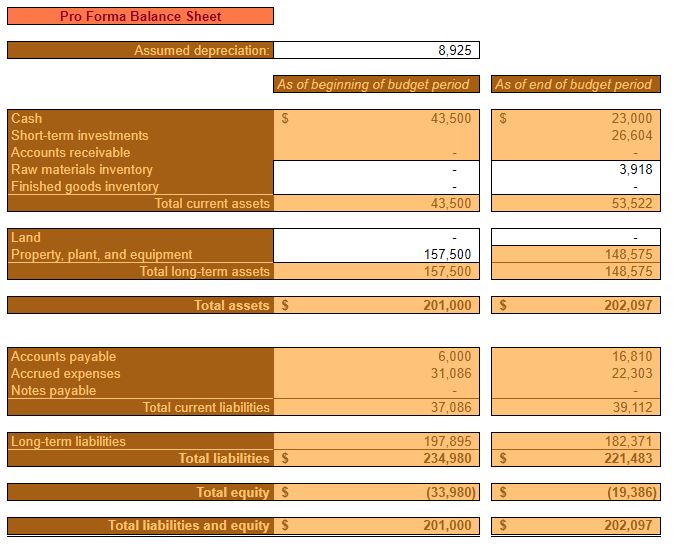
Pro forma balance sheet
The pro forma balance sheet is a snapshot of your company’s owner’s equity for each of the five years forecasted.
With your operating and cash budgets in hand, you have what it takes to calculate your assets, liabilities, and owner’s equity balances at the end of each year.
Admittedly, calculating a pro forma balance sheet can be a little daunting. If you’re not well-versed in accounting you might reach out to someone for help. Alternatively, you can use the Spreadsheets for Business example + template of a small business financial budget for inspiration. The pro forma balance sheet is automatically calculated based on what you enter for the cash budget.
A pro forma cash flow statement is also automatically calculated.
How do startups get financial projections?
The information above outlines the quantified information to include in your business plan.
I would suggest that you accompany each budget and pro forma statement with some qualifying information too.
For instance a written synopsis of why you forecasted what you did. A reasonable narration of your startup’s financial position over the next five years. This will help flesh out your vision of your company’s future and why it would be a smart investment.
The Funding Requirements section of your business plan is where you outline:
How much money your startup is going to need to begin operations and reach self-sufficiency
Whether you are seeking debt financing, equity financing, or both
Any other details regarding how the money will be used, how much will be returned to the financier(s), and when it will be returned
Unless you have a really big chunk of money saved up, you’re probably going to have to do what most other startups do – ask for money. Ultimately, the goal is, of course, to make the business self-sufficient. But, early on, if you want to scale up quickly, you’re probably going to have to leverage someone else’s money.
What would you want to know if you were giving someone money to start a business? Would you want to know how they’re going to use it? How they’re going to preserve it? How about how they’re going to build upon it?
Maybe you’re a lone wolf? You want to keep this operation as lean as possible. Particularly when it comes to people.
I can appreciate that!
Nevertheless, if you’re going to be funding this thing on your own, you still want to hold yourself accountable. You want a plan regarding where your money will be spent, and how you’re going to earn a return on it.
1) Capital, operating, and financial budgets
Starting a business from scratch is not so different from a decades-old business starting a new year. The required tasks are nearly the same.
Writing posts on, and making templates for, strategic planning topics is the foundation of this website. Capital, operating, and financial budgeting is critical to small business success.
The capital budget will specify any projects and/or large-scale assets you intend to buy. Plus, what kind of return you expect on that investment.
The operating budget is where you forecast your first one, three, or five years of operation. Your revenue, your cost of revenue, and your sales/administrative costs. An operating budget leads to the creation of a pro forma income statement.
Finally, your financial budget. This is your cash budget. It specifies when you think you’ll actually put money in your bank account from all those sales you’ll be making. It also specifies how you plan to stay solvent. This budget leads to the creation of a pro forma balance sheet and cash flow statement.
2) Determine funding need
All of the preceding budgets, particularly the financial (cash) budget, show where the money is going to be used. Once you compare the business’ cash needs to the cash you’re contributing, you’ll know how much is required from outside sources.
Budgeting will also show when and how the business is expected to make enough to support itself. Furthermore, other important milestones will be reflected. Milestones such as your first sale, your first $10,000 in revenue, your first $1 million in revenue(?), and so forth.
Can you see how these budgets will serve as a good measuring stick for your business’s launch and growth?
3) Funding details
Now that you know how much outside funding you’ll need to get off the ground, it’s time to really get into the nitty-gritty details.
Step one is to specify how much of the funding will be debt and how much will be equity. If you’re seeking equity investment, you’ll want to outline a proposal dictating what their investment will buy them. Also, how much power that equity investment will wield.
Another important point to clarify is the timeframe. For instance, things such as debt/balloon payments. If you’re really aggressive, there might come a point where you expect to cash out of the business and pay your equity holders
Whatever the case may be, you’re going to be clear about the status of the business at the end of the five-year forecast. Plans can change, of course, but you’ll want to include an exit strategy for those who are investing in you.
Finally, you should consider building on step one (budgeting) and clarify how the debt/equity funds will be used. Will it be for fixed assets, marketing, other operating expenses, or something else?
What are business funds?
Business funds are used by the business for their financial requirements. A business needs money to run. It is the oxygen that fuels its operations.
Starting a business is not cheap. To fund your new company, you’ll need some money upfront and this can be one of the first financial choices made by entrepreneurs when they start their own enterprise. But it’s also an important decision that could have lasting impacts on how your structure and run your business over time.
There are a variety of sources to turn to if you’re looking for small business funding. Capital may come in various forms like loans, grants, or crowdfunding.
Before you seek out funds, make sure to have a solid business plan and a clear outline of how the money will be used. Investors want assurance that their investments are being well managed so they can invest with confidence in the company’s future success!
What are funding requirements in a business plan?
This is what your entire business plan has been building up towards.
If you follow these steps for calculating funding requirements, don’t you think you’ll have an enormous amount of insight as you launch your startup?
This is the culmination of all the hard work you’ve put into your business plan thus far. Once completed, you’ll know how much money you’ll need, and what you’ll use it for.
Asking someone to invest in your business is like asking for a sale. Fortunately, if you’ve stuck with me this far you’re well prepared to write the funding requirement section of your business plan. I’m sure you’ll get what you need to be successful!
The marketing and sales section of your business plan is where you explain your strategy for bringing in sales. It is critical because making sales is paramount for business success.
The following example draws heavily from the previous two posts on the subject.
In this example, I’m using a fictional startup auto repair and maintenance shop we’ll call Auto Repair, Inc.
Feel free to copy this example and tweak it for your needs.
Marketing strategy
Auto Repair, Inc.’s (ARI) marketing strategy aims to earn a high return on investment (ROI) on marketing efforts. The marketing strategy is rooted in the marketing theme.
The goal is to carefully consider and continuously review the marketing strategy – making adjustments where necessary. Whatever strategies are implemented, adherence will be enforced.
Target market
As described in more detail in the market analysis section, ARI’s target market can be summarized as follows:
Households in the same or bordering ZIP Codes as the service facility
Male
Age 21 years and over
At least 1 vehicle available to the household
Household income ranging from $40,000 to $199,999 per year
Marketing theme
ARI’s marketing will adhere to a consistent message highlighting the benefits of using their auto repair services and their unique selling proposition (USP).
ARI will hold itself to the highest standards of honesty and integrity. The benefit to the customer will be knowing that they aren’t being deceived and not being charged for unnecessary repairs. The intent is to make ARI the first choice for automobile maintenance and repairs in the local market.
Furthermore, by paying for the expedited shipping of parts that aren’t in inventory, ARI will be able to offer its customers timely service. The benefit of expedited shipping is that customers won’t be inconvenienced for any longer than necessary.
It is these two things – honesty, and timeliness, that comprise ARI’s USP. This is what ARI will strive to be known for. It is what will make them unique among their competitors.
Promotional strategy
It is ARI’s intent to focus on three promotional strategies at any given time. The ROI for these promotional strategies will be measured to the extent possible.
Flexibility will be a priority. The promotional strategy that is performing worst will be replaced or adjusted upon quarterly review. This strategy should result in a continually increasing marketing ROI.
All promotional efforts will emphasize the previously mentioned marketing theme.
The following are the initial strategies ARI intends to employ:
Sponsoring local community events
ARI will focus on community events in the local metropolitan area that pertain to automobiles. These events will be sponsored, if possible. A presence will also be maintained at these events where coupons and promotional materials will be handed out.
Social media
ARI will maintain a strong social media presence. In order to increase the likelihood of effectiveness, ARI will outsource this activity to a local marketing firm. Additionally, ARI will employ the use of exclusive codes in social media promotions which will aid in tracking the scope and scale of social media efforts.
Referral program
ARI will implement a referral program that will strongly incentivize current customers to refer new customers. Under this referral program, if new customers state that they were referred by an existing customer, the existing customer will receive a 50% discount on their next oil change.
Technology
ARI will rely heavily on technology in order to leverage and measure the effectiveness of their promotional strategies.
Social media, as mentioned previously, will play an important part of ARI’s marketing strategy. Initially, social media will serve as one of the primary means of promotion.
Additionally, analytical tools will be relied upon to gauge the effectiveness of ARI’s marketing and sales strategies.
Finally, customer relationship management (CRM) software will be critical to maintaining a reliable database of prospects and existing customers. Plus, it will facilitate the collection of relevant information and aid in the overall marketing and sale strategy.
Pricing strategies
Carefully considered pricing is critically important to ARI’s success. Automobile service and repair is, unfortunately, viewed as a commodity. It is ARI’s intent, through an effective marketing strategy, to differentiate themselves from the competition and lessen the commoditization of their services.
ARI’s initial pricing strategies will be as follows:
Bundle pricing
A detailed analysis will be conducted to determine attractive, yet profitable, discounts that can be provided to customers who purchase two or more services concurrently. These dynamic pricing models will be programmed into the CRM software and applied automatically.
Psychological
Psychological pricing will also be used in promotional materials. Where practical, prices will be adjusted to the nearest $.99.
Sales strategy
ARI’s sales strategy revolves around a flexible, practical, and transparent process that makes all employees continuously aware of the company’s progress towards its sales goals.
Process
All of ARI’s employees will be coached on the sales process which revolves around its marketing theme. The marketing theme emphasizes customer service, honesty, and timely service.
This theme will be highlighted in all customer interactions. Particularly through the use of transparency in discussing repairs. Also, through emphasizing the expected time of maintenance and repairs.
Continuous learning
Training will be conducted quarterly for all employees and on an as-needed basis individually.
During training, the tenants of the marketing and sales strategy will be highlighted. Employees will be given the opportunity to ask questions and discuss scenarios. At this time, there will be an opportunity to address any necessary issues, shortcomings, or changes. All of this is done in an effort to reinforce the strategy, and to be flexible as needed.
Sales goals
At ARI’s quarterly sales training, sales goals for the company as a whole will be stated.
Additionally, the sales goals, and progress towards them, will be made clearly visible to all employees throughout the quarter. Every employee will understand the part they play in contributing to those goals.
Sales goals will be tied to the annual strategic plan, and, more specifically, the operating budget.
Sales goals will revolve around total revenue, and be broken down into monthly, weekly, and daily milestones.
Sales forecasts
Sales forecasts are covered in detail in the financial projections section of the business plan.
If you know the price of something, you can calculate the cost that will give you a 30% margin as follows: Cost = Price × 70% (1 – margin %).
In business, the very existence of an enterprise is determined by its profitability. Making a profit can be an elusive process, requiring a good understanding not only of the Cost of Goods Sold (COGS) but also the functions performed to sell the product or service.
There are many models that help define costs so that profit margins can be properly calculated. Choosing the best model is critical to establishing proper pricing levels. The math involved in calculating a 30%, 40%, or 60% margin isn’t the difficult part of the process. It is determining the right starting point that requires the most scrutiny and clarity.
Easy to Say But Hard to Do
The first thing to consider is – have all the relevant and pertinent costs been included in the final cost calculation? This is where many companies become confused and the process of determining costs can become quite complex.
Unless the true costs of a product or service are known, any calculation related to profit will not be accurate. This failure to incorporate all relevant costs could end up costing a company dearly.
It’s All About the Budget Baby!
Putting together the costs associated with a product/service includes much more than the obvious costs (material, labor). These are the beginning point for the calculation, but there are other areas that should also be included in the formula. Consider the following:
Invoice Amount
Does the invoice include any discounts for early payment or penalties for late payment? Those numbers should be included in the costing formula.
Handling Costs
If the item is delivered or picked up, there will be a separate cost involved in its transportation. There are also the costs associated with handling the item after its receipt like inventory and warehousing expenses.
Cost of Money
Products that sit on the shelf for an extended period of time have company money invested in them that is not producing at income while it is tied up in inventory. This is known as an opportunity cost.
Taxes
Like death, taxes are inevitable and the costs involved in paying taxes on inventory or property held at the end of a tax year can add to the product’s true cost. Inventory that turns quickly isn’t as much of a concern as inventory which takes a long time to get sold or used.
Overhead
This is always a loaded question with an explosive answer. What is overhead and how should it be allocated? Calculating overhead accurately is a science unto itself. Determining how to allocate it can be problematic at best.
Fudge Factor
Also known as “budget override” or “other costs.” This is an amount added to other costs to make sure nothing is left out of the calculated amount. In most cases, this is an additional 2% to 5% to help cover any unexpected changes.
Add It All Up and It Spells True Cost
The cost of acquisition, handling, overhead, and other considerations have been added up. A final total true cost has been determined. Now what?
With all that formulation and processing, the resultant number is one you can have confidence in. Now that we’ve looked over what the true costs are we can finally multiply it by 30%, 40%, 60% and there’s the sales price. Right?
No.
Markup is not the same as margin. But, more on that in a bit.
Price is what determines margin
Knowing the true cost is the first step, but now it’s time to look at the selling side of the equation. Here are some other factors to consider:
Cash Flow
Is the product or service sold and paid for immediately or does it go on an account for 30 days or more? Are there discounts offered for prompt payment or pre-payment of invoices? Will the buyer earn volume discounts for large orders or is a discount earned over time based on volume?
Associated Costs to Deliver
Sales programs offering free freight or trips to Hawaii for sales associates are additional costs that should be estimated when determining overall profitability.
Negotiation Protocols
Some companies state their prices and no one challenges those prices; other companies state a price but they know the customer will be negotiating the price based on different issues. Allowances should be made to include any fluctuations involved as a result of negotiating the price for the product or service provided.
After-sale Follow-up
Once the product or service has been delivered the costs associated with the transaction aren’t done accumulating. After-sale follow-up by customer service, warranty expenses, and product administrative costs like safety notifications or updates add up quickly and should be taken into account.
Inflationary Issues
Not all inventories are subject to inflationary conditions but many companies find themselves confronted by the costs associated with wider economic issues. Issues that could alter the costs of inventory or services. Construction, manufacturing, and many other industries are constantly facing changes in local, regional, and national economic conditions that affect their business at its most basic levels.
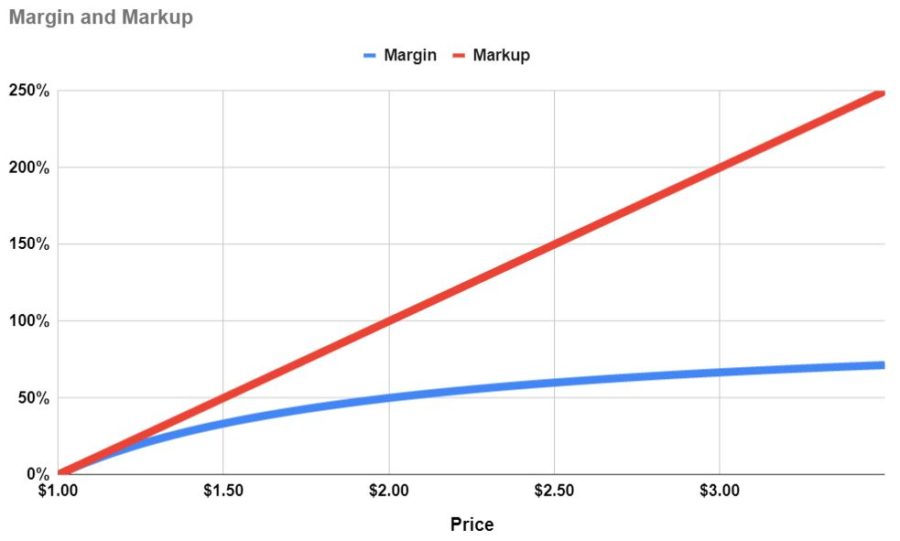
Margin vs Markup
These are two terms that are often mixed. They are similar (even sound similar!) but they are not the same.
Margin can only approach 100%. Markup can be an infinite percent.
Markup is based on cost. It is calculated by dividing profit (gross, operating, or net) by cost.
Say something costs $1.00. If it’s marked up 30%, the price would be $1.30. If it’s marked up 60% the price would be $1.60.
Margin is based on price. It is calculated by dividing profit (gross, operating, or net) by price.
Say something costs $1.00. If it has a 30% margin, the price would be $1.43. If it has a 40% margin, the price would be $1.67.
Price = Cost ÷ (1 – margin %)
Here are some more comparisons of margin and markup:
Price
Cost
Margin %
Markup %
$1.00
$1.00
0%
0%
$1.43
$1.00
30%
43%
$1.67
$1.00
40%
67%
$2.50
$1.00
60%
150%
$3.00
$1.00
67%
200%
$4.00
$1.00
75%
300%
Click to enlarge
Retail, Wholesale, or Manufacturer – The Rules Still Apply
So, is a 30%, 40%, or 60% margin good?
It depends.
It depends on whether you are talking gross margin, operating margin, or net margin. It also depends on the industry and business model you are referring to. Every business and industry is different. What’s good and what isn’t can only be determined when comparing to an appropriate benchmark.
Some industries work with high profit margins and others work on minuscule margins.
Regardless of where an organization stands in the supply chain, the need to maintain profitability is important. Advanced accounting methods combined with software that can quickly search through data to extract the most important information makes the process of assigning costs much easier and much faster.
However, the need to incorporate all salient costs and related expenses can become burdensome and overly detailed if not monitored for accuracy and applicability. Traditional models have been replaced by highly-customized programs that reflect the conditions of individual companies rather than using industry-wide standards for calculating costs.
Protecting the Margin
Knowing the true and detailed costs of a product or service is critical in a competitive environment. If margins start to slip, most businesses will go to their suppliers looking to save money and maintain profit margins by asking for discounts. Or, they might take other cost-saving measures.
Any Way You Cut It, Margin Still Matters Most
The discussion over the difference between the terms “margin and “mark-up” are arguments over the same thing – profit. Unless an organization is a non-profit, its goal is to make a profit and to do so for as long as possible.
Net profit is often called the “bottom-line” and it still defines an organization’s character and capability to many. Every financial analyst, stockbroker, and business columnist focuses on a company’s ability to not only generate a profit margin but to do it repetitively and under a variety of conditions. Knowing the numbers and figures that determine the actual costs for a product or service leads to the opportunity to produce the desired margin more readily and realistically.,
Businesses use operating leverage to keep costs fixed when they expect extraordinary sales volume. Keeping costs fixed means that businesses can carry more of that revenue to net profit.
The degree of operating leverage is a formula used to calculate how much operating leverage a business is employing. This formula tells you what will happen to operating profit when revenue increases or decreases.
The degree of operating leverage can be calculated two ways.
The first calculation looks at past costs:
Degree operating leverage = % change in Operating profit (EBIT) ÷ % change in Sales
If you don’t know your cost mix (variable vs fixed) then you don’t know how it’s affecting your small business. You don’t know if it would be advantageous to change the mix. And, if you did, what would happen. You don’t have a complete picture of your business and, therefore, aren’t making fully informed decisions.
Download the operating leverage workbook
Complete the form below and click Submit. Upon email confirmation, the workbook will open in a new tab.
Degree of operating leverage and fixed costs
Operating leverage is the use of Fixed costs in order to amplify changes in Operating profit due to a change in sales.
Fixed costs might be considered risky because they do not change no matter how much you produce. But, they also don’t rise if you produce (and sell) more. The risk and reward go hand-in-hand.
The degree of operating leverage is a ratio that tells you how much your Operating profit will change due to a change in Sales.
For instance, if your degree of operating leverage is 5.0, then a 10% increase in Sales will translate into a 50% (5.0 × 10%) increase in Operating profit – all other things being equal.
Conversely, a 10% decrease in Sales will translate into a 50% decrease in Operating profit. The pendulum swings both ways.
Which formula should you use to calculate degree of operating leverage?
You can determine your small business’s degree of operating leverage through a couple of easy calculations. Or, you can just plug your numbers into the free workbook!
Some suggest calculating the degree of operating leverage as follows:
% change in Operating profit (EBIT) ÷ % change in Sales (Source)
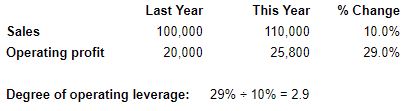
For instance, comparing this year to last year, let’s say your Sales increased 10% and your Operating profit increased by 29%.
29% ÷ 10% = 2.9. That was your degree of operating leveragelast year. This formula doesn’t tell you what it is now.
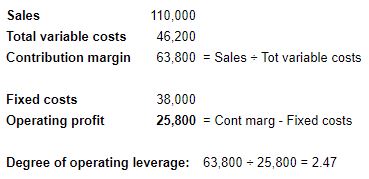
In order to calculate your degree of operating leverageright now, use the following formula:
Total contribution margin ÷ Operating profit (EBIT)
If you’re not familiar, Total contribution margin = Sales – Total variable costs. Not just manufacturing variable costs (Variable COGS), but SG&A variable costs too.
Degree of operating leverage and profit
Your degree of operating leverage can give you insight into the risks you run from your cost structure (mix of fixed and variable). It tells you how susceptible your Operating profit is to changes in demand.
It will also allow you to know how much you need in Sales to breakeven. The higher your Fixed costs, the higher that breakeven point will be.
Beyond that, it tells you if your Fixed costs are in line with your ability to generate Sales. If that ability is high, then your company can benefit from the leverage provided by Fixed costs and can earn excess returns.
Conversely, if those Fixed costs are locked into assets that won’t contribute meaningfully to Sales, then they are going to be a drag on Operating profit. You’re always going to be fighting against them.
Financial and operating leverage are similar in that they employ the use of fixed costs in order to (hopefully) amplify the effects of sales on net profit and operating profit respectively.
Here are a few of my thoughts on the subject:
Since financial leverage is owed for years to come, it is, obviously, long-term. Therefore, it should be used on long-term projects. Projects that will bring in extra revenue for years to come. Hopefully, even, beyond the point when the interest is paid off. Don’t use financial leverage for something that will provide a one-time spike in sales.
Operational leverage, on the other hand, is tied to assets that can be disposed of. They’re not very liquid assets, certainly. But they are typically a burden that can be relieved of easier than contractually owed interest. Real estate can be sold, salaried employees can be laid off. And so on…
Ironically, financial leverage is frowned upon and looked at as riskier than operating leverage. However, both essentially serve the same function. They’re components of the income statement entered at different places.
Fixed expenses can be a powerful lever or concrete boots that drag your company down. It’s all about how those fixed expenses are put to work.
How to understand and act on your degree of operating leverage
Once you know what your Degree of operating leverage is, then you will know what changes in Sales will mean for your Operating profit. If you don’t anticipate that Sales can be increased, then you’re going to have to explore means to reduce Fixed costs.
On the other hand, if you anticipate the Sales will improve next year, then you have to ask yourself if you’re willing to add more Fixed costs (that will further increase Sales). If you’re confident you can do so, you might have a really great year.
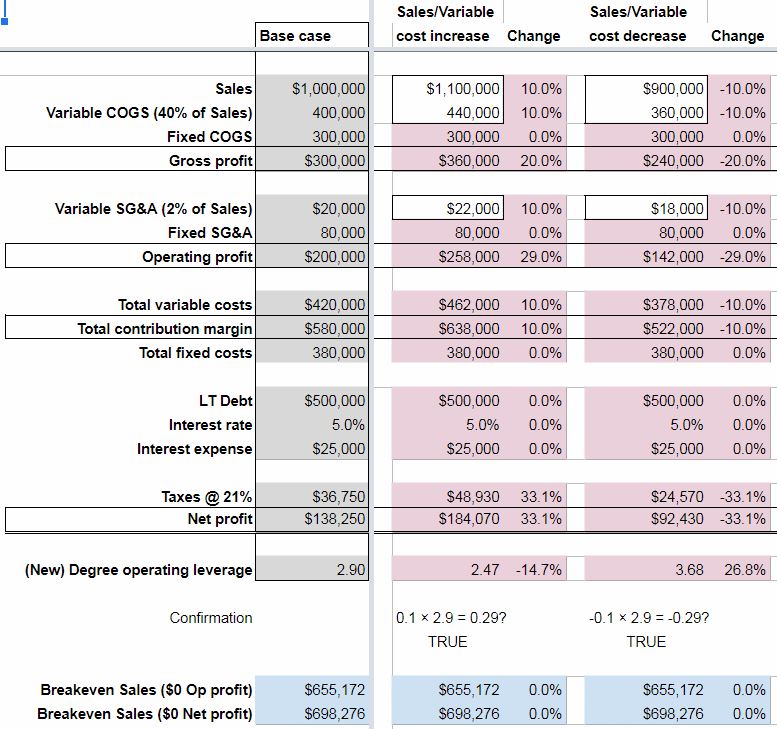
A change in sales or variable costs and the effect on a company’s financials
As can be seen on the Effects of changes worksheet – a 10% increase in Sales, Variable COGS, and Variable SG&A would translate into a 29% increase in Operating profit from the Base case. This is to be expected since the Degree of operating leverage for the Base case was 2.90 (10% × 2.90).
Keep in mind that Variable costs would increase at the same percentage as Sales – as is their nature.
The flip side is also true. A 10% decrease in Sales and Variable costs means a 29% drop in Operating profit (-10% × 2.90).
Note that the Breakeven Sales amount doesn’t change in either scenario. This is because Fixed costs didn’t change.
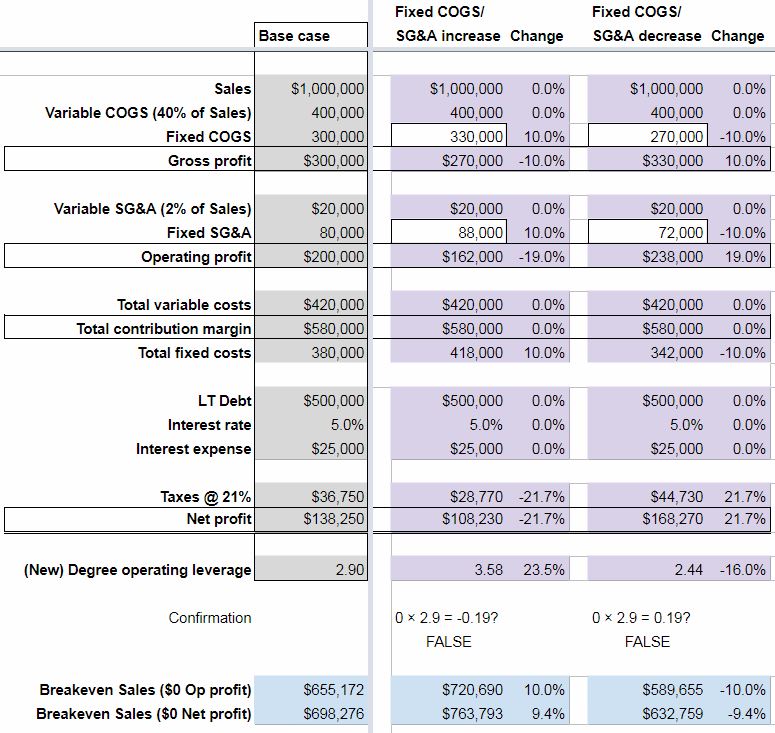
A change in fixed costs and the effect on a company’s financials
“Why would fixed costs change?” you might ask. “They’re fixed,” you say.
Well, in theory, they don’t. But in practice, they might.
First, not many costs are 100% fixed or variable. It’s a sliding scale. Over a long enough timeline, all costs are variable they say.
Also, Fixed costs are often tied to fixed assets. Fixed assets are acquired and disposed of over the years. Salaries, which can comprise a lot of Fixed costs too, fluctuate with the hiring and loss of employees.
So, as you can see, it’s not much of a stretch for Fixed costs to change.
When they do, we can see that a 10% increase in Fixed costs translates into a 19% decrease in Operating profit. Not at all what we would expect from our Confirmation equation. 0% × 2.90 = 0%! Operating profit shouldn’t change!
But in this hypothetical example, it did. And, in real life, it could.
Of course, the opposite was true too. A 10% decrease in Fixed costs meant a 19% increase in Operating profit.
Notice, too, that a change in Fixed costs meant a change in the opposite direction for the Breakeven Sales amount. Not surprisingly.
What will the degree of operating leverage tell you about your company?
Don’t forget, you can get insight into the degree of operating leverage for your own business by accessing the accompanying spreadsheet for this post. Just enter your information in the white cells on the Your degree of operating leverage worksheet.
Fill out the form at the top of this post ↑ for quick, easy, free access.
What are your thoughts on the use of operating leverage vs financial leverage?
What is your degree of operating leverage and would you like to increase or decrease fixed costs?
Financial leverage is simply the act of borrowing money to invest. This is done with the hope of earning a return on that money. A return that is greater than the cost. Often, the potential for gain is disproportionately bigger than the cost. But, the cost is fixed and will be the same regardless of the return earned. Small businesses must learn how to effectively manage their degree of financial leverage. Otherwise, they could find themselves buried under the weight of repayment.
Let’s talk about some of the advantages and disadvantages of financial leverage. Also, how the degree of financial leverage ratio can provide insight into net income.
Download your copy of the workbook used in this post
Complete the form below. Upon email confirmation, the workbook will open in a new tab.
Financial leverage advantages
Financial leverage is a strategy that can be employed to boost gains. The cost of borrowed money (typically) doesn’t change. So, if that money can be used in a way that earns returns beyond the cost of borrowing – a small business can end up way better off than it would have otherwise.
I always say that every investment comes down to three things – cash in, cash out, and time. If the cost of leverage (cash out) is low enough and the terms are favorable (time), then the cash in has the best opportunity to be big enough to make financial leverage worthwhile.
High financial leverage helps small businesses avoid dilution of earnings from the issuance of equity. It also gives them the ability to put more money to work than they would have otherwise. Both of these advantages can translate into excess returns.
Additionally, interest is tax-deductible. This lessens the tax burden that a company would realize if the same funds were raised through equity. Keep in mind that interest is a fixed cost. A fixed cost that can negatively affect a small business if operating profits aren’t high enough.
Financial leverage is a better fit for some businesses than others
On my sister site, I’ve written often about the benefits of certain business models. For businesses with the right business model, more financial leverage could be very beneficial. This is if it brings in more long-term customers. These business models are conducive to earning a good ROI on borrowed money.
Handling debt responsibly = the ability to borrow more in the future
If a small business effectively employs financial leverage, their creditworthiness improves. With improved creditworthiness, they will (likely) be able to borrow more in the future. If they continue to execute effectively, they can earn compounded returns.
The cost of borrowing (rate) could drop with a successful history of repayment. This could decrease the cost of future financial leverage. Lower cost should mean lower risk. Lower risk increases the likelihood of employing it in a successful manner.
Financial leverage disadvantages
Just as it has the potential to boost gains, financial leverage can also boost losses. Every dollar borrowed represents a little more risk. Again, that’s why the return from the borrowed monies means so much.
But, the lender doesn’t care if your small business makes 10x the cost of borrowing. Or, if it “only” makes 100% of the cost of borrowing. It expects its money back, plus interest, either way.
Borrowing money will increase your cash flow out. If the cash flow in isn’t enough to offset that, then, sooner or later, insolvency will ensue.
It all depends on the context
A lot of the negative stigma surrounding borrowing stems from the personal sector. In the personal sector, when people borrow, they often do so to buy consumer goods. Things that don’t earn any sort of return. These items actually depreciate in value. For example, cars and technology.
Nobody flinches when somebody borrows an ungodly sum of money to buy a house. This is because a house (for better or worse) is expected to increase in value.
Just as certain business models are conducive to financial leverage, others are not. Consider business models that sell time for money or one-time purchase items. These businesses will have to be confident in their financial modeling to ensure that they can earn an adequate ROI on financial leverage.
Finally, the perception of leverage depends on timing. During boom times, the companies borrowing look like geniuses. Conversely, if the economy turns against a business that has irresponsibly borrowed, then they could look foolish.
Financial leverage + operating leverage?
There are two general types of leverage that a small business can use. Operational leverage (which I plan to write about next) and financial leverage. The degree of operating leverage measures the effect of fixed costs (not interest) on operating income.
Beware compounding leverage by adding operating (fixed costs) to financial, or vice versa. This could sneak up on a small business. It could create a situation where management is caught unprepared. The result is potentially catastrophic. It’s important that scenarios like this be modeled out and planned for.
Most people understand the risks associated with borrowing money (financial leverage). The risks of operating leverage are a little more camouflaged.
Make sure you plan around your company’s (potential) total leverage situation. Annual strategic planning with an operating budget allows you to do just that.
Regulatory authorities might paint an overly rosy picture
When interest rates are kept low, the hurdle rate (minimum ROI to justify investment) is also lower. This incentivizes small businesses to take on projects that they might not otherwise. Less is demanded of investments. The pursuit of extraordinary returns might stop short in favor of quick-and-easy (but “good enough”) returns.
Also, by making interest tax-deductible, the effective cost of leverage is lowered even further. This further incentivizes small businesses to use financial leverage. Doing so could amplify any of the previously mentioned disadvantages.
Financial leverage example
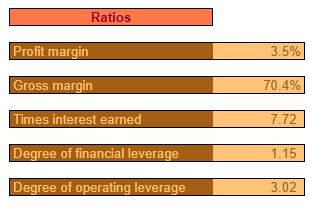
The Degree of Financial Leverage shows the amplification that borrowing money can provide to profits and losses. So, for instance, in the example operating budget, the Degree of Financial Leverage is 1.4. This means, at this level of borrowing, that for every 10% change in Operating Profit, Net profit would increase by 14% (10% × 1.4).
That sounds great, but the opposite is also true. If Operating Profit declined by 10%, then this level of borrowing would cause Net profit to decrease by 14%. That’s the nature of leverage. It amplifies gains and losses.
I created a spreadsheet to model the changes in profit due to changes in other line items. It helps to better understand how the income statement is affected by financial leverage,
I started with a Base case income statement for a small business that has $1 million in sales. This example business also has a 20% operating margin with $500K in debt at a 5% Interest rate. Its Net profit is approximately $138K.
This company’s Degree of financial leverage is 1.14 ($200,000 ÷ [$200,000 – $25,000]).
Only one variable was changed at a time. Here’s what I found:
The effects of an increase or decrease in sales
A 10% increase in Sales translates into a 50% increase in Operating profit – all other things being equal. As expected, this 50% increase in Operating profit translates into a 57.1% increase in Net profit. This is because the Degree of financial leverage is 1.14 (50.0% × 1.14 = 57.1%).
The same thing happens, in the opposite direction. When Sales drop by 10%, Operating profit decreases by 50%. Net profit drops by 57.1%.
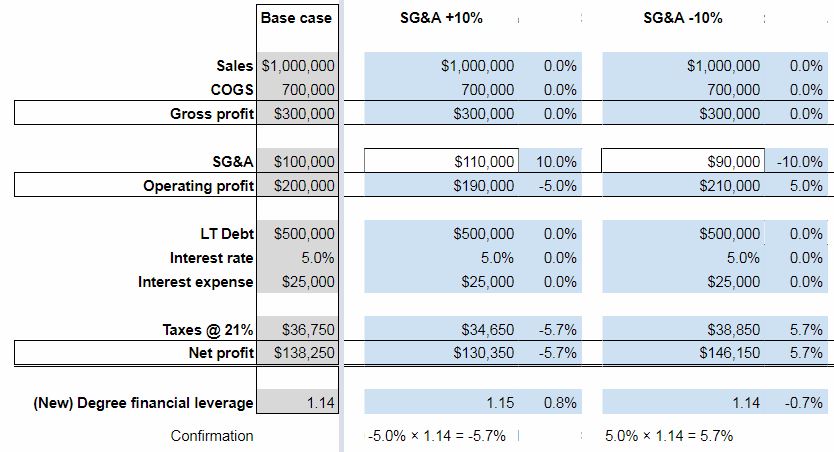
The effects of an increase or decrease in COGS and SG&A expenses
Since COGS is less than Sales, a 10% change doesn’t have as big of an effect on Operating profit. The result is a drop in Operating profit of 35%. As expected, the resulting change in Net profit is -40% (-35.0% × 1.14 = -40.0%).
SG&A expenses, being even lower, have less of an impact on Operating profit. A 10% increase only lowers Operating profit by 5% and Net profit by 5.7% (-5.0% × 1.14 = -5.7%).
Of course, things work the same in the opposite direction. A -10% change in COGS increases Operating profit by 35% and Net profit by 40%. A -10% change in SG&A expenses increases Operating profit by 5% and Net profit by 5.7%.
The effects of an increase or decrease in Long-term Debt & Interest rates
As shown above, changes in the income statement that result in increases to Operating profit are amplified in Net profit by the Degree of financial leverage.
But, what about changes below Operating profit? As expected, a 10% change in either the amount of LT Debt or the Interest rate, results in a corresponding 10% change in Interest expense.
This hypothetical small business carries a sizable amount of LT Debt. Still, Interest expense is still a relatively immaterial expense. Thus, the effect of a change in LT Debt and Interest rates is only ±1.4% on Net profit.
Click to enlarge
Going forward with a new Degree of financial leverage
Because of the nature of the Degree of financial leverage calculation (Operating profit ÷ [Operating profit – Interest expense]), when Operating profit increases, the Degree of financial leverage decreases – all other things being equal. The opposite is, of course, true too.
What does this mean?
It means that if your small business increases Operating profit this year, then your Degree of financial leverage is going to go down for next year. Which isn’t catastrophic. But, it means that a similar gain in Operating profit next year won’t translate into the same boost in Net profit.
To get that, your small business would have to borrow more funds.
On the same token, if your company has a decrease in Operating profit this year, then your Degree of financial leverage will increase for next year. This increase will amplify the effects of a gain in Operating profit next year. But, it doesn’t necessarily mean that you’ll end up ahead of where you would have been if you would have increased Operating profit in year 1.
Shortcomings of the Degree of financial leverage ratio
Again, the Degree of financial leverage ratio is calculated as follows:
Big companies typically borrow money through the issuance of bonds. This means that they only pay interest until the bond matures.
Small businesses, like yours, don’t issue bonds. The nature of borrowing can vary, but often, loans are repaid on an installment basis. E.g. payments consist of both principal and interest.
So, a ratio that only measures the effects of Interest expense doesn’t completely capture the impact of financial leverage. For small businesses anyways.
Two extreme examples
First, consider a small business that borrowed 10x their previous year’s revenue. If they did so at a very low interest rate, their Degree of financial leverage would also be relatively low. But, having borrowed a disproportionate amount of money, they would theoretically have the opportunity to boost Sales/Operating profit greatly.
Also, consider the other extreme. What if a company borrowed a very modest amount of money? But, was forced to pay an exorbitant interest rate? In this instance, the Degree of financial leverage would be relatively high. But, the company’s opportunity to use this leverage in a beneficial manner is limited.
Finally, in order for the Degree of financial leverage to accurately predict the change in Net profit, Taxes must remain at a constant percentage. E.g. they can’t be 21% of Operating profit – Interest expense (EBT) one year and 22% the next. The Forecasted Change in Net profit won’t equal what’s calculated in the Confirmation.
The amount of LT Debt and the Interest rate/expense must also remain constant for the “Operating profit × Degree of financial leverage = Change in Net profit” equation to work out.
So, obviously, the Degree of financial leverage has limitations. It is designed for big businesses – not necessarily small ones. It is based on amounts in the income statement, and not the cash flow statement. Thus, no consideration is taken for the effects of principal repayment.
If its limitations are kept in mind, and if reasonable changes are forecasted, then it can provide guidance on the potential benefits or detriments of financial leverage.
How financial leverage affects business decisions
Plug your small business’ information into the Your degree of financial leverage worksheet. It will help you better understand how your borrowing might help or hinder you in the coming year.
Financial leverage, in and of itself, is neither good nor bad. It’s all about how it’s employed. If it’s used to buy (rather than sell) consumable assets that provide little or no return – it’s wasted. If it’s allocated to resources that increase productivity (or earn extraordinary returns) – it’s a valuable tool for small businesses.
What are your thoughts on the use of financial leverage?
What are some of the advantages and disadvantages I neglected to include?
How about some ways that you’ve effectively employed financial leverage in your small business?
00:00 I’m gonna go over how to go about making 00:04 operating budget for your church some of 00:06 my previous videos you know I’ve done a 00:08 little more in depth with the individual 00:10 spreadsheets and how you know what each 00:12 field is about how its calculating 00:14 everything this time I’m going to try 00:16 something different I’m gonna stick to 00:18 kind of summarizing here and I’m gonna 00:19 put a link down in the description where 00:21 you can read the whole in-depth post 00:24 that covers every single aspect you know 00:27 in detail of the operating budget for 00:30 your church and the video here is just 00:32 gonna be kind of a summary so that being 00:34 said let’s get into it 00:36 we’ll start off here with a ordinarily 00:41 with a for-profit company you always 00:44 start with a revenue budget with the 00:45 church you have a little flexibility 00:47 there you start with a revenue budget or 00:48 with your expense budget so for the sake 00:52 of simplicity I’m going to walk through 00:54 this starting with the revenue budget 00:55 but you know it really is a matter of 00:59 private preference do to kind of 01:01 churches unique situations so revenue 01:04 budget is exactly what it sounds like 01:06 it’s a budget in a forecast for all of 01:08 the money you’re gonna bring in for the 01:10 year so in this case we’ve got the 01:13 different sources listed here offerings 01:15 donations facility whose charges trust 01:18 investments and other okay and we reject 01:21 them out for every month for the coming 01:23 year but the first month of our planning 01:25 period here so if you’re planning 01:27 creative begins in July or September or 01:29 whatever some other month with that in 01:32 there it’ll automatically populate it 01:33 out and all the forecasted amounts are 01:38 total by month and total by source also 01:42 point out real quick that all 01:44 spreadsheets for business templates 01:46 which there’ll be a link to the template 01:49 in the link to the post so you get that 01:53 by going to the post but all 01:56 spreadsheets for business workbooks the 02:00 white cells are adjustable okay the 02:02 colored in cells or other formulas or 02:03 their text so unless you really really 02:05 know what you’re doing don’t touch those 02:07 so revenue budget is pretty simple and 02:11 we’ll move on to the expense budgets now 02:16 let me get rid of the fixed cells here 02:21 there’s separate expense budgets for 02:25 each of the four kind of broad 02:26 categories of expenses the inspiration 02:29 for these categories comes from Bree mal 02:31 FERS if you’ve done any searching on 02:33 YouTube or on the web in regards to 02:36 Church strategic planning you’ve come 02:37 across 02:38 Audrey’s work and he’s does a great job 02:42 and you know definitely a good source of 02:47 information I’ve never seen him put 02:48 forth anything like this not to say that 02:50 he hasn’t that I used a lot of his 02:54 inspiration in creating this template 02:57 for budgeting so now he breaks it church 03:02 expenses into four broad categories 03:04 evangelism emissions personnel 03:06 ministries and facilities so as you can 03:09 sing along the bottom here that’s 03:10 exactly what we’ve done 03:12 each of these four budgets is formatted 03:15 in the same manner so for simplicity 03:17 sake we’ll just look at the evangelism 03:21 and missions budget here so what you got 03:26 at the top here is you know basically 03:29 when it would take those broad 03:30 categories expenses and break them down 03:31 into subcategories so do that first and 03:35 foremost for the evangelism missions 03:36 here and direct and Synod support 03:39 Convention Assessment local mission work 03:40 outreach etc of course each broad 03:44 category has its own separate sub 03:48 categories you came and you’ll notice 03:52 also you’ll have to fill those in 03:54 manually and also you’ll notice that 03:56 each bra subcategory of expenses gets 04:03 category wrap categorized as fixed or 04:06 variable and simply put the post goes in 04:11 a little more detail but you know fixed 04:14 is gonna be the same no matter your 04:16 level of revenue a more revenue less 04:19 revenue you would expect this expense to 04:21 stay the same 04:22 variable on the other hand you would 04:24 expect to increase with revenue and 04:25 decrease increase in decrease with 04:28 revenue less revenue less expense more 04:29 revenue more expense okay so you’ll see 04:32 that all these amounts are filled in 04:34 here a lot of them with zeros because 04:36 there’s a room for plenty of 04:38 subcategories well where’s that 04:39 information come it comes from down here 04:41 below this is where you get into the 04:42 detail okay so you’ll notice each sub 04:45 categories listed here and you can 04:47 detail expenses and this is where you 04:48 actually put in the inmense so you know 04:51 you take a broad category of expenses 04:53 break it down to subcategories break it 04:55 down further into details you know 04:58 depending on the sophistication of your 05:00 accounting software or your accountant 05:04 you know this could be these detailed 05:06 expenses here could be individual GL 05:08 accounts or whatever you want them to be 05:11 but as long as you address all expenses 05:14 that’s all that really matters it’s just 05:16 like I said kind of breaking things down 05:18 here into manageable chunks to where you 05:22 can forecast them out for every month in 05:26 the planning period then they’ll total 05:29 here and those totals will carry up here 05:32 okay so you’ll see like I said every 05:36 subcategory of expenses listed here with 05:39 plenty of room to entered detailed 05:42 expenses okay so you do that for 05:45 evangelism and admission you do that for 05:50 personnel do it for ministries it’s all 05:55 them all the same same format do it for 05:58 facilities so okay you better you expect 06:01 the revenue for the year then you 06:03 entered your expected expenses for the 06:07 year don’t forget like in this example 06:09 real quick here you’ll notice this ties 06:13 into the capital budgeting work that we 06:18 did – I like to make my workbooks tie 06:22 into each other so it can paint the 06:24 entire picture for you guys so that’s 06:26 what this means you know most of these 06:28 are Justin Eric detailed expenses but 06:30 this one here talks about snow removal 06:32 and it has to do with the 06:34 creation of a new parking lot that we 06:36 looked at in the capital budget so check 06:38 that video out to check that post out to 06:41 so and yeah once all expenses are 06:46 entered then that’s the biggest part of 06:51 budgeting okay all that’s going to carry 06:54 over here into your pro forma income 06:56 statement where you’ve got your total 06:58 revenue your total for each expense by 07:02 broad category okay and then we threw in 07:05 a percentage amount here 07:08 that’s a percentage of revenue if I 07:11 remember right yes it is okay just just 07:15 kind of paint the picture of what 07:18 categories are contributing most to your 07:20 expenses then we’ve got operating profit 07:23 which is revenue minus expenses one 07:27 other thing you have to fill in I mean 07:28 pro forma income statement here that 07:30 isn’t really covered elsewhere in the 07:31 operating budget is interest income in 07:35 interest expense okay so this is a will 07:39 have to be a forecast you’ll just have 07:41 to look at you know for income if you 07:44 have income earning assets savings you 07:49 know money market accounts something 07:52 that maybe earns a little more than that 07:54 dividends perhaps enter now here 07:57 interest expense it’s gonna depend in 07:58 large part on the amount you need to 08:00 borrow a lot of that will be covered in 08:02 the financial budget okay but you know 08:05 you can go ahead and do your financial 08:08 budget which I’ll cover in a later video 08:09 and a post that’s coming soon and circle 08:13 back around enter that information here 08:14 too okay you’re not gonna be graded on 08:18 your accuracy in terms of forecasting 08:20 this can be a living document come back 08:21 and change it as you need to 08:23 all right so operating profit minus 08:25 these interest expenses churches don’t 08:27 pay taxes so there’s net profit okay 08:32 there’s a couple of simple ratios left 08:34 in here that are applicable for churches 08:38 okay got profit margin which is pretty 08:39 self-explanatory you know your net 08:42 profit compared to you net sales times 08:44 interest earned looks at those 08:46 looks at interest expense and operating 08:50 profit how it relates to it degree of 08:53 financial leverage again the post will 08:54 get into more detail in degree of 08:56 operating leverage we’ll get more detail 08:58 on that too those are two interesting 09:00 concepts that basically tell you what 09:07 the based on degree of financial 09:10 leverage based on the amount of money 09:14 you borrow what effect increasing and 09:20 decreasing 09:21 operating profit would have on that or 09:25 the rather the effect you’ll have to 09:29 read the posts to get a detail because 09:30 if I start talking about it I’ll go on 09:32 for an hour here and like I said and try 09:34 to make this summary so basically the 09:39 effect of degree of financial leverage 09:41 is the effect of interest expense on 09:45 profit degree of operating leverage is 09:47 the effect of fixed expenses fixed costs 09:52 on profit okay and that’s why I asked 09:56 you guys to specify whether costs are 09:59 fixed or variable here okay so that’s 10:01 what that was for read more about that 10:03 like I said you’ve got the chart down 10:06 here pretty straightforward just an 10:08 illustration of what happens month by 10:10 month based off of your forecast you’ve 10:12 got the Green Line is revenue and then 10:15 you’ve got your different categories of 10:16 expenses here you can see how they rise 10:18 and fall in total and by categories so 10:22 one little extra bonus that I like to 10:26 add to my industry specific spreadsheets 10:29 is this likely best case worst case 10:33 scenario okay I think this is super 10:36 valuable you know and it’s it is another 10:39 step and the whole strategic planning 10:43 thing which is time-consuming in that 10:44 bed really is just the like I said the 10:50 plus one however you want to put it to 10:53 to the operating budget this is where 10:56 you know you’ve done you’ve been in put 10:58 your 10:59 expected revenue cost profit etc now you 11:02 get to toy with what the worst case 11:04 would be in the best case would be and 11:06 this just like most of strategic 11:08 planning 11:09 just get your mind working in that 11:10 direction so you’re you’re completely 11:14 comprehensively prepared for the 11:15 upcoming year okay so it starts off here 11:19 with the pro forma income statement 11:26 that’s what this is sure if it Proform 11:28 in there but yeah it’s a pro forma 11:31 income statement or rather this yeah 11:35 sorry okay so this is revenue up here 11:37 where you can toy with best cased amount 11:40 for each revenue source 11:45 worst case amount or you can just use a 11:48 generic multiplier okay so basically 11:52 what that means it’s like if I change 11:53 this worst case is gonna be negative in 11:55 the case of revenue the 15% you’re gonna 11:59 see these worst case amounts decrease 12:03 okay because I made the worst excuse me 12:08 in the worst case that much worse 12:10 okay but you have so you can change that 12:15 there it will affect everything in that 12:17 section but you also have the ability to 12:20 override it okay so see if we delete 12:25 this worst case would be 38,000 versus 12:31 42,000 for trust investments in the 12:34 quest but you know say you think no no 12:38 worst case could be worse than that or 12:40 worst case wouldn’t be quite as bad well 12:43 then you just override that amount okay 12:46 everything else is based off of this 12:48 multiplier but now you’ve overwritten it 12:51 with an amount so same same principle in 12:55 the best case I’d come down here to 12:58 expenses we have our abroad expense 13:00 categories again use a multiplier this 13:04 is just a ballpark figure the multiplier 13:06 basically if you know best-case in the 13:10 Fuhrer expects is going to be the 13:11 decrease 13:12 worst case for expenses gonna be the day 13:15 increase and I keep doing it 13:17 so keep that in mind and you can 13:20 override you don’t like what you see so 13:22 yeah just toy with it you know that’s 13:25 the whole point of this exercise just 13:28 toy with it see what playing with 13:32 different scenarios gives you what it 13:35 makes you think about what you might do 13:37 to plan to avoid a worst case what you 13:39 what planning you might do to take 13:41 advantage of the best case okay so just 13:44 like the pro forma income statement on 13:45 this executive summary 13:47 you got your operating profit here you 13:50 can see negative under worst case this 13:54 will match what’s on the executive 13:55 summary the ten thousand twenty eight 13:58 operating profit and best case 14:05 considerably better six times the 14:07 operating profit so that’s pretty good 14:10 it brings in interest income and expense 14:14 here also and then that profit always 14:20 calculated the exact same as it is on 14:21 the executive summary so then of course 14:25 the you know the whole purpose of ratios 14:26 is to kind of put amounts into 14:31 perspective from your financial 14:34 statements and the same thing takes 14:36 place here you know profit margin can 14:38 range from negative seventeen point 14:41 eight to twenty seven positive twenty 14:43 seven point two times interest earned 14:45 degree of financial leverage is going to 14:48 change all that it’s gonna going to 14:50 change based off of what you enter in 14:52 the best case in worst case fields above 14:57 some anyhow that’s quick rundown of the 15:01 church operating budget template you 15:04 know go get your own copy to toy with I 15:06 get his follow the link and there’ll be 15:10 a links on there follow a link to the 15:13 post there’ll be links on there to 15:14 download your own copy of it and then 15:16 you know you if you’re dealing with 15:18 concepts you’re not familiar with just 15:20 check out the post I’ve got more or less 15:22 every single field on here 15:24 addressed in there and you know if you 15:28 get stuck on something just check that 15:30 out and it’ll help you make sense what 15:33 you’re looking at so appreciate you 15:35 guys’s time appreciate you watching this 15:39 video if you have until this point the 15:41 very end YouTube it is a popularity 15:45 contest just like anything on the 15:47 Internet and if you like this video if 15:50 you think this seems like something 15:51 useful to you best way to let me know is 15:55 to either leave a comment down below or 16:00 better yet maybe I don’t know depends on 16:03 the YouTube algorithm comments are good 16:06 likes or good subscriptions are good I 16:08 know 16:10 alerts are good any of that stuff you 16:13 know I’ll feedbacks good I’ll crank out 16:16 more content there’s also a lot of stuff 16:19 to check out not just for churches but 16:22 for small businesses in general on 16:23 spreadsheets for business comm thanks 16:26 you guys take care