
Cash inflow and other positive outcomes
It tends to be the nature of cash flows that they flow out via many more avenues than they flow in. So, you probably won’t have to rack your brain as hard in regards to where the cash will flow in from.
Will there be hidden project cost savings?
If this project will save your church money then we want to include that in the analysis too. How might a project save money? For ideas, we just look at the list of potential expenses above and flip them on their heads:
- Lower utility bills
- Automation that lessens the need for staff
- Less maintenance or insurance needed
- Additional revenue that lessens the need for borrowed money and saves on interest
As you might expect – thoroughness and conservatism are the name of the game here.
Start out in the Future CF Worksheet and think about every way this project could help your church save money. When you’re satisfied in that respect, enter the yearly values (positive numbers) in the Additional cost savings column on the Data Entry worksheet.
Project cost savings – church parking lot
As shown in the screenshot above – the only cost savings that could be ascertained is that landscaping is no longer necessary. A 52-spot parking lot would take up approximately 15,000 sqft. With less square footage to mow and maintain, the landscaping costs should go down by about $900 in Year 01 and those savings should compound at an annual rate of 2% going forward.
Additional project revenue and proxies for revenue
If your project will bring in real revenue through increased membership, increased contributions, or some other means, then forecasting the amounts and timing of those cash inflows is fairly straightforward. Just remember to err on the conservative side. Plan for the worst and hope for the best.
Capital budgeting for churches is not always straightforward, though.
Firstly, they are not-for-profit. So, the prospect of having more cash flow in the door is good, but it’s not necessarily the driving force behind everything they do.
For-profit businesses might take on non-revenue generating projects, but at the end of the day, they do so because it will support an aspect of the business that will drive profits. For example, projects for the benefit of human resources, quality control, or information technology (IT) – what are known as “cost centers” in the business world.
With churches, direct or even indirect increases in revenue might not necessarily be in store. It’s possible that a project might have the potential to bring in additional contributions, but it might just as easily bring in no revenue at all.
This notion brings us to unique aspect number two – the benefits of a church project might be non-financial. A church project might do a lot of good in the world, but “good” is tough to quantify.
Therein lies the challenge of some church projects. Though they might be tough to assign a financial value to, it has to be done. These tools are designed for dollar inputs and outputs.
How do you assign a dollar amount to something potentially priceless?
First of all, know that there is no answer that is black and white, right or wrong here. This is an extremely subjective exercise.
Here’s a thought exercise to help you assign a cash value to non-cash benefits.
Think about what you would pay to be able to snap your fingers and have the project done. For instance, if your church were planning an extensive (and expensive) years-long outreach program – what would you pay to see those benefits realized?
What would it be worth to you, if you had the money? Think about what would you pay year 1 to see the year 1 benefits realized. What would you pay year 2 to see the year 2 benefits realized? And so on…
This will give you an idea of what the “market value” of these benefits are.
Project revenue – church parking log
52 new parking spots, once filled, should bring in 52 new families to the church. 52 new families should mean increased contributions.
“If you build it, they will come.” That might be true. But, they won’t come overnight.
So, in the example, we assumed that the increased parking capacity would facilitate the addition of 17 (1/3 of 52) or so new families in Year 01. Each new family was expected to contribute, on average, $800 per year.
Additionally, it is expected that the increased capacity will continue to facilitate the addition of new members until all of those new spots are utilized. At which point, contributions (attributed to this project) will level off and only grow at the 2% inflation rate.
Inputs are done – time to analyze the output
Yikes.
We’ve used a lot of “business speak,” and there’s more to come.
Get used to it. This site is called Spreadsheets for Business after all.
It’s okay – I’ll walk you through it.
Net present value (NPV)
This is probably the most important piece of information to be gleaned from all the information you input on the Data Entry worksheet.
The first thing to look for in an NPV amount is – is it positive? If so, that’s good. That means that your church will come out ahead from undertaking this project (assuming all your inputs and forecasts were right!). Also, the higher the number the better.
What does this number really mean though? Technically speaking it is the value of the project’s future cash flows discounted back to the present.
The time value of money
Let’s break it down a little further.
$100 cash today is worth more than $100 a year from now. You probably know this instinctually.
But why is it worth more? There are several reasons.
First of all, due to inflation, $100 will buy you more now than it will a year from now. Also, you could potentially invest this $100 in a hot stock and cash out with $125 a year from now. If you didn’t get that $100 for 365 days you’d miss out on that opportunity. That’s called an “opportunity cost,” and it’s a very real thing.
Okay, so maybe it’s a long shot that’ you’d find a hot stock to invest in. Nevertheless, that $100 could pay for a part of a salary, it could support an outreach program, it could help keep the A/C running when it’s 100° outside. The bottom line is – it’s worth more now than it would be in the future. Remember my cash in, cash out, and time spiel?
This is where the hurdle rate (also known as the discount rate) comes in. Let’s say your hurdle rate is 5%. This means that, if given a choice between $95.24 today, and $100 a year from now – you should be indifferent. If you’re not, then you’re using the wrong hurdle rate. Why? Because at a 5% discount rate, that $95.24 today is worth the same as $100 a year from now.
Hopefully, all of that makes a bit of sense. The bottom line is that the NPV is the value of all the expected future cash flows as of right now.
Is a higher NPV better?
If you’re starting to get a grasp on what NPV is all about then you probably know the answer to this.
Yes, all things being equal, a higher NPV is better than a lower one. Because remember, the NPV is what the project is worth to you right now.
A project with an NPV of $50,000 is better than one with an NPV of $10,000 is better than one with an NPV of $1,000.
So, making your church (and yourself) rich is as easy as finding a project with an NPV of $1 billion, right? Well, sure…in theory. Those types of projects exist, but, due to the amount of the cash outflows needed to generate the cash inflows, most people and organizations can’t afford to undertake them.
Internal rate of return (IRR)
The IRR tells a similar story to the NPV, but from a different point of view.
The technical definition of the IRR is the hurdle rate that would make the NPV $0. So, what’s that mean?
The IRR is completely contingent on your cash inflows and outflows. It tells you the rate of return you’ll receive if those forecasts end up being accurate. Changing your cashflow forecasts (including the variables such as Cost of new asset(s), Useful life of new assets(s) in years, and so on..) will change your IRR. Changing your discount rate will affect your NPV, but not your IRR.
If the IRR is higher than your hurdle rate your NPV will be positive. If the IRR is below your hurdle rate, then the NPV for the project will be negative. Why’s that? Because remember, the IRR is the discount rate that would make the NPV $0.
Try it in the worksheet. Change the Hurdle rate to the IRR percentage. NPV should be near $0. It might not be exactly $0, because the IRR is rounded to the nearest .1%.
Payback period
NPV and IRR are the cornerstones of church capital budgeting.
There are other metrics that are worthwhile knowing too. One simple metric is the payback period.
Unlike NPV and IRR, the payback period doesn’t discount cash flows back to the present. It simply looks at the forecasted Net cash flow and calculates when the organization will recoup its initial investment.
For instance, if the initial cost of a project was -$500 and the forecasted cash inflow was $100 per year, the payback period would be 5 years ($500 ÷ $100 per year).
Because the payback period doesn’t take the time value of money into consideration and because it doesn’t take any cash flows into consideration beyond the payback period – it is not a sufficient metric to base decisions off of. It is merely supplemental to the other outputs. It’s for informational purposes only.
The payback period could possibly serve as a tie-breaker if two projects had similar outputs. Obviously, getting your initial investment back sooner is better. Just be mindful of the payback period’s shortcomings and do not rely upon it as your sole decision-making tool.
Profitability index (PI)
The final piece of output is the profitability index.
Unlike the payback period, the profitability index does factor in the time value of money. In light of this – the hurdle rate does affect the profitability index. The profitability index is calculated by dividing the present value of all future cash flows by the initial investment amount. It tells you how much NPV you get per dollar of the initial investment.
For instance, if the present value of all future cash flows was $20,000 and the initial investment was -$10,000 the profitability index would be 2.0. The NPV would be $10,000 in this case.
The profitability index serves as a qualifier to the NPV figure.
What does that mean? It means that it’s potentially more important than the NPV figure. “But wait, I thought NPV was the most important metric when selecting church projects?”
Well…it is, usually.
Is NPV or PI more important?
Let’s look at our previous example:
The initial investment was -$10,000 and the PI was 2.0 (discounted future cash flows of $20,000). What if the initial investment amount had been -$20,000 and the discounted future cash flows had been $35,000? The NPV is $15,000 in this instance – higher than the other project ($10,000). The PI, however, is less at 1.75 ($35,000 ÷ $20,000).
So, which is the better project, if you had to choose one? One provides a bigger cash flow reward ($35,000 vs $20,000, or 75% more), but you have to risk disproportionately more (-$20,000 vs $ -10,000, or 100% more). One offers a bigger return in dollars, but the offer offers a better return in percentage terms.
I suppose the answer to this question is subject to debate. Personally, I’m more partial to a bigger percentage return. – all other things being equal. There’s a definitive answer to this question, but the answer involves a lot more variables and, frankly, is beyond the scope of this article.
Let’s leave it at this – both projects are good choices. If your church could afford to do both – they should. If you chose the project with the higher absolute cash flow, you’ll probably be alright. Picking between these two projects is a good problem to have!
Net present value, internal rate of return, payback period, and profitability index – church parking lot
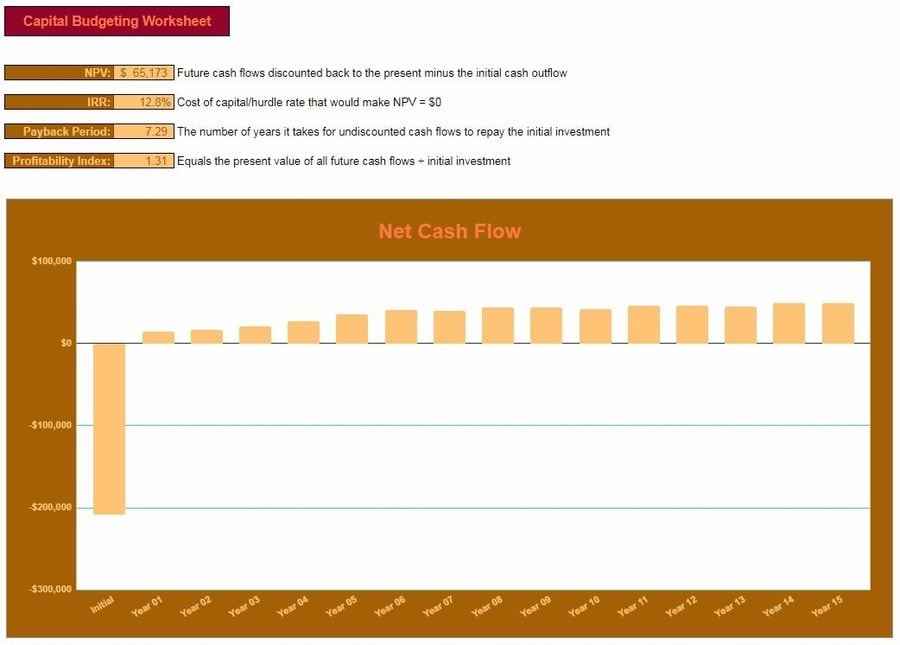
Based on all of the inputs entered earlier, the NPV of the parking lot is expected to be $65, 173! Very good!
If church membership continues to grow as expected and if costs don’t spiral out of control, this should be a very beneficial project for our example church to undertake.
The IRR is 12.8% – well above our hurdle rate of 8.8%. This means we have some wiggle room. If our cash flow forecasts are wrong (and they always are), then the church should still see a net benefit to adding the parking lot. This helps to put minds at ease who might have reservations about the perceived riskiness of a project such as this.
The payback period is roughly 7 years and 4 months. Nearly halfway through the 15 life of the project. That’s a long time. But it takes a few years to reap the real benefits of some projects. That’s why planning such as this is important. The good thing is – since the church plans on maintaining the parking lot properly, it should certainly last well beyond 7 years and 4 months.
Finally, the PI is 1.31. In our example, we don’t have any other projects to compare that to. In essence, what it means is that the example church will get a 30% return on their investment – even after future cash flows are discounted back to the present value. That’s not bad. It’s certainly better than putting that money in a savings account!
If we were truly conservative in our forecasting, then the odds should be in our favor and this parking lot project should help the example church be financially healthy for years to come.
Deciding which projects to implement
The most pressing constraint, when deciding which projects to move forward with, is not the NPV, IRR, payback period, PI, or even the mission statement.
It’s the amount of money available for initial cash outflows.
Remember when I said that a $1 billion NPV project is possible – if you have enough cash to support it? Your church probably doesn’t have that much cash available, though. So, none of these other metrics matter if you don’t have the resources to pull the project off.
Okay, so assuming that your church is only considering projects which are practical, the next thing I would look at is NPV. If the NPV is negative – it’s a no-go.
A reminder about non-financial benefits
“But…the benefits of this project go beyond those that are merely financial.” That’s why we assigned a dollar value to these benefits earlier. The church capital budgeting worksheet only deals with numbers, so everything needs to be quantified.
If you’d like to go back and revisit your cash inflow and outflow forecasts, you certainly can. But if the value you’ve assigned to those benefits doesn’t translate into a positive NPV, it’s difficult to justify why you should move forward with the project. The costs simply outweigh the benefits. Even if the benefits transcend dollars.
Remember to qualify each NPV amount with its corresponding PI number. A big NPV is great, but if the PI is low it means that the forecasted NPV comes at a disproportionately high cost.
Higher costs mean higher risks. That doesn’t mean to pick projects solely on the PI number. It means to be sure to factor it into your decision making.
If the NPV and PI are good, take a look at the IRR. If the NPV is positive, the IRR will be higher than your discount (hurdle) rate. The higher the IRR, the better. A higher IRR gives you some margin of safety on your cash flow projections.
Finally, consider the payback period. A shorter payback period is always preferable. It means you get your initial investment back that much sooner. It means that you start reaping the benefits of the project that much sooner. Only after a potential project has satisfactorily met the other criteria, should you worry about the payback period.
What if you have a lot of viable projects?
This is a good problem. A lot of opportunities is better than no opportunities. Maybe you’ve got more options than you can take on? Well, some projects are just going to get passed over and/or pushed back to another year.
It’s hard to tell you how to choose which capital budgeting projects your church should take on without seeing a completed workbook.
As I mentioned before, though – when comparing projects, use the NPV and the PI as your guide. I think that a higher PI is more desirable unless the NPV of one project dwarfs another.
Be sure to look at all of the output in aggregate. It’s likely that the best projects will stand out.
If your church is having trouble prioritizing projects, then you might consider ranking them. Have each member of the church who has input on the matter assign a ranking from 1 – 10. Average out the rankings.
At the end of the day, with the church capital budgeting worksheet in-hand, you and the rest of the church management can make informed decisions that will help ensure that your precious funds are employed in the most appropriate manner possible.
Church capital budget
What are some other capital projects that a church might take on?
Also, hurdle rates have a huge effect on project desirability. What’s a good hurdle rate for a church?
Join the conversation on Twitter!