Small businesses and entrepreneurs use demand analysis to:
- Consider substitute products and services
- Get input from (potential) customers
- Determine what “drives” demand
- Understand what variables affect demand and to what degree
Demand analysis is about challenging your preconceived notions regarding your product/service. A stress test, if you will. A demand analysis will take your idea and start molding it into something that has even higher potential.
As an entrepreneur, you can’t be too stubborn. You have to be flexible. After going through this process, the hope is that you’ll come out the other end with an even more refined idea and a greater chance at success.
Market research and competitive analysis for a business plan
This is the second post on drafting a business plan for your startup. These posts are modeled after the SBA Business Guide.
Want to know how many people are included in your “customer avatar?” Read this post:
BUSINESS PLAN DEMOGRAPHICS – DEFINING A TARGET MARKET
Business plan demand analysis of the total market
When first thinking about the market for your product/service, don’t define it too narrowly. Try to think of substitutions that you might not have otherwise considered. No, you might not compete directly with these substitute products, but the presence of substitute products will have an impact on your pricing and demand.
Pricing too high could push customers to these substitute products. Even if that pricing seems in line with your value proposition when compared to direct competitors. But, theoretically, the amount demanded changes (inversely) with the price. A higher price will push customers to consider alternatives. A lower price should result in a higher volume sold.
Further defining the market for my product
As I mentioned in my first business plan post on the topic of demographics, I am working alongside you. I have a prospective product that I would like to explore the viability of, and I am creating a business plan for this product as I write these posts. As a reminder, my potential product is an all-natural hair-thickening topical supplement.
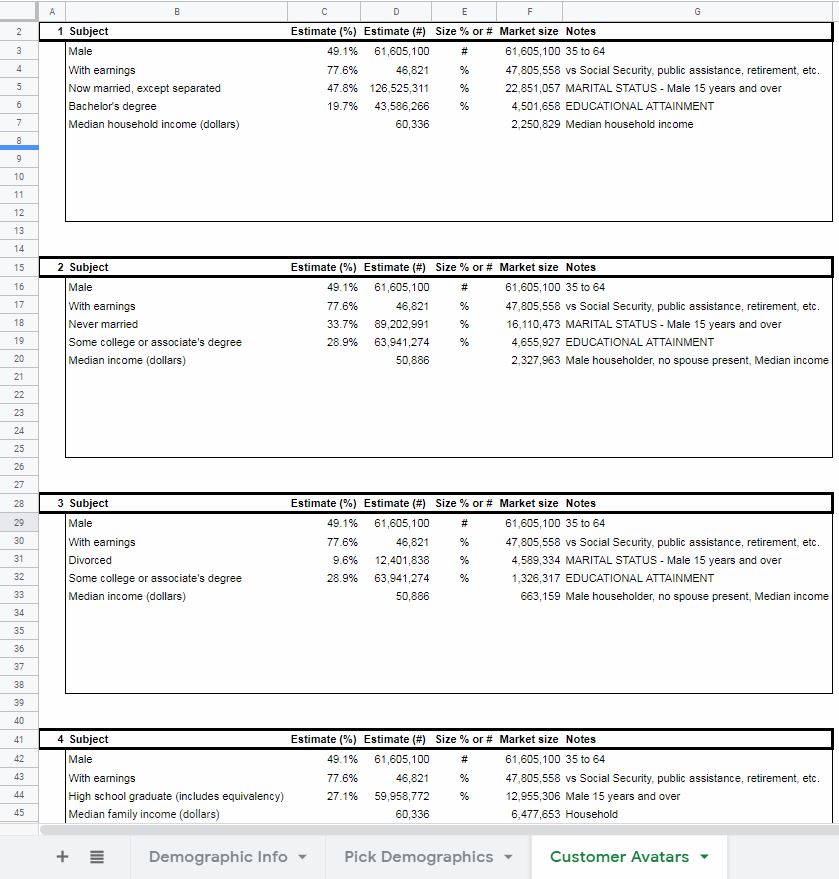
Anyhow, in the previous post, I used “customer avatars” to roughly ascertain the size of my market. I think I was fairly liberal in that estimation. The three of my avatars that were the most detailed totaled approximately 5.2 million people. The avatar that was broader included 6.5 million people.
Want to know what a top-down and bottom-up analysis would say about your market size? Read this post:
MARKET SIZE FOR A BUSINESS PLAN – 2 METHODS TO GAUGE IT
Substitute products
As mentioned above, I have to keep in mind that not all of these people will pursue hair loss treatment. Many, will just accept it as a normal part of aging. Others will choose to address the problem but will pursue an alternative treatment method to topical supplements. Some of these alternative treatment methods include:
- Oral supplements
- Biotin, vitamin D, Viviscal, Nutrafol, Finasteride (Propecia), collagen powder, nutriceuticals, Spironolactone (Aldactone)
- “Fake hair”
- Toupees, hair fibers
- Procedures
- Laser treatments, microneedling, hair transplants, protein-rich plasma injection
- Apparatuses
- HairMax LaserComb, light treatment
In addition to substitutions, I have to consider the direct competition. The alternatives that are also topical. Those include:
- Minoxidil (Rogaine), rosemary essential oil, pyrithione zinc shampoo, scalp tonic/serum
Obviously, there’s no shortage of alternatives to my prospective product. However, many of these treatments are ongoing and the potential exists for customers to combine them.
After listing these potential substitutions, it dawned on me that there are a couple of different classes of hair loss. I would probably target individuals that are in the early stages and are merely looking for help to slow down and, hopefully, somewhat reverse the initial effects of hair loss.
Another thing that dawned on me when researching substitutions is that it might be a mistake to only consider men when ascertaining the market for this product. Most of the results I found when searching “hair loss treatments” were articles targeted at women.
As I said, I’m taking this journey right along with you. So, I’m refining my idea and picking things up as I go along.
Gathering survey information for your business plan demand analysis
The next steps are mostly statistical. That might give you pause if numbers aren’t your thing.
I really do wish I could provide you with the handiest spreadsheet imaginable to manage the information you find. There are just too many variables, though. Different surveys asking different questions. Not to mention, every industry is going to address unrelated topics. I just couldn’t figure out how to make a one-size-fits-all tool.
What we’re going to do is compile whatever relevant statistical information we can get our hands-on, and interpret what we find. You can input this information into your own spreadsheet if you like
Statistical information, hopefully, can be obtained from a simple internet search. “[your topic/industry] survey results”, or something similar should yield some useful information. If you can’t find relevant info, then you might have to reach out to industry trade magazines or organizations.
As far as how much survey information to collect – there’s no clear answer. It depends, first and foremost, on the abundance of such information. If there is plenty available, then I guess I’d recommend collecting it until you’re tired of doing so. You can always circle back around and search for more specific results if you need to in the future.
What to focus on
Right now, focus on demographics information, substitute product information, and information about motivation (drivers).
This is where having it in a spreadsheet will come in handy. With the numbers in a spreadsheet, you can combine survey information and break it down as needed. Check out my example below to see what I mean.
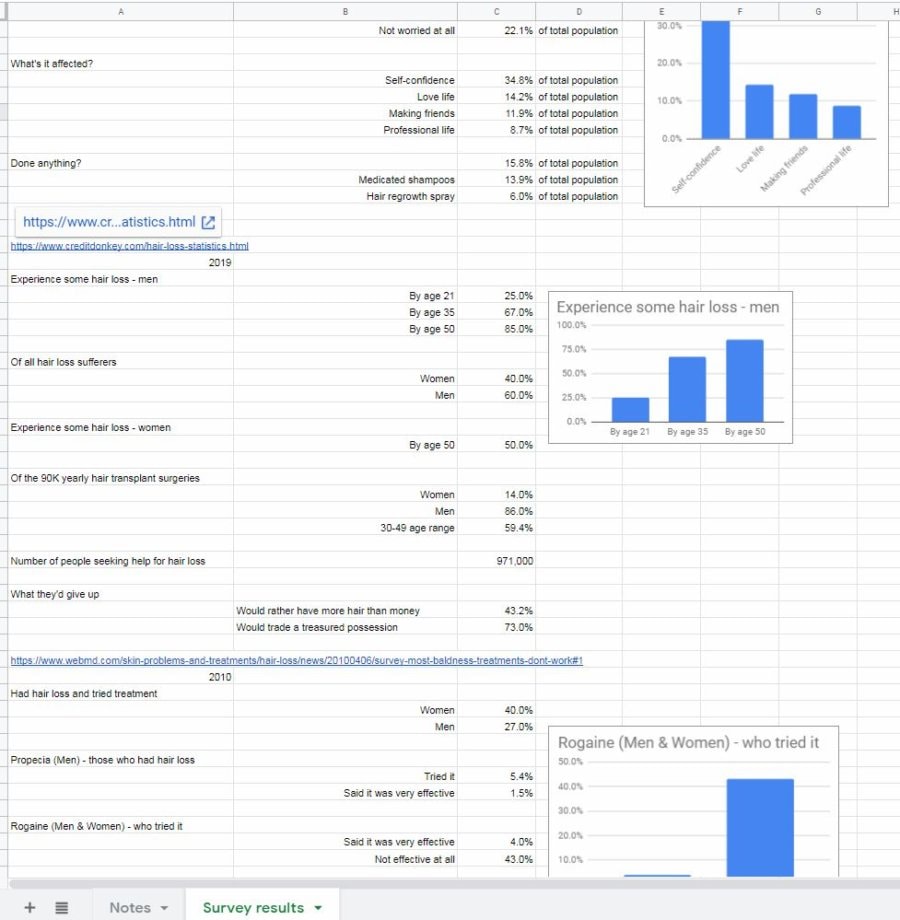
Survey information about my product
There was no shortage of survey results regarding hair loss. In fact, I grew tired of collecting information well before I was able to read it all.
I must admit, I learned something on this step. I learned that it probably makes more sense to do this research before creating customer avatars rather than after.
This research showed me that hair loss in women is a considerably more prevalent problem than I knew. So, I should definitely not exclude women when trying to calculate the size of my target market. Additionally, I learned a lot more about the age that hair loss starts to affect men and women. Not to mention, a lot of other interesting tidbits related to marketing and substitute products.
I simply typed the figures I found into the cells and tried to organize it in a somewhat easy-to-read format.
To make this information as useful as possible, I also included a link to the survey – in case I wanted to reference it again. Also, I thought it would be useful to make note of the year the survey was conducted. That way, I could note trends, if any existed.
Finally, to top it all off, I put in some charts. Charts can help to illustrate ideas in a way that numbers can’t, sometimes.
Now, I have a nice little foundation of data to build my business plan off of. I also know that there is plenty of other information out there if I want to delve further on a specific topic.
Divide total industry demand into its main components.
Now, you want to start to organize the information you found in a logical manner.
First, isolate the information related to demographics or that which otherwise describes your potential customers to you. You want to break this information up so that you can get an idea of what your potential customers might look like. You should, hopefully, begin to see customer “avatars” take shape.
Yes, I asked you to create avatars in the previous post. As I said above, that was probably premature. It would make more sense to create the avatars with this survey information, then use the census/demographic information to estimate the size of the market based on what you found.
Live and learn…
After you have the demographic information in good order, move on to the “solution” information – if available. This is information that specifies how customers are solving their problem(s) now.
If you’re lucky, this information will join seamlessly with the demographic information you organized above.
Start with the simplest questions (those with the fewest variables) and expound from there.
What if my survey data is inconsistent?
You might run into a situation where you have conflicting information. Or you might find yourself in the fortunate situation where different surveys seem to corroborate the same statistics.
If your information sources don’t jive, you have a couple of options. First, you can move forward with the information you deem to be the most trustworthy. Or, alternatively, you can average what you found. This works well if the differing results are relatively close together. Finally, you can choose to use the data source that is most recent – particularly if your industry is especially dynamic.
All of your numbers aren’t going to jive up perfectly. However, at this point, you are armed with a lot better information than when you started. Better information will ultimately lead to better decisions.
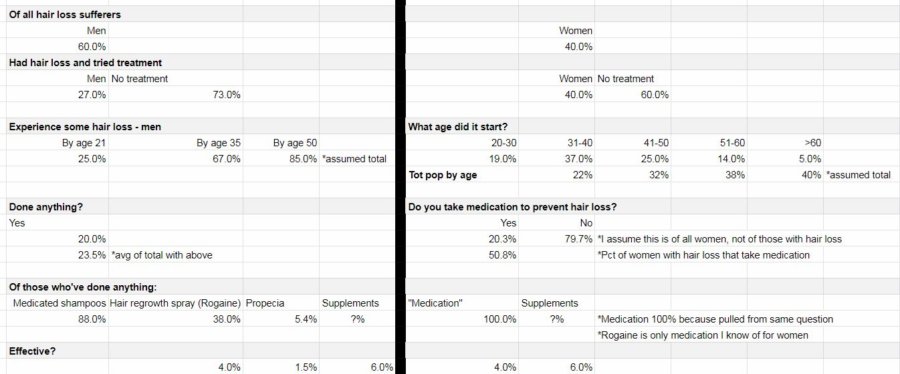
Industry components for my product
Demographics
For my part, I like to start simple and divide my demographics based on the variable with the fewest options. In this case, the simplest variable only has two choices – men and women.
From there, I used information that I found regarding the percentage of men and women that have had hair loss and have tried treatments.
Next, I break things down further based on the age that men and women started experiencing hair loss. I was fortunate to find information for both genders.
That’s the extent of demographic information I was able to obtain. I would have liked to have found some information regarding income or socioeconomic status. If that information proves to be critical as I move forward with my business plan, I’ll have to circle back around to see if I can track it down.
Once I felt good about my (revised) customer avatars, I moved on to “solution” information.
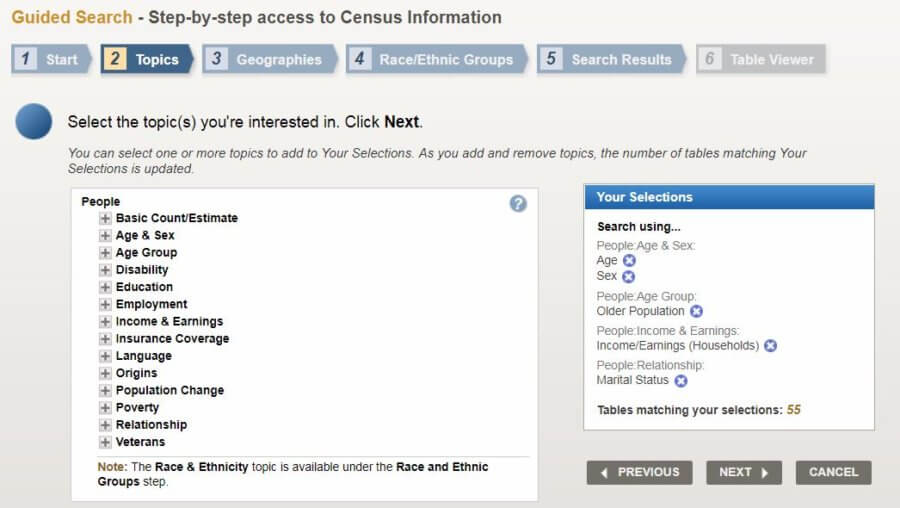
Want to use data.census.gov to know how big your potential market is? Read this post:
CENSUS DATA MARKET RESEARCH AT THE NEW DATA.CENSUS.GOV
Solutions
Again, thanks to the abundance of information I was able to find, I found similar questions for both genders. The first question was the simplest. It asked if the person with hair loss had done anything to address the problem.
From there, I had a couple of survey questions that explored the alternatives that hair loss sufferers had tried in the past. Additionally, I found results that gave insight into how effective these alternatives were.
When all was said and done, I had the groundwork laid for the ability to know how many potential customers I might have, their demographics, what they have tried so far, and how well those alternatives had addressed the issue at hand.
Here’s what my worksheet looks like after sorting my information into industry components:
Business plan demand analysis of drivers
Hopefully, in your search for survey results, you came across some information that provided insight into the “why people buy” question.
In particular, we’re looking for drivers of sales here. Specifically, what circumstances compel a customer to buy your product/service (or a substitute)? Hint: people usually buy to solve a problem. To avoid pain, not seek pleasure. Or, so I’ve been told…
Insight into what compels your customers to buy will not only be valuable in the drafting of the remainder of the business plan but in all your marketing efforts once you are up and running.
The information about who your customers are (from the previous step), why they buy, and what steps they are currently taking to solve their problems (also from the previous step) will hopefully paint a clear picture for you. A picture that will guide you to a point where you can position your strengths in a manner that will help other people’s weaknesses.
Understanding the drivers of demand for my product
Again, I was fortunate to have an abundance of survey information to draw from. A couple of my surveys not only touched on how hair loss made people feel but also on specific actions that they had taken before the hair loss started.
This information tells me an angle I can take when marketing my product, plus where a lot of my potential customers are going before they start to experience this problem. That place…the hairdresser.
Of course, that’s for women. Though there’s no rock-solid proof that it’s hairstyling that is contributing to hair loss in women, there is enough correlation to make a compelling case. For men, on the other hand, hair loss just seems to be the hand that most are dealt.
But, before we get into that, let’s look at some of the emotional drivers that might compel customers to purchase a topical hair loss supplement…
Drivers for men
On the “men” side I got information about how “worried” men were about hair loss. This told me that most men were, at least, “somewhat” worried about hair loss.
Beyond that, there was valuable information about how hair loss had affected them negatively.
Finally, the most valuable information, to me, was a question of what they would give up to solve this problem (men & women). The answers were encouraging for someone who was hoping to build a business in this industry. Almost half would rather have more hair than more money. Three quarters would give up a prized possession for more hair.
While I acknowledge that I’m not marketing a guaranteed cure to hair loss, that tells me that people are willing to try anything to fix this problem. As I know from my market segmentation analysis, supplementation works for about 1 in 17 people. Not great odds, by any means. But good enough, I hope, to at least try a new product. Especially when the ingredients are all-natural and offer no downside.
Drivers for women
About half had stress prior to experiencing hair loss. That’s a coin flip. It doesn’t mean that the hair loss was caused by the stress (though it surely didn’t help). But it provides insight into what women are feeling prior to and while they are experiencing this problem.
I also included the “What they’d give up” question on the women’s side of the analysis because my source for that information didn’t specify either gender. Plus, it seems feasible that women would feel the same or even stronger. It’s my opinion that society values female attractiveness above male attractiveness.
Finally, we get down to the brass tacks. A potential cause-and-effect situation for the problem I’m attempting to address. The number of women that are currently experiencing hair loss are also (possibly) straightening/heat processing or getting their hair colored on a semi-frequent basis.
This tells me that hairstyling might play a part in a lot of women’s hair loss (this goes back to the pressure to be attractive thing). Therefore, I should consider marketing my product in salons and other establishments that focus on women’s hair.
There’s still a lot of analysis to be done. But, two steps into the process of drafting my business plan, I feel a lot more confident about my understanding of the environment.
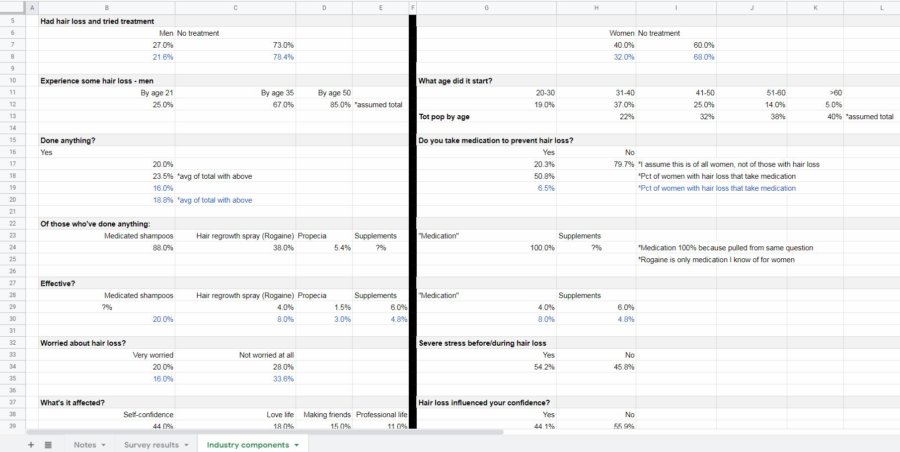
Here’s a look at my spreadsheet with the driver information included:
Business plan demand analysis of sensitivity
To this point, the goal has been to make assumptions and get answers. We want to have a better understanding of the environment in which our business will operate. Hopefully, you feel that you’ve accomplished that.
But, we don’t do ourselves any favors by lying to ourselves.
Lying?
Well, yes. But probably not willingly.
You start off excited about your business idea. So excited that you decide to take the first step (something that the vast majority of people won’t do). You begin to write a business plan. You can feel your idea taking shape. You’ve already refined your idea a bit and feel that by the time this whole exercise is over, there’s no way you can fail. You’ve got momentum and your confidence keeps increasing.
That is all very good. Confidence is key. But, if everything looks rosy, you might be blind to a risk that could put your baby in jeopardy.
So, I don’t want to be a killjoy. But, for the sake of our businesses, let’s take a step back and play devil’s advocate. We need to ask ourselves some tough questions and challenge our assumptions. If we can rise to these challenges, and address them with confidence, our chances of success are that much greater.
Go back through your segmentation and demand drivers and think critically about this information. Some statistics might be a given, without much wiggle room. Others might be misrepresentative of reality. In these instances, tap into your inner cynic.
Make notes of what the worst-case scenario might look like. If you’re using a spreadsheet, like me, maybe use a different colored text. Address things like survey questions that might have been misinterpreted or alternative explanations for results.
Don’t get too down-and-out here and don’t dwell on this step too long. You don’t have to necessarily plan what you would do if these worst-case scenarios came to be. You just need to imagine them so that when the time comes for serious planning, you can take these risks into consideration.
Demand sensitivity for my product
Demographics
I think my categorization by demographics is pretty safe. It’s rather well established how many men and women experience hair loss. The only thing that I might tweak is the number of men and women who have had hair loss and tried treatment. I lowered those estimates by 20%. It could be that the respondents’ interpretation of “treatment” is to comb their hair a different way or to shave their heads rather than to buy a product to battle hair loss.
Furthermore, what if the number of people that have “done anything” is lower? What if I misinterpreted the question for women that asked: “Do you take medication to prevent hair loss?” Maybe it was 20% of women who actually had hair loss rather than all women? The effect of that would be dramatic.
Substitute products
What if the alternative treatments were more effective than I’ve been led to believe? It could be that the respondents only consider “effective” to be a restoration to a full, thick head of hair? Also, just because they consider them ineffective, it doesn’t mean that they’ll stop using them. They might think that all of their hair will fall out if they stop (which could work in my favor, though). Perhaps they were overly optimistic when it came to supplements? It could be that supplements gave them other benefits, but didn’t make their hair loss any worse – so they considered them “effective.”
Drivers
Could it be that fewer men are really “(very) worried about hair loss” than I’m led to believe? Are more are “Not worried at all?” Plus, it might be that those who are only “somewhat worried” aren’t motivated to do anything about it.
As far as confidence (love life, making friends, professional life) goes, it might be that that hair loss is a contributor to low confidence, but not the primary driver. Maybe they’re overweight or socially awkward and that’s why they lack the confidence they desire?
As far as “what they’d give up” it could be that the respondents were primed by the hair loss questionnaire to be more self-conscious than they usually are. If it came down to it, perhaps not so many would be willing to part with valuables to solve this problem.
Finally, as far as hair styling being a cause of hair loss in women, it could be that I am wrong. Maybe hair styling has no effect on hair loss. Or, maybe women overestimate how often they heat process or color their hair. It only feels like every day/once every 2-3 weeks. When, in fact, they do it a lot less often.
Okay, that’s enough pessimism. It seems unlikely that every worst-case scenario would be true. But, there’s probably a mix in there between my initial interpretations and the not-so-great ones.
Want to back your business plan up with valuable data? Read this post:
GOVERNMENT STATISTICS FOR MARKET RESEARCH VIA USA.GOV
This exercise should help me going forward to make realistic forecasts and assumptions. Which, in turn, should help me be proactive to some of the challenges I might face.
Here’s a final look at my spreadsheet with my worst-case notes in blue:
Business plan demand analysis
This step takes a little bit of thought and a decent amount of research. This is done to give you a deeper understanding of the market you hope to compete in and the customers you hope to sell to.
What other steps would you have taken to refine estimates of demand?
Do you think my demand sensitivity was rational? Or, was I taking it too easy on myself?


