In order to estimate how much in sales your startup can hope for, you’re going to have to estimate the market size for your product/service(s). This is critical for your startup because it will give you an idea of your business’ potential. It will also help you plan for capacity-related issues.
2 approaches to estimating the market size for a business plan
I cover this topic more in-depth in a post on market size and growth rate on my sister site, InvestSomeMoney.com.
The context there is focused on investing your money in a publicly-traded company. Though that’s a little different than what we are doing here, the fundamental principles remain the same.
The goal is to determine how many potential customers there are for a business and how much they are willing to spend. In order to do that, we can employ two general methods. These methods are a top-down analysis and a bottom-up approach to understand market size and growth.
One way to think about this is that a bottom-up approach uses multiplication and a top-down analysis uses division to arrive at an estimated market size.
After writing on this subject several times, I’ve come up with another way to think about these methods. I think a bottom-up approach should look internally, at things like unit size and capacity. A top-down analysis should look externally at things like demographics and market research.
Looking at this from these two different perspectives opens the door for further analysis. When you’re done, you should know whether you can expect to be capacity constrained or demand constrained. You’ll also start to flesh out some ideas that will help you further into your business plan.
If you do an analysis with both approaches, you can compare the results. For instance, if your bottom-up approach is higher, you’ll know that you could have excess capacity issues. You need to consider scaling that back or otherwise expanding your product/service offering to drum up additional demand.
Conversely, if your top-down analysis reveals that demand is in excess of capacity, then you are leaving money on the table. Time to start thinking about what you can do to scale up and capture as much of the market as possible.
Let’s start by taking a look at a bottom-up approach to estimating the market size for a business plan.
Bottom-up approach example
On my sister site, InvestSomeMoney.com, I researched three real-life examples of a bottom up market sizing approach. In those examples, you’ll see that they sometimes mix in a little top-down analysis with their bottom-up approach and vice versa. There’s no rule against doing that, but I would rather look at things from two totally different perspectives.
When using a bottom-up approach, try to start with the most simplistic piece of firm information you can get your hands on. Then, start to build on it with other information, or the best guess you can muster.
You can think of a bottom-up approach as one that focuses on how much and how often customers will buy.
This information might be something you have internally. Or, it might be from the information you found by researching online. Start with a single “serving size” of your product/service. Then, think about how often a customer would buy. Work your way up from there.
There’s still a lot to consider regarding packaging volume and dosage. That will require more thought. But, for the time being, I’m going to estimate the volume of a one month’s supply and the daily dosage to be the same as Rogaine. If that changes as I progress with my business plan, I can easily circle back to this and plug in different numbers.
With Rogaine as my benchmark, I know that a dosage of my product would be 1 mL. The product would be used twice a day. My product would come in 2 oz (60 ml) bottles. Each bottle would be one month’s supply, as I said.
Thinking about capacity
Okay. Now that I have a grasp on the package size – what about blending and packaging? If this idea were to come to fruition, I don’t picture myself blending batches in my bathtub and filling bottles with a ladle and a funnel. I would need access to some sort of industrial equipment.
Fortunately, a quick internet search shows that there is no shortage of contract blenders and packagers out there. Especially for food and supplements. What it costs, remains to be seen. That’s an issue for another time. For now, I just want to get an idea of how much I could manufacture.
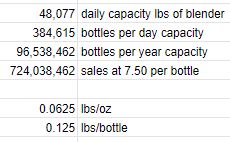
This company claims it can blend 1.25 million pounds per workday. We’ll assume, for now, this represents the average contract blender/packager. What does that translate into in terms of 2 oz bottles?
First of all, I wouldn’t need all 26 of their kettles. Only one, tops, especially at startup. So, if we divide the 1.25 million pounds by 26, we get a per kettle capacity of about 48,000 lbs per day.
Pounds are a weight unit of measure (UOM) and ounces are a volume UOM. To make the conversion, we’re going to have to do some more estimating.
Water weighs a little over 8 lbs/gallon. We’ll assume my product has roughly the same density.
8 lbs ÷ 128 oz (per gallon) = .0625 lbs/oz. With each bottle containing 2 oz, we know that it’ll weigh approximately .125 lbs/bottle.
This means that with one of this company’s kettles, I could blend 384,615 bottles worth of product per day. 96.5 million bottles per year. At an approximate sales price of $7.50 per bottle, that translates into nearly $725 million in revenue per year.
Okay, I’ve looked at things from a bottom-up, capacity-focused approach. Let’s now consider a top-down, demographic-focused analysis.
Top-down analysis
Not surprisingly, I also wrote a post on InvestSomeMoney.com with examples of a top-down analysis to determine market size for a business plan. When you read through it, you might notice that some of the examples use Census data (or something similar). They take big chunks of information and start narrowing down their market from there.
Which brings us to three important terms for performing a top-down analysis. These are:
Total addressable market (TAM) Serviceable available market (SAM) and Serviceable obtainable market (SOM)
A SOM is a fraction of the SAM. In turn, a SAM is part of the TAM.
The TAM can be thought of as every potential customer that you can reach geographically. The SAM is what’s left when you niche down a little into the population that is a good fit for your unique selling proposition. Finally, the SOM represents the percentage of the SAM you can realistically expect to take.
It’s unlikely that you will ever capture 100% of the SAM. Even in a specific niche, you can’t be everything to everyone. That’s alright, though. The goal of this exercise is to make realistic estimates so that you have a sound business plan to work from.
When doing a top-down analysis, start with a large population or an overall industry size. From there, narrow down your customer until you arrive at your SOM. It helps to have a “customer avatar” in mind before starting a top-down analysis so you know where to niche down to.
I would suggest you perform a business plan demand analysis first to get a crystal clear picture of what that avatar is. You might think you know it intuitively. But you might be surprised at what you find – like I was!
A top-down analysis for my business plan
I know that not every person in the U.S. (much less the world) is going to want or need an all-natural topical supplement for hair loss. Who might though???
I’ll refer back to my handy-dandy business plan demand analysis (linked above) to see what I can find.
Here, I’m reminded of the ages that men and women first started experiencing hair loss. I’m reminded of the percentage that has sought any sort of treatment. Finally, I’m given an idea of what types of treatment they have tried.
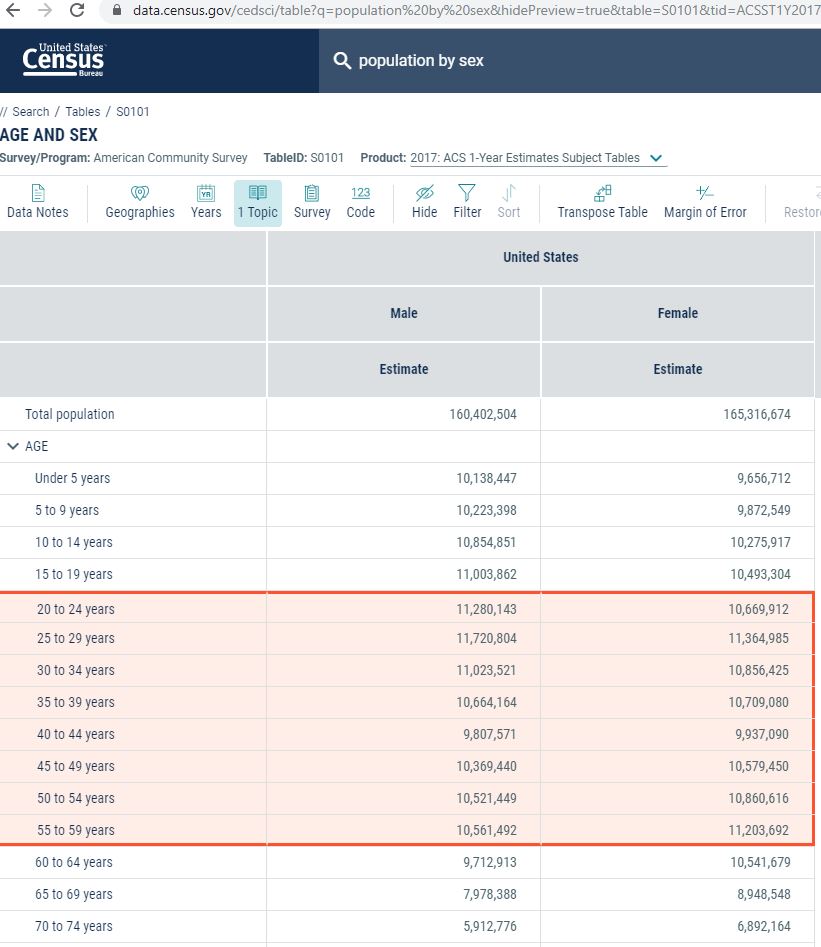
A quick visit to Data.Census.Gov and I find table S0101, which gives me the U.S. population by age and sex. I customize and filter the table real quick. Then, I copy and paste the data I need into my spreadsheet.
Next step is to narrow these numbers down. I’ll use the “regular” numbers and the pessimistic numbers from sensitivity analysis from my business plan demand workbook.
I want to know the percentage of men who have had hair loss and tried any sort of treatment. Then, I want to go deeper and estimate the number that has found supplements to be effective. I’ll do this for both the most-likely and the worst-case scenarios. On the women’s side, I’ll do, more or less, the same thing.
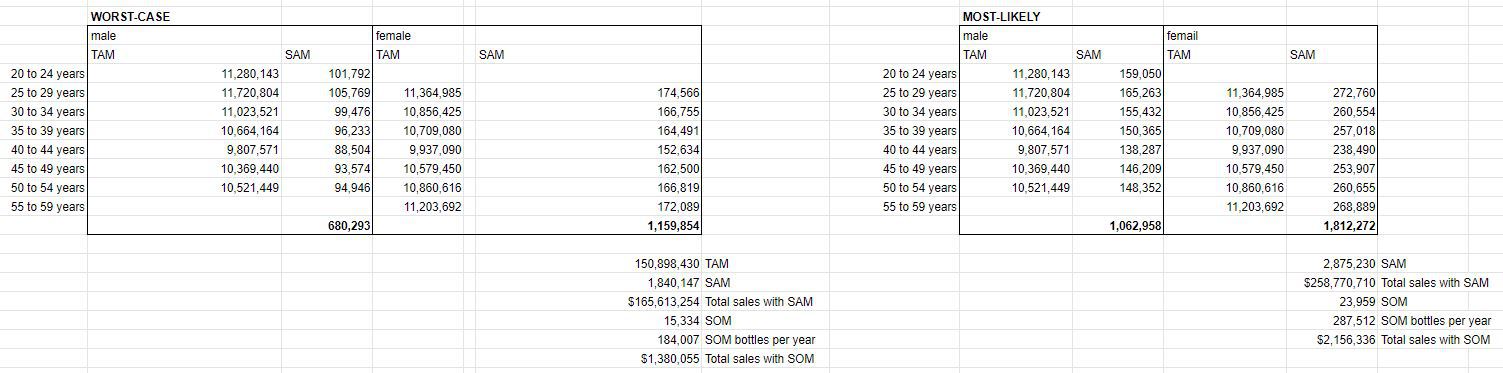
TAM and SAM
You’ll see that I didn’t use the same age ranges for men and women. I assumed that males would start experiencing hair loss earlier, but would also stop caring about it earlier too.
The age range for males in my TAM was 20 – 54. For females, it was 25 – 59. This translates into a TAM of 151 million people in the U.S.
For the SAM, my worst-case scenario estimated that .9% of the male population in the target age ranges would be part of my market. 1.54% of females in the target age ranges were also assumed to be part of my market. This translated into a worst-case SAM of 1.8 million people.
As for my most-likely SAM, I estimated that 1.41% of males and 2.4% of females in the target age ranges were potential customers. This resulted in a SAM of 2.88 million people. Over a million more potential customers.
SOM
SOM is tricky.
Who’s to say what percentage of the SAM my company could capture? Obviously, it would start at 0% and work its way up from there. Where would it stop though?
It will depend, in part, on the number of companies vying for this niche. As I often do, I will refer to the Pareto principle. The Pareto principle states that 20% of the inputs will be responsible for 80% of the outputs. Put another way, 20% of the companies will have roughly 80% of the market share.
I’ll refer back, again, to my post on business plan demand. In it, I found three direct substitutions for my topical hair loss product. I won’t include Minoxidil (Rogaine) in that group, because of its unnatural chemistry.
Again, without getting too mired in math, I estimate that there are approximately thirty companies in the topical hair loss supplement space. This was a quick and dirty estimate based on the results of an internet search.
Six of those thirty companies probably control 80% of the market. That leaves 4.2% (1 ÷ 24) of the remaining 20% as my short-term SOM. Obviously, if my product were to take off, that amount could grow considerably and could approach the SAM.
What that means as far as the market size is 15K people worst-case and 24K people most-likely. At 12 bottles purchased per year, this translates into 184K and 287.5K bottles per year respectively.
Here’s a look at the spreadsheet breaking that all down:
Click to enlarge
Comparing a bottom-up and top-down analysis when determining market size for a business plan
Obviously, a couple hundred thousand bottles (top-down) is a far cry from 96.5 million (bottom-up). So, it would appear I will not be capacity constrained in the near future. In fact, as this startup moves forward, I need to make sure I’m not over-buying capacity. Those huge fixed costs could kill my business before it has a chance to get off the ground.
Speaking of fixed costs, the information from this analysis has given me good data to build my pro forma financials – when that time comes.
Now, at some point in the future, selling my product internationally could be an option. However, in this tiny niche, it is unlikely that I’ll ever need that much capacity for this one product.
Market size for a business plan
What were there factors I didn’t consider (but should have) when estimating my potential market size?
Small businesses and entrepreneurs use demand analysis to:
Consider substitute products and services
Get input from (potential) customers
Determine what “drives” demand
Understand what variables affect demand and to what degree
Demand analysis is about challenging your preconceived notions regarding your product/service. A stress test, if you will. A demand analysis will take your idea and start molding it into something that has even higher potential.
As an entrepreneur, you can’t be too stubborn. You have to be flexible. After going through this process, the hope is that you’ll come out the other end with an even more refined idea and a greater chance at success.
Market research and competitive analysis for a business plan
This is the second post on drafting a business plan for your startup. These posts are modeled after the SBA Business Guide.
When first thinking about the market for your product/service, don’t define it too narrowly. Try to think of substitutions that you might not have otherwise considered. No, you might not compete directly with these substitute products, but the presence of substitute products will have an impact on your pricing and demand.
Pricing too high could push customers to these substitute products. Even if that pricing seems in line with your value proposition when compared to direct competitors. But, theoretically, the amount demanded changes (inversely) with the price. A higher price will push customers to consider alternatives. A lower price should result in a higher volume sold.
Further defining the market for my product
As I mentioned in my first business plan post on the topic of demographics, I am working alongside you. I have a prospective product that I would like to explore the viability of, and I am creating a business plan for this product as I write these posts. As a reminder, my potential product is an all-natural hair-thickening topical supplement.
Anyhow, in the previous post, I used “customer avatars” to roughly ascertain the size of my market. I think I was fairly liberal in that estimation. The three of my avatars that were the most detailed totaled approximately 5.2 million people. The avatar that was broader included 6.5 million people.
As mentioned above, I have to keep in mind that not all of these people will pursue hair loss treatment. Many, will just accept it as a normal part of aging. Others will choose to address the problem but will pursue an alternative treatment method to topical supplements. Some of these alternative treatment methods include:
Obviously, there’s no shortage of alternatives to my prospective product. However, many of these treatments are ongoing and the potential exists for customers to combine them.
After listing these potential substitutions, it dawned on me that there are a couple of different classes of hair loss. I would probably target individuals that are in the early stages and are merely looking for help to slow down and, hopefully, somewhat reverse the initial effects of hair loss.
Another thing that dawned on me when researching substitutions is that it might be a mistake to only consider men when ascertaining the market for this product. Most of the results I found when searching “hair loss treatments” were articles targeted at women.
As I said, I’m taking this journey right along with you. So, I’m refining my idea and picking things up as I go along.
Gathering survey information for your business plan demand analysis
The next steps are mostly statistical. That might give you pause if numbers aren’t your thing.
I really do wish I could provide you with the handiest spreadsheet imaginable to manage the information you find. There are just too many variables, though. Different surveys asking different questions. Not to mention, every industry is going to address unrelated topics. I just couldn’t figure out how to make a one-size-fits-all tool.
What we’re going to do is compile whatever relevant statistical information we can get our hands-on, and interpret what we find. You can input this information into your own spreadsheet if you like
Statistical information, hopefully, can be obtained from a simple internet search. “[your topic/industry] survey results”, or something similar should yield some useful information. If you can’t find relevant info, then you might have to reach out to industry trade magazines or organizations.
As far as how much survey information to collect – there’s no clear answer. It depends, first and foremost, on the abundance of such information. If there is plenty available, then I guess I’d recommend collecting it until you’re tired of doing so. You can always circle back around and search for more specific results if you need to in the future.
What to focus on
Right now, focus on demographics information, substitute product information, and information about motivation (drivers).
This is where having it in a spreadsheet will come in handy. With the numbers in a spreadsheet, you can combine survey information and break it down as needed. Check out my example below to see what I mean.
Click to enlarge
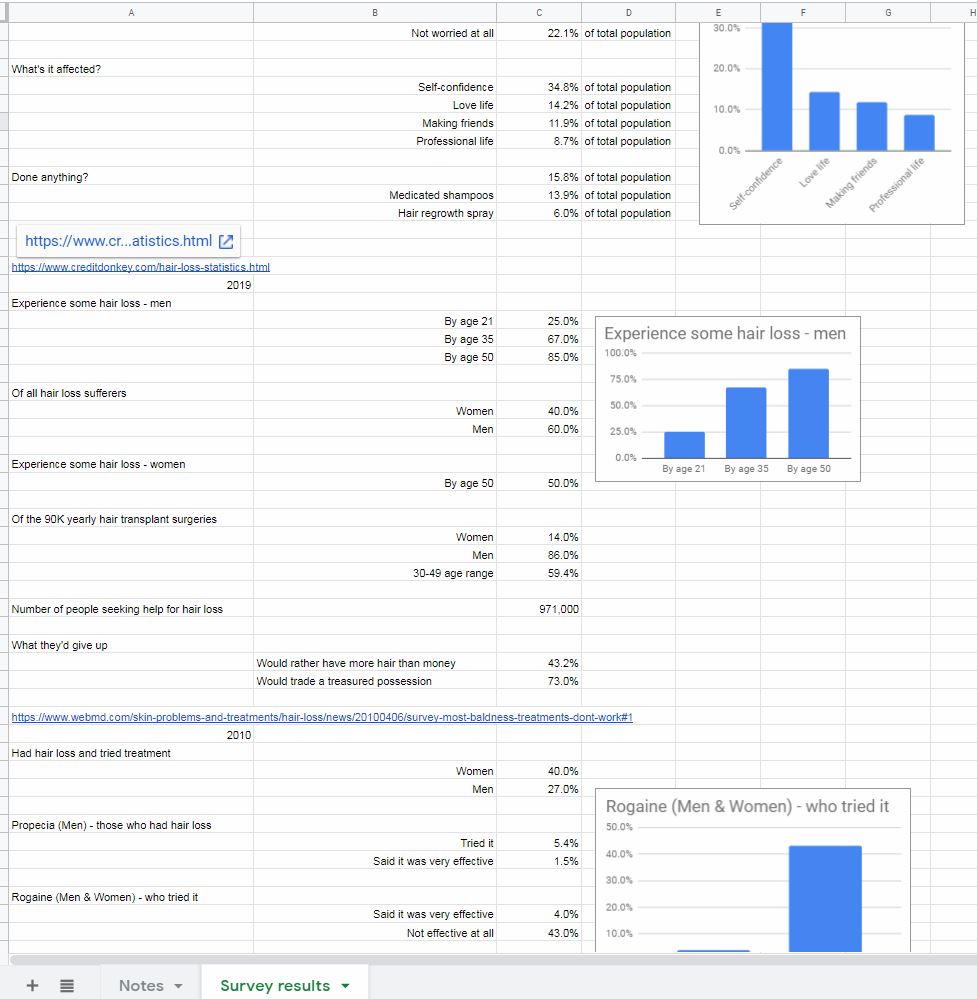
Survey information about my product
There was no shortage of survey results regarding hair loss. In fact, I grew tired of collecting information well before I was able to read it all.
I must admit, I learned something on this step. I learned that it probably makes more sense to do this research before creating customer avatars rather than after.
This research showed me that hair loss in women is a considerably more prevalent problem than I knew. So, I should definitely not exclude women when trying to calculate the size of my target market. Additionally, I learned a lot more about the age that hair loss starts to affect men and women. Not to mention, a lot of other interesting tidbits related to marketing and substitute products.
I simply typed the figures I found into the cells and tried to organize it in a somewhat easy-to-read format.
To make this information as useful as possible, I also included a link to the survey – in case I wanted to reference it again. Also, I thought it would be useful to make note of the year the survey was conducted. That way, I could note trends, if any existed.
Finally, to top it all off, I put in some charts. Charts can help to illustrate ideas in a way that numbers can’t, sometimes.
Now, I have a nice little foundation of data to build my business plan off of. I also know that there is plenty of other information out there if I want to delve further on a specific topic.
Divide total industry demand into its main components.
Now, you want to start to organize the information you found in a logical manner.
First, isolate the information related to demographics or that which otherwise describes your potential customers to you. You want to break this information up so that you can get an idea of what your potential customers might look like. You should, hopefully, begin to see customer “avatars” take shape.
Yes, I asked you to create avatars in the previous post. As I said above, that was probably premature. It would make more sense to create the avatars with this survey information, then use the census/demographic information to estimate the size of the market based on what you found.
Live and learn…
After you have the demographic information in good order, move on to the “solution” information – if available. This is information that specifies how customers are solving their problem(s) now.
If you’re lucky, this information will join seamlessly with the demographic information you organized above.
Start with the simplest questions (those with the fewest variables) and expound from there.
What if my survey data is inconsistent?
You might run into a situation where you have conflicting information. Or you might find yourself in the fortunate situation where different surveys seem to corroborate the same statistics.
If your information sources don’t jive, you have a couple of options. First, you can move forward with the information you deem to be the most trustworthy. Or, alternatively, you can average what you found. This works well if the differing results are relatively close together. Finally, you can choose to use the data source that is most recent – particularly if your industry is especially dynamic.
All of your numbers aren’t going to jive up perfectly. However, at this point, you are armed with a lot better information than when you started. Better information will ultimately lead to better decisions.
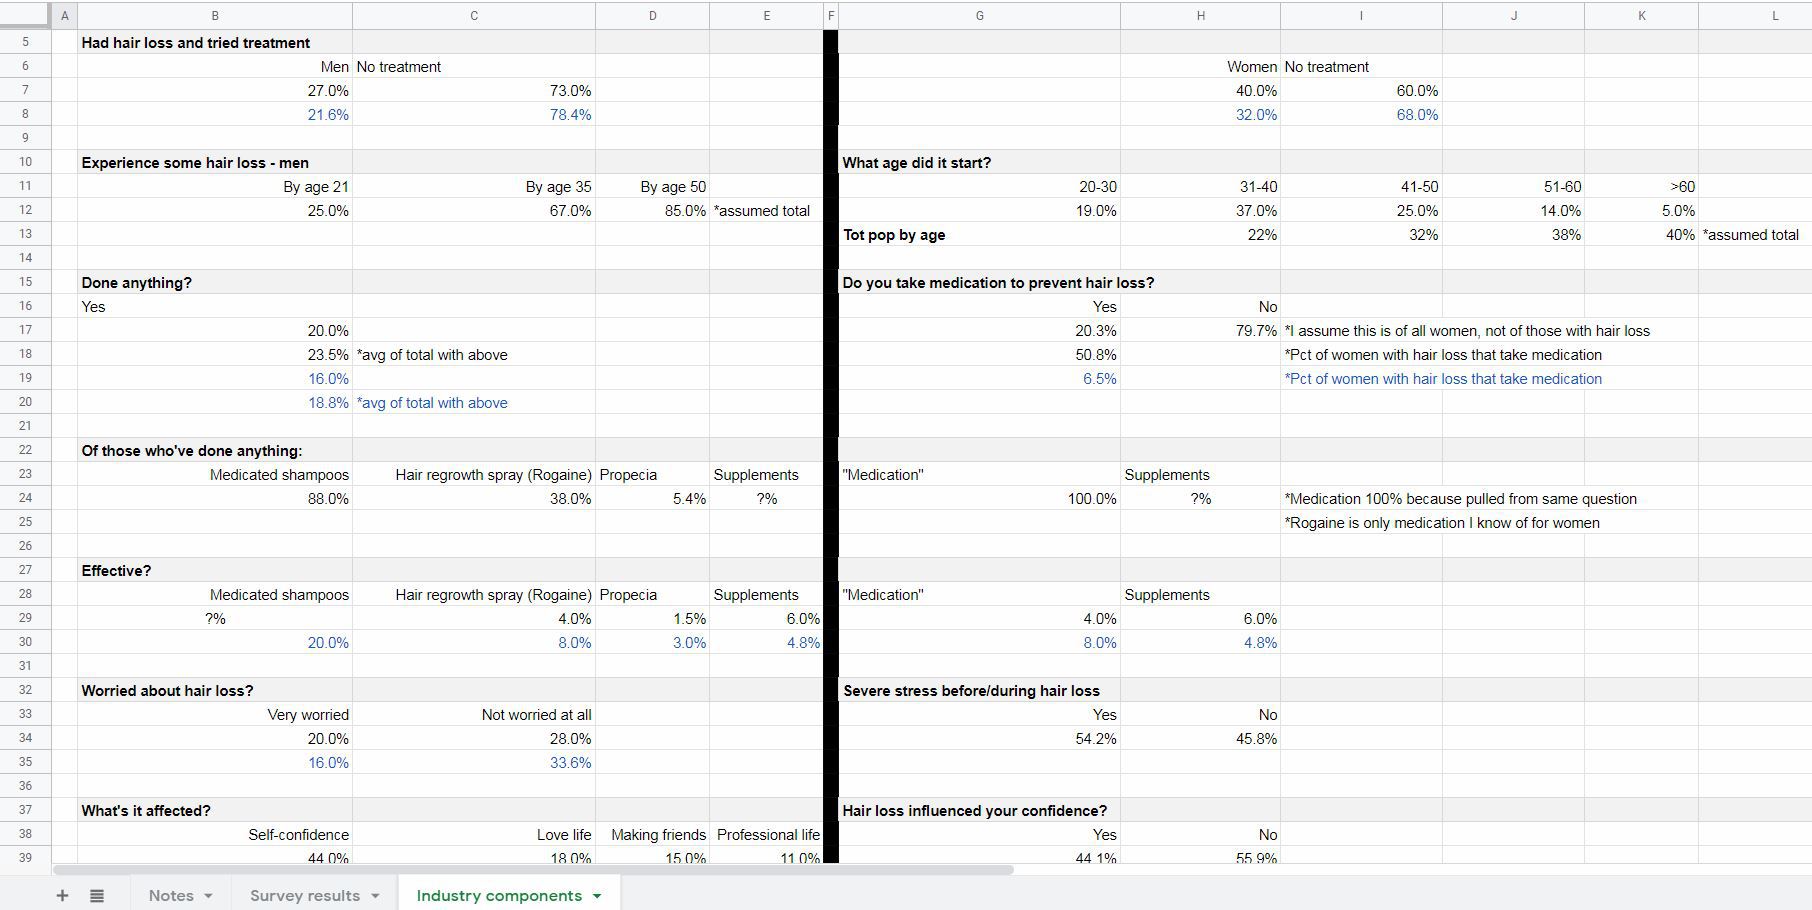
Industry components for my product
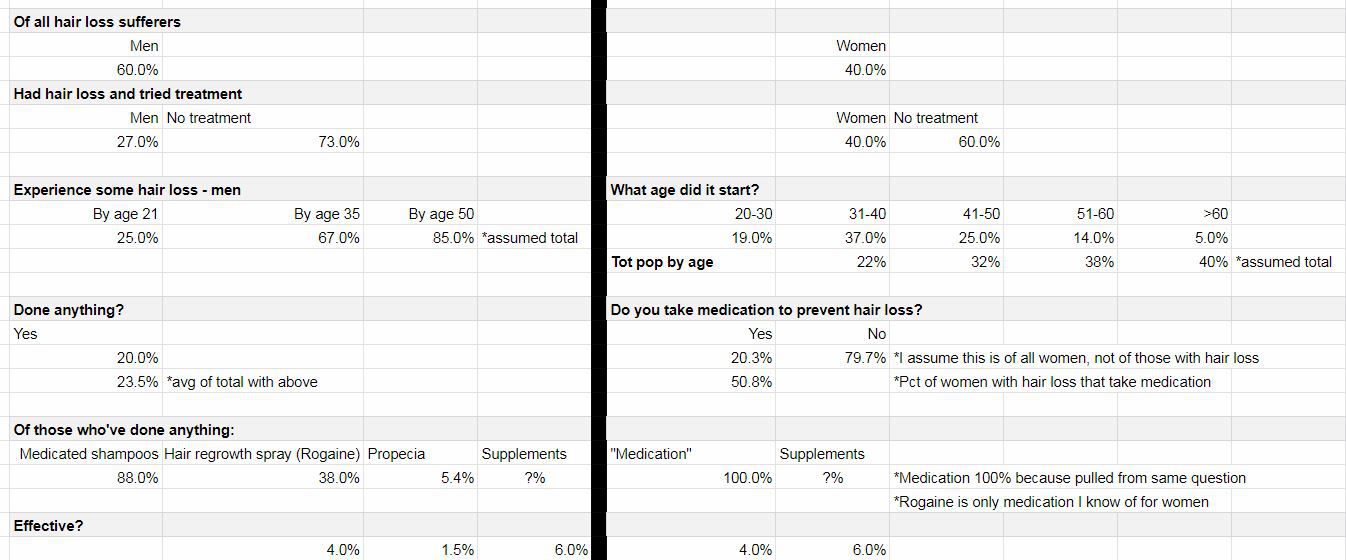
Demographics
For my part, I like to start simple and divide my demographics based on the variable with the fewest options. In this case, the simplest variable only has two choices – men and women.
From there, I used information that I found regarding the percentage of men and women that have had hair loss and have tried treatments.
Next, I break things down further based on the age that men and women started experiencing hair loss. I was fortunate to find information for both genders.
That’s the extent of demographic information I was able to obtain. I would have liked to have found some information regarding income or socioeconomic status. If that information proves to be critical as I move forward with my business plan, I’ll have to circle back around to see if I can track it down.
Once I felt good about my (revised) customer avatars, I moved on to “solution” information.
Again, thanks to the abundance of information I was able to find, I found similar questions for both genders. The first question was the simplest. It asked if the person with hair loss had done anything to address the problem.
From there, I had a couple of survey questions that explored the alternatives that hair loss sufferers had tried in the past. Additionally, I found results that gave insight into how effective these alternatives were.
When all was said and done, I had the groundwork laid for the ability to know how many potential customers I might have, their demographics, what they have tried so far, and how well those alternatives had addressed the issue at hand.
Here’s what my worksheet looks like after sorting my information into industry components:
Click to enlarge
Business plan demand analysis of drivers
Hopefully, in your search for survey results, you came across some information that provided insight into the “why people buy” question.
In particular, we’re looking for drivers of sales here. Specifically, what circumstances compel a customer to buy your product/service (or a substitute)? Hint: people usually buy to solve a problem. To avoid pain, not seek pleasure. Or, so I’ve been told…
Insight into what compels your customers to buy will not only be valuable in the drafting of the remainder of the business plan but in all your marketing efforts once you are up and running.
The information about who your customers are (from the previous step), why they buy, and what steps they are currently taking to solve their problems (also from the previous step) will hopefully paint a clear picture for you. A picture that will guide you to a point where you can position your strengths in a manner that will help other people’s weaknesses.
Understanding the drivers of demand for my product
Again, I was fortunate to have an abundance of survey information to draw from. A couple of my surveys not only touched on how hair loss made people feel but also on specific actions that they had taken before the hair loss started.
This information tells me an angle I can take when marketing my product, plus where a lot of my potential customers are going before they start to experience this problem. That place…the hairdresser.
Of course, that’s for women. Though there’s no rock-solid proof that it’s hairstyling that is contributing to hair loss in women, there is enough correlation to make a compelling case. For men, on the other hand, hair loss just seems to be the hand that most are dealt.
But, before we get into that, let’s look at some of the emotional drivers that might compel customers to purchase a topical hair loss supplement…
Drivers for men
On the “men” side I got information about how “worried” men were about hair loss. This told me that most men were, at least, “somewhat” worried about hair loss.
Beyond that, there was valuable information about how hair loss had affected them negatively.
Finally, the most valuable information, to me, was a question of what they would give up to solve this problem (men & women). The answers were encouraging for someone who was hoping to build a business in this industry. Almost half would rather have more hair than more money. Three quarters would give up a prized possession for more hair.
While I acknowledge that I’m not marketing a guaranteed cure to hair loss, that tells me that people are willing to try anything to fix this problem. As I know from my market segmentation analysis, supplementation works for about 1 in 17 people. Not great odds, by any means. But good enough, I hope, to at least try a new product. Especially when the ingredients are all-natural and offer no downside.
Drivers for women
About half had stress prior to experiencing hair loss. That’s a coin flip. It doesn’t mean that the hair loss was caused by the stress (though it surely didn’t help). But it provides insight into what women are feeling prior to and while they are experiencing this problem.
I also included the “What they’d give up” question on the women’s side of the analysis because my source for that information didn’t specify either gender. Plus, it seems feasible that women would feel the same or even stronger. It’s my opinion that society values female attractiveness above male attractiveness.
Finally, we get down to the brass tacks. A potential cause-and-effect situation for the problem I’m attempting to address. The number of women that are currently experiencing hair loss are also (possibly) straightening/heat processing or getting their hair colored on a semi-frequent basis.
This tells me that hairstyling might play a part in a lot of women’s hair loss (this goes back to the pressure to be attractive thing). Therefore, I should consider marketing my product in salons and other establishments that focus on women’s hair.
There’s still a lot of analysis to be done. But, two steps into the process of drafting my business plan, I feel a lot more confident about my understanding of the environment.
Here’s a look at my spreadsheet with the driver information included:
Click to enlarge
Business plan demand analysis of sensitivity
To this point, the goal has been to make assumptions and get answers. We want to have a better understanding of the environment in which our business will operate. Hopefully, you feel that you’ve accomplished that.
But, we don’t do ourselves any favors by lying to ourselves.
Lying?
Well, yes. But probably not willingly.
You start off excited about your business idea. So excited that you decide to take the first step (something that the vast majority of people won’t do). You begin to write a business plan. You can feel your idea taking shape. You’ve already refined your idea a bit and feel that by the time this whole exercise is over, there’s no way you can fail. You’ve got momentum and your confidence keeps increasing.
That is all very good. Confidence is key. But, if everything looks rosy, you might be blind to a risk that could put your baby in jeopardy.
So, I don’t want to be a killjoy. But, for the sake of our businesses, let’s take a step back and play devil’s advocate. We need to ask ourselves some tough questions and challenge our assumptions. If we can rise to these challenges, and address them with confidence, our chances of success are that much greater.
Go back through your segmentation and demand drivers and think critically about this information. Some statistics might be a given, without much wiggle room. Others might be misrepresentative of reality. In these instances, tap into your inner cynic.
Make notes of what the worst-case scenario might look like. If you’re using a spreadsheet, like me, maybe use a different colored text. Address things like survey questions that might have been misinterpreted or alternative explanations for results.
Don’t get too down-and-out here and don’t dwell on this step too long. You don’t have to necessarily plan what you would do if these worst-case scenarios came to be. You just need to imagine them so that when the time comes for serious planning, you can take these risks into consideration.
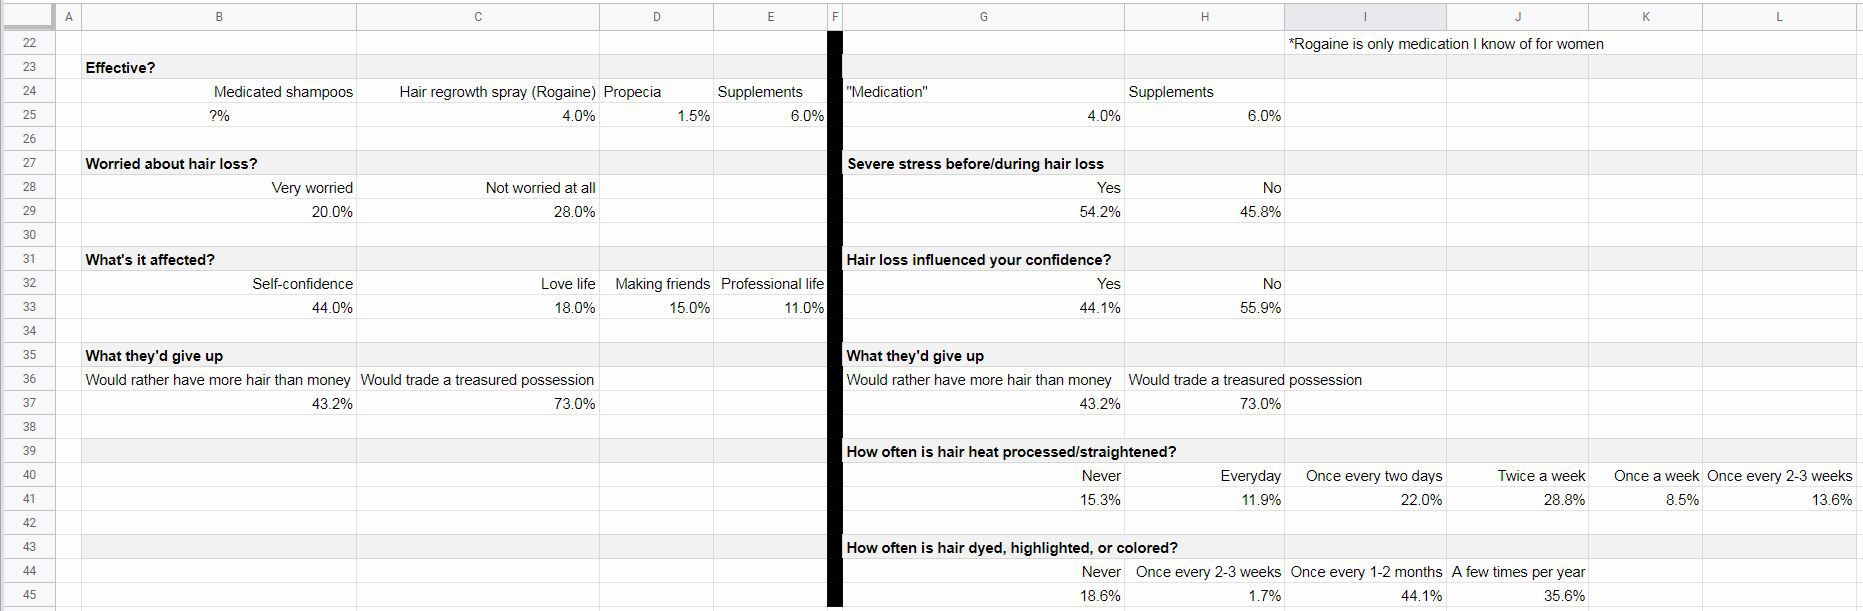
Demand sensitivity for my product
Demographics
I think my categorization by demographics is pretty safe. It’s rather well established how many men and women experience hair loss. The only thing that I might tweak is the number of men and women who have had hair loss and tried treatment. I lowered those estimates by 20%. It could be that the respondents’ interpretation of “treatment” is to comb their hair a different way or to shave their heads rather than to buy a product to battle hair loss.
Furthermore, what if the number of people that have “done anything” is lower? What if I misinterpreted the question for women that asked: “Do you take medication to prevent hair loss?” Maybe it was 20% of women who actually had hair loss rather than all women? The effect of that would be dramatic.
Substitute products
What if the alternative treatments were more effective than I’ve been led to believe? It could be that the respondents only consider “effective” to be a restoration to a full, thick head of hair? Also, just because they consider them ineffective, it doesn’t mean that they’ll stop using them. They might think that all of their hair will fall out if they stop (which could work in my favor, though). Perhaps they were overly optimistic when it came to supplements? It could be that supplements gave them other benefits, but didn’t make their hair loss any worse – so they considered them “effective.”
Drivers
Could it be that fewer men are really “(very) worried about hair loss” than I’m led to believe? Are more are “Not worried at all?” Plus, it might be that those who are only “somewhat worried” aren’t motivated to do anything about it.
As far as confidence (love life, making friends, professional life) goes, it might be that that hair loss is a contributor to low confidence, but not the primary driver. Maybe they’re overweight or socially awkward and that’s why they lack the confidence they desire?
As far as “what they’d give up” it could be that the respondents were primed by the hair loss questionnaire to be more self-conscious than they usually are. If it came down to it, perhaps not so many would be willing to part with valuables to solve this problem.
Finally, as far as hair styling being a cause of hair loss in women, it could be that I am wrong. Maybe hair styling has no effect on hair loss. Or, maybe women overestimate how often they heat process or color their hair. It only feels like every day/once every 2-3 weeks. When, in fact, they do it a lot less often.
Okay, that’s enough pessimism. It seems unlikely that every worst-case scenario would be true. But, there’s probably a mix in there between my initial interpretations and the not-so-great ones.
This exercise should help me going forward to make realistic forecasts and assumptions. Which, in turn, should help me be proactive to some of the challenges I might face.
Here’s a final look at my spreadsheet with my worst-case notes in blue:
Click to enlarge
Business plan demand analysis
This step takes a little bit of thought and a decent amount of research. This is done to give you a deeper understanding of the market you hope to compete in and the customers you hope to sell to.
What other steps would you have taken to refine estimates of demand?
Do you think my demand sensitivity was rational? Or, was I taking it too easy on myself?
Download the free template by filling out the form below
Estimate the amounts and timing of cash inflows
Forecast the amounts and timing of cash outflows for expenses and capital projects
Determine a desired ending cash balance for every month in the planning period
Factor in the effects of short-term and long-term financing
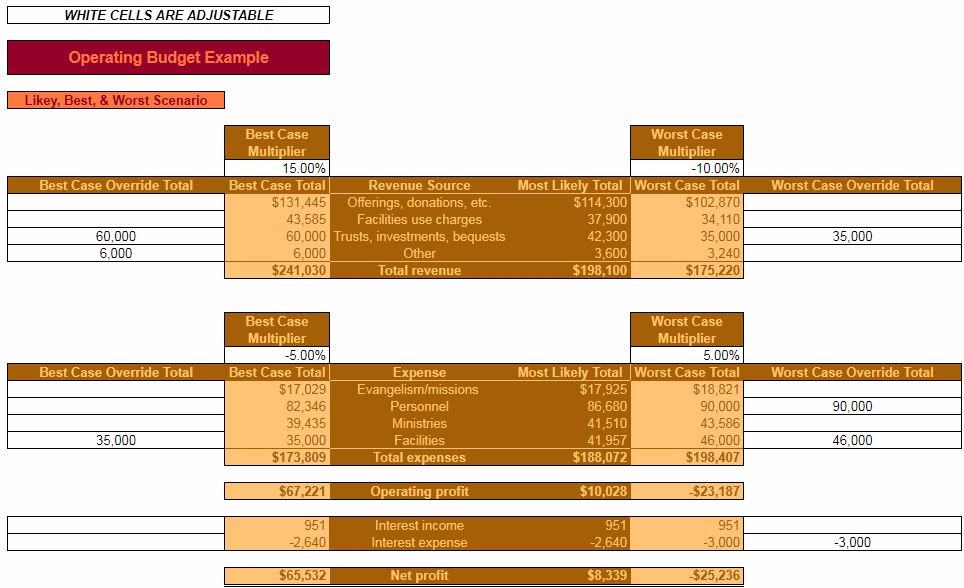
Analyze the most likely, best-case, and worst-case scenarios in your financial statements
Get your copy of the church financial budget template
Complete the form below and click Submit. Upon email confirmation, the workbook will open in a new tab.
Sample church financial budget to help your congregation reach its goals
All right, we finally made it! This is the third post on church budgeting. It’s also the sixth, and final, post on church strategic planning. Yes…this is long overdue.
Capital budgeting for churches was addressed previously. As was creating an operating budget. The capital budget involved the forecasting of cash inflows and outflows from the installation of a new parking lot. The operating budget involved estimating revenue and expenses to arrive at a pro forma (estimated) income statement.
The financial budget builds off of the operating budget. It allows your church to estimate the timing of cash inflows and cash outflows. Doing so will help ensure that your church doesn’t run up against a cash flow crunch throughout the coming year.
Yes, strategic planning is time-consuming and labor-intensive. Never more so than the first time you do it. For the church that is serious about ensuring the ongoing fulfillment of its mission, it is time well spent.
What is a church‘s financial budget?
A church financial budget walks through the expected timing and amounts of cash receipts and expenditures over the course of the next year. Churches are in a unique (and somewhat enviable) position since most of their revenue comes from donations. They typically receive cash instantly.
One exception, for the church, might be Facilities use charges, or something similar. Revenue like this is often paid in advance to reserve dates and times. Since the cash comes in earlier (typically) than when the service is delivered, there could be a situation where cash flow and revenue recognition are different.
On the cash disbursement side, a church faces a lot of the same issues as a for-profit business. The recognition of expenses could be different from when the actual cash leaves the church’s checking account.
The church’s Cash Collection Schedule and Cash Disbursement Schedule will come together into a Cash Budget. It is here that the church will have the opportunity to adjust the Desired Ending Balance. And to make any tweaks to Short-term or Long-term Financing arrangements.
Everything culminates with Pro Forma (expected) financial statements. Just as with the operating budget. This allows the church to compare where they start the year with where they end it. With this information, Ratios can be calculated. More importantly, needed action can be taken to hedge potential problems.
Also, a chart illustrating the month-to-month changes will be available. Also, your church will have the opportunity to play with best-case and worst-case scenarios.
The importance of a church financial budget
Cash is the lifeblood of a business, and a nonprofit organization is no exception. All strategic planning plays an important role in preparing for the future. However, none of the steps may be more important than the financial budget.
Failure to plan for potential shortfalls in cash could mean shuttering the doors. I could mean forever forgoing the opportunity to lead your congregation to the achievement of its mission.
How does a church’s financial budget differ from an operating budget?
A financial budget forecasts cash flow in and cash flow out. An operating budget, if you’ll remember, forecasts revenue and expenses. The difference might seem negligible, but there are some important distinctions.
Operating at a loss in a particular month (e.g. having more expenses than revenue) won’t necessarily constitute a crisis in your church. It can’t go on forever, but if it’s a short-term problem, you should be able to push through it.
But, having more cash go out than comes in during a given month will obviously deplete your cash on hand. Beyond that, if the difference is big enough, and goes on for long enough, your church will be in real trouble.
Cash is king
You don’t pay your bills, or your employees, with numbers on a spreadsheet. As great as spreadsheets are, they can’t do that for you. You pay expenses with cash. So, even if things look good on a spreadsheet or a financial statement, if the cash isn’t there, problems could start compounding.
Over the long-term, the amount of revenue should equal the amount of cash flow in, more or less. Likewise, the amount of expenses should equal the amount of cash flow out. It’s all a question of timing.
An operating budget is important to make sure that your church stays financially healthy for the upcoming year. A financial budget is important to make sure that your church stays solvent from month to month.
One more important distinction is that a financial budget (specifically the cash budget) takes into account things that the operating budget does not. For example, capital projects, financing, and investments. I’ll illustrate the effects of these sorts of things later in the post.
How does a church financial budget differ from that of a for-profit company?
A financial budget for a church versus a financial budget for a for-profit company will differ in a couple of ways.
On the cash collection side, a lot of a church’s revenue is recognized at the same time the cash is collected. The same is not true for your typical for-profit company. The exception, for a church, might be a facilities use charges, or something similar. The timing of cash receipt and revenue recognition being so close together make the cash collection side of a church’s financial budget a little bit simpler.
The cash disbursement side of things will be similar to a for-profit company. Bills are bills after all. When expenses hit versus when they’re paid could be very different. Additionally, capital expenses, if applicable, will require big chunks of cash to be spent at one time. Just as is the case with for-profit companies. Conversely, though, income taxes are a non-factor for churches.
Other factors will be similar between a for-profit company and a church when it comes to financial budgeting. The church may still require short-term and long-term financing. Also, it may put its money into separate savings or investment account, just as a for-profit company would.
So, it stands to reason, that there are a couple of minor differences between the two. But, all in all, financial budgeting is just as important for churches, and other nonprofit organizations, as it is for their for-profit counterparts.
Why should you have a church financial budget?
The reasons for your church to have a financial budget for the coming year are the same as the reasons for doing any other step in the strategic planning process. These sorts of things are done to force you to think about what the future might hold. That way you can best position your church for success.
If your church runs out of cash midway through the year then its very existence might be at stake. Even if your church just gets into a cash flow crunch, that could start a chain of events that might keep it from realizing its full potential.
Certainly, drafting a financial budget and going through all of the steps of the strategic planning process isn’t going to guarantee that your church won’t fall upon hard times. However, it will probably lessen the length and severity of the hard times. Plus, when the hard times do come, then you’ll at least know you’ve done everything in your power to protect your church and to ensure its ongoing success.
One more benefit is the ability to plan long-term and short-term financing. Since these two factors play a large part in the amount of cash flowing in and out of your church, they should be scrutinized. The financial budget allows you to prepare and make arrangements for financing needs well in advance of the time that they become critical.
How to create a church financial budget
Creating a financial budget starts with a forecast of the timing and amounts of cash inflows from revenue sources. As mentioned earlier, since many of a church’s typical revenue sources are of the sort that collects cash immediately – this could be a pretty easy step in the process.
On the cash outflow side, each expense category from the church operating budget will be looked at separately. Each will be unique in terms of when the cash is expected to leave the church. Additionally, this is where capital expenditures will be entered. If you’ve done a capital budget for your church, then you should know the total amount expected to be spent. It’s just a matter of entering the timing.
The cash budget will bring together the Cash Collections Schedule and the Cash Disbursements Schedule. Also, here, you’ll be able to determine a Desired ending cash balance for every month. Beyond that, information about long and, short-term financing will need to be entered.
Everything entered previously culminates in a Pro Forma Balance Sheet and Cash Flow Statement. Along with the Pro Forma Income Statement from the operating budget, you’ll have a complete set of forecasted financial statements for the coming year. Anytime there are financial statements, you can expect there will be Ratios. The Executive Summary ends, as usual, with a chart illustrating the most relevant information from the workbook.
An opportunity is given to play with the best and worst-case scenarios. Just as was done with the operating budget. Here, you’ll have the opportunity to tweak the amounts on your Pro Forma Balance Sheet, Cash Flow Statement, and Income Statement to the positive and negative side. Accordingly, best case and worst case Ratios will also be calculated.
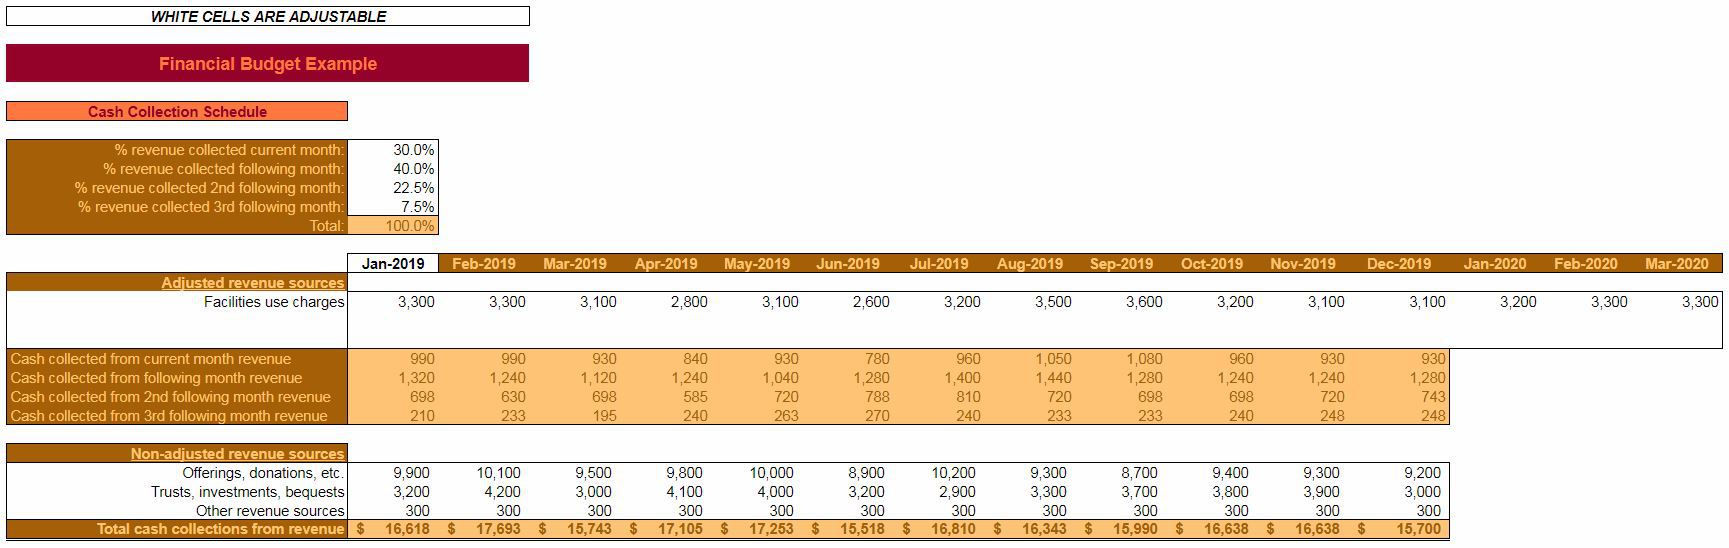
Timing of cash inflows
The Cash Collections Schedule is where you’ll enter the pertinent information regarding timing and amounts of cash inflows.
There are three general sections of information to be entered. The first is related to the timing of the receipt of Adjusted revenue sources. Here, you’ll dictate how much, percentage-wise, you expect to receive in the current month, following month, 2nd following month, and 3rd following month from your Adjusted revenue sources.
Click to enlarge
Cash collections examples
If you expect, on average, to receive half of your revenue in cash, from your Adjusted revenue sources during the same month as the “sale,” then you would enter 50% in the % revenue collected current month field. If you expect, on average to receive the other half in the next month after the “sale” then you would enter 50% in the % revenue collected following month field. The other two (2nd following month and 3rd following month) would be 0%. What matters is the Total equals 100%.
Another example – let’s say you only took a 10% deposit for Facility use charges and collected the remainder of the balance three months later. Then, you would enter 10% in the % revenue collected current month field and 90% in the % revenue collected 3rd following month.
Hopefully, this clarifies the purpose of these variables a little bit.
The remainder of the Cash Collections Schedule is where you’ll enter yourAdjusted and Non-adjusted revenue sources. Enter each separately along with the amounts corresponding to the month that the revenue is earned.
Adjusted revenue sources
Adjusted Revenue Sources are those where the cash is collected at a different time than when the revenue is recognized.
For churches, the most practical example I could think of was Facilities Use Charges. Where the church collects cash in advance for rental of its facilities.
Revenue sources such as these, are unique, however. Most organizations recognize revenue first and then the cash is collected afterward. Facilities Use Charges are unique though. The revenue isn’t technically earned until the event for which the facilities were rented takes place. But, cash is collected in advance via deposits or payment plans.
So, the revenue for Facilities Use Charges are forecasted out three months into the following year (2020). This is done because some cash might be collected in Dec-2019 for revenue that will be recognized in Mar-2020.
Below the white cells where you’ll enter the revenue sources and forecasted amounts, you’ll see that the calculations are made based on the % revenue collected from above. The percentages entered there specify how much cash will be collected in a given month from current month revenue, following month revenue, 2nd following month revenue, and 3rd following month revenue. These amounts will change depending on what’s entered in the forecasted fields for Adjusted Revenue Sources.
Non-adjusted revenue sources
Non-adjusted revenue sources are much simpler. All you do is enter your different sources on the left and the forecasted amount for each month in the coming year. Cash is collected at the time of revenue recognition. So, there’s no need to forecast out any further.
At the bottom, the Total cash collections from revenue equal cash collection from Adjusted revenue sources plus the Non-adjusted revenue sources for a given month.
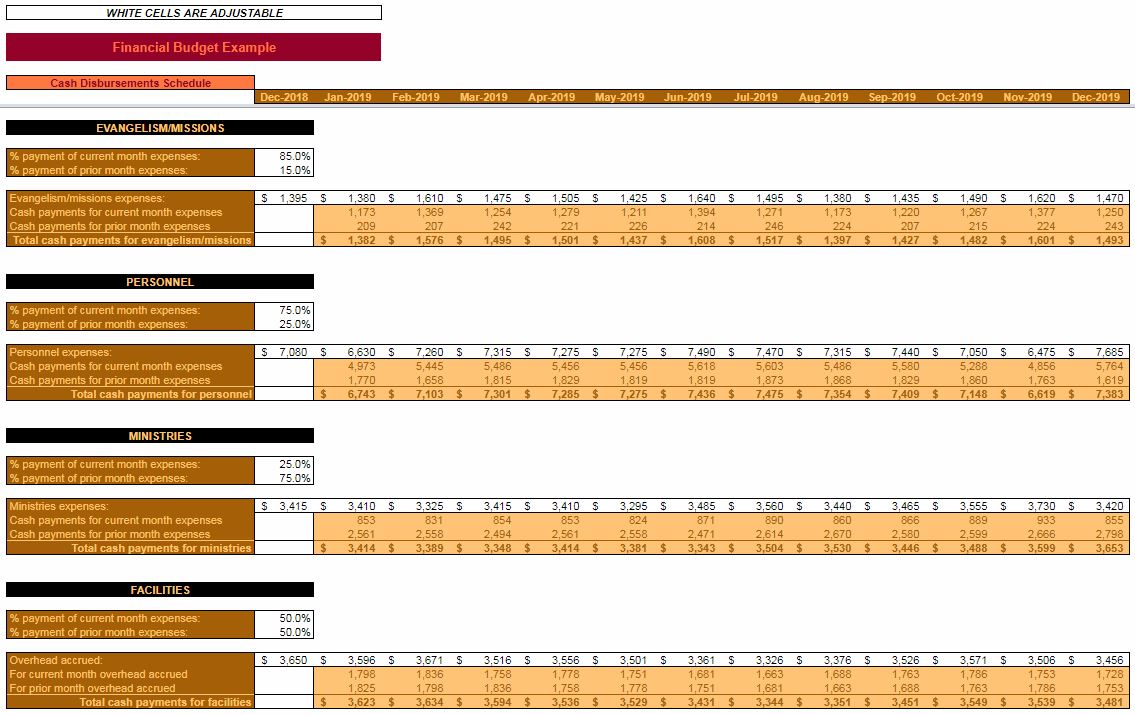
Timing of cash outflow
The Cash Disbursements Schedule is where you’ll enter information about the timing and amounts of cash outflows.
As with any organization, cash tends to leave through more avenues than it arrives. Each category of expenses (from the operating budget) is examined individually. Information from the capital budget will also be entered as it pertains to cash leaving the church.
Click to enlarge
The four categories of expenses from the operating budget are looked at independently. Granted, individual expenses within a particular category probably have different timings in terms of cash flow. But, entering each expense separately would needlessly complicate an already intensive endeavor. So, percentages are entered for each category for the % payment of current month expenses and % payment of prior month expenses.
The % payment of current month expenses refers to the percentage of that month’s forecasted expenses which will be paid with cash, in the same month. The % payment of prior month expenses refers to the percentage of the previous month’s forecasted expenses which will be paid with cash this month.
As you might expect, those percentages must add up to 100%. There’s no allocation made for expenses that will be unpaid. Since your church is reputable, and you’ve committed yourself to strategic planning (including all forms of budgeting), you’ll be well prepared for the coming year. Therefore, your church shouldn’t find itself in a situation where it can’t pay its bills.
Each category of expenses is different
The categories are pretty general. Hopefully, they are indicative of the types of expenses that your church faces. Of course, if you were making a financial budget from scratch, you might do things somewhat differently.
Once you’ve settled on the timing of cash flows, it’s time to enter the forecasted expenses for the last month of the current year through the last month of the planning (next) year. The reason that expenses are entered for the last month of the current year is because of the % payment of prior month expenses field. We must know how much cash is going to leave the church in January, because of December expenses.
The relevant cash flow amount is automatically calculated for each month and totaled by category.
Flashback to the capital budget
Think back to the capital budgeting for churches post that I wrote a couple of months ago. You might remember that the plan was for our hypothetical church to add 53 parking spots in the coming year. They planned to do this because the congregation was growing and they need additional capacity for parking.
You might also remember at the expected initial cost for this new parking lot was $208,000.
Click to enlarge
As you can see, in accordance with the capital budget, our example church expects to make three payments of $69,333. We’re assuming that, for this construction project, payment will be made in three equal portions over the three months it takes to start and finish the parking lot.
Our hypothetical church isn’t so big that it can disregard the spending of over $200,000. So, obviously, we needed to work that into the financial budget. The capital expenses section of the Cash Disbursements Schedule is where that’s done. This information will now carry over to the Cash Budget. This is where planning can be done for financing, if necessary.
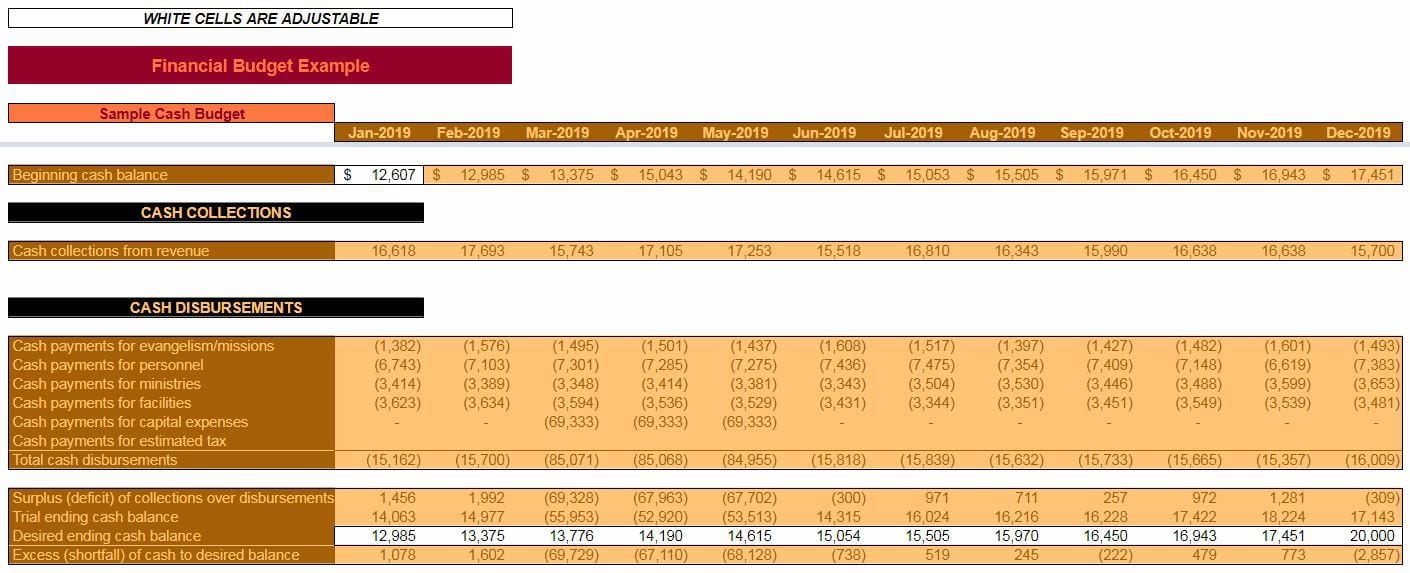
Creating a cash budget
The Cash Budget brings together information entered in the Cash Collections Schedule and the Cash Disbursements Schedule. In addition, financing, both short and long-term are addressed; as are investments.
This is where you will forecast your actual cash balances throughout every month in the planning year. Only a few fields need to be entered. Most of what is analyzed in the Cash Budget is based on the previously entered information.
Click to enlarge
Logically, the first bit of information to be addressed in the Cash Budget is your Beginning cash balance. This will need to be entered for the first month of the planning period. You will probably have to forecast this amount if you are (as you should be) planning several months in advance. Don’t worry, as the time gets closer, this amount can be changed and, just as with any of these planning tools, tweaks can be made
From that point on, the Beginning cash balance is automatically calculated. Because, of course, the Beginning cash balance for any given month is going to be the same as the Ending cash balance for the previous month.
Cash collections and disbursements
The cash collections and cash disbursements sections will each pull from their respective Schedules – with a few exceptions.
Surplus(deficit) of collections over disbursements = Cash collections from revenue – Total cash disbursements
This amount represents the difference between cash collections and cash disbursements in a given month. A positive amount means that more cash was collected than dispersed. A negative amount means the opposite.
Notice that the months where cash payment is made for capital expenses – the deficit is rather large. This is to be expected and will be addressed more in-depth later in the worksheet.
Balancing cash
Trial ending cash balance = Surplus(deficit) of collections over disbursements + Beginning cash balance
The Trial ending cash balance represents the change in your church’s cash balance based on the Beginning cash balance, Cash collections from revenue, and Total cash disbursements. There might be situations where this amount is considerably less than you would like it to be (particularly if it’s negative). On the other hand, there might be situations where this amount is more than you need it to be. Situations where you’re holding more cash than you would like, or is necessary.
The amount of cash you want your church to hold at the end of any given month is specified in the Desired ending cash balance field. An amount will need to be entered for every month of the planning period.
This is the amount that the Cash Budget will force balance to, based on the formulas in the worksheet. Forcing is done by increasing cash with investments, short-term financing, or long-term financing. If you don’t like how the balance was forced, then you will have the opportunity to make changes later in the worksheet that are more to your liking.
Excess (shortfall) of cash to desired balance = Trial ending cash balance – Desired ending cash balance
This amount tells you how close or far away your church is, based on the Trial ending balance, to your Desired ending cash balance.
Positive amounts will either go towards paying down debt, or it will go to an investment account. Conversely, negative amounts will either be covered with debt or will be pulled from investment accounts.
Let’s look more in-depth into financing and investments…
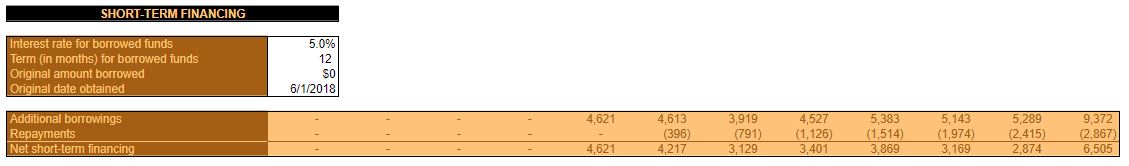
Short-term financing needs for your church
Short-term financing is a fancy term for money borrowed for less than one year. Typically, short-term financing is used for short-term cash flow issues.
In this example, we assume that the short-term financing is a revolving line of credit which allows the church to borrow moderate amounts of cash in order to cover the occasional cash flow shortfall.
Click to enlarge
You’ll also have the opportunity to enter the particulars about any existing short-term loans your church has outstanding. The rate and term entered for existing loans are assumed to be the same for any additional loans taken out through the remainder of the planning period.
Information entered for existing short-term loans is pretty straightforward. Simply enter the Interest rate for the borrowed funds, the Term (in months) for borrowed funds, the Original amount borrowed, and the Original date obtained.
Keep in mind, this is short-term financing. So the Term (in months) for borrowed funds should be less than or equal to twelve. Anything more than twelve months would be considered long-term financing.
If your church has no outstanding short-term loans, then enter $0 in the Original amount borrowed. Also, keep in mind that the Original date obtained for short-term financing needs to be within a year of the first month of the planning period in order to affect cash flow.
When will short-term borrowing take place?
As mentioned earlier, short-term financing is assumed to cover any shortfalls in cash not covered with long-term financing. It’s also not assumed to be covered with cash pulled out of investments.
The formula for Additional borrowings looks at the Excess (shortfall) of cash to desired balance, Repayments for existing short-term financing, Additional borrowings for long-term financing, and Repayments for long-term financing. If these amounts are less than zero, then additional short-term borrowing is needed.
If that’s the case, enough will be borrowed to cover the Excess (shortfall) of cash to desired balance. Repayments for existing short-term financing, and Repayments for long-term financing minus the amount that’s able to be pulled out of investments. In this workbook, it’s preferable to pull money out of investments rather than borrowing additional funds.
The calculation for short-term financing Repayments is too complicated to cover in detail. It’s calculated in a background worksheet. What this field looks at, is the Original amount borrowed, and any Additional borrowings from previous months. The total of the payments for all those short-term borrowings is displayed here. So, if additional short-term borrowings take place in a given month, the following months you will see an increase in negative cash flow due to the increase in payments owed
Net short-term financing = Additional borrowings + Repayments
This is the total effect on cash flow from activity in short-term financing for a given month. If more is borrowed than is repaid then this will be a positive amount. That’s because more cash came into the church than left it. If Repayments are more than Additional borrowings then this will be a negative amount. More money left the church than came in, due to short-term financing.
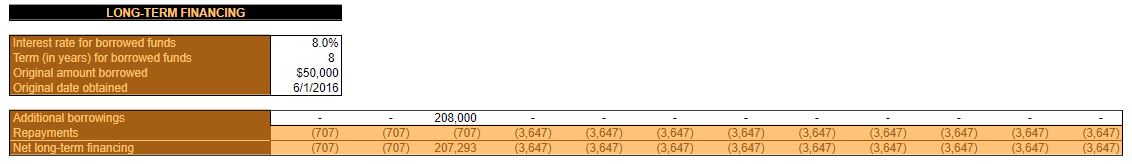
Whereas short-term financing covers borrowing money for less than one year, long-term financing covers borrowing money for more than one year. Long-term financing is typically used for long-term projects. For example, projects that have been approved during the capital budgeting phase of strategic planning.
In this example, we assume that long-term financing is used sparingly. It is not a revolving line of credit. Loans are repaid on an installment basis. Since loan amounts are typically big, Repayment amounts are also big.
Also, like short-term financing, you’ll have the opportunity to enter information about any existing long-term loans. The interest rate and term for the existing loans are the rate and terms presumed for any Additional borrowings entered throughout the year. This is unlikely to be exactly the case, admittedly, but for sake of this example, it is adequate.
Click to enlarge
For long-term financing currently outstanding, an Interest rate for borrowed funds, Term (in years) for borrowed funds, Original amount borrowed, and Original date of obtained must be entered.
Since this is long-term financing, ensure that the Term (in years) for borrowed funds is greater than or equal to “1.” Anything shorter than a year belongs in short-term financing.
If your church currently has no long-term loans, enter 0 in the Original amount borrowed. If the Original date obtained is further in the past than the Term (in years) for borrowed funds, then the Repayments for the existing loan will not show up in this year’s cash budget. Because… of course, the loan would already be paid off.
Additional borrowings
Additional borrowings for long-term financing are (typically) only done for long-term projects. Therefore, these amounts have to be entered manually. If capital projects are being financed with long-term debt, then you would probably want the Additional borrowings to coincide, roughly with the Cash payments for capital expenses.
Repayments for long-term financing are also calculated in the background. They reflect any existing loans outstanding at the start of the planning period. Plus, any Additional borrowings taken out during the planning period are reflected as increased Repayments in the months that follow.
Net long-term financing = Additional borrowings + Repayments
Net long-term financing is the total effect on cash flow for a given month in regards to long-term borrowings. When money is borrowed, the amount will usually be positive. As money is repaid the amount will be negative.
Using an investment (or savings) account
The investments account, for the purposes of this example, was created to help our hypothetical church always close the month near its Desired ending cash balance. Your church may or may not have a separate investment account, and that’s fine.
In theory, though, it wouldn’t hurt. Many times, on a Balance Sheet, cash and equivalents are grouped together. An investment account such as this might qualify as the “equivalent” to the cash that’s actually in the checking account. It is a place where you could invest excess cash that is relatively risk-free, and liquid (the term liquid, if you’re not familiar, means that it could easily be converted into cash).
Some examples of where you might park your church’s savings or investments are: money market accounts, CDs, short-term treasury bills, or something similar. The amount of return you’re going to earn on those investments isn’t going to be astronomical. But, you’re in the business of running a church, not a hedge fund. So, as long as the money is safe and earning a little bit of a return – that should be adequate.
Click to enlarge
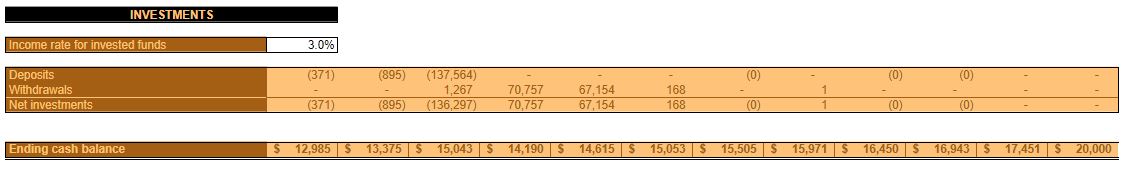
The only field that needs to be entered in the investment section is the Income rate for invested funds. This is the annualized growth rate of monies that are in your investments accounts. The calculation for the balance in the investment account takes place in the background. It does take into account dividends and interest that would be earned in such an account. Income earned from investments is available for future withdrawals.
About the timing deposits and withdrawals from investments
The investments account looks first at the Excess (shortfall) of cash to desired balance. Next, it looks at short-term financing and long-term financing. Any excess cash is entered as a Deposit into the investments account. Conversely, Withdrawals from the investments account are made when the Excess (shortfall) of cash to desired balance and Repayments for both long-term and short-term financing are negative.
Since Withdrawals does not look at Additional borrowings, there might be situations where a Deposit and Withdrawal are made within the same month. A Deposit for excess money borrowed and Withdrawal to cover the Repayments.
Deposits are represented as negative amounts. This is because, technically, they come out of cash. Withdrawals are represented as positive amounts. They represent money put back into the checking account in order to achieve the Desired ending cash balance. Obviously, since the investments account is an asset for the church these negative and positive amounts don’t necessarily represent an increase or decrease in the church’s equity.
Net investments = Deposits + Withdrawals
This is the total amount that the cash balance has changed for a given month.
The ending cash balance
Ending cash balance = Trial ending cash balance + Net short-term financing + Net long-term financing + Net investments
Of course, as mentioned earlier, the Ending cash balance will be the Beginning cash balance for the following month. This is where the church forecasts its cash balance will end up at the end of the month. This amount should approximate the Desired ending cash balance.
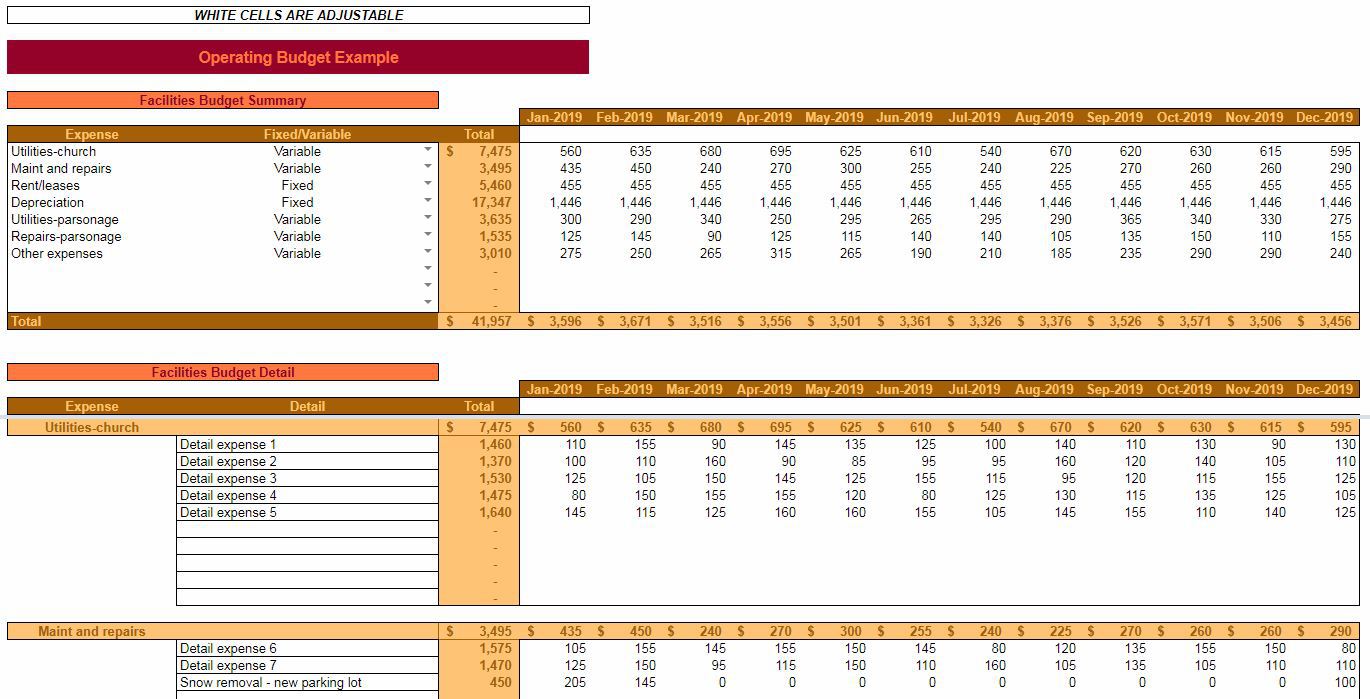
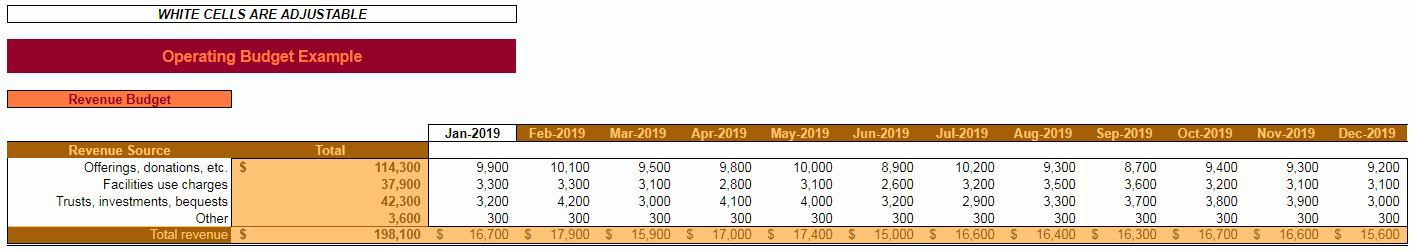
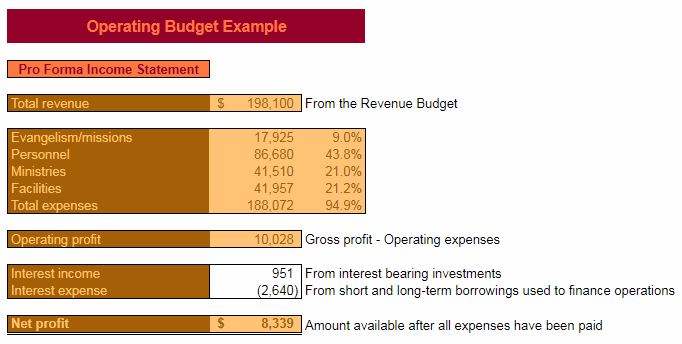
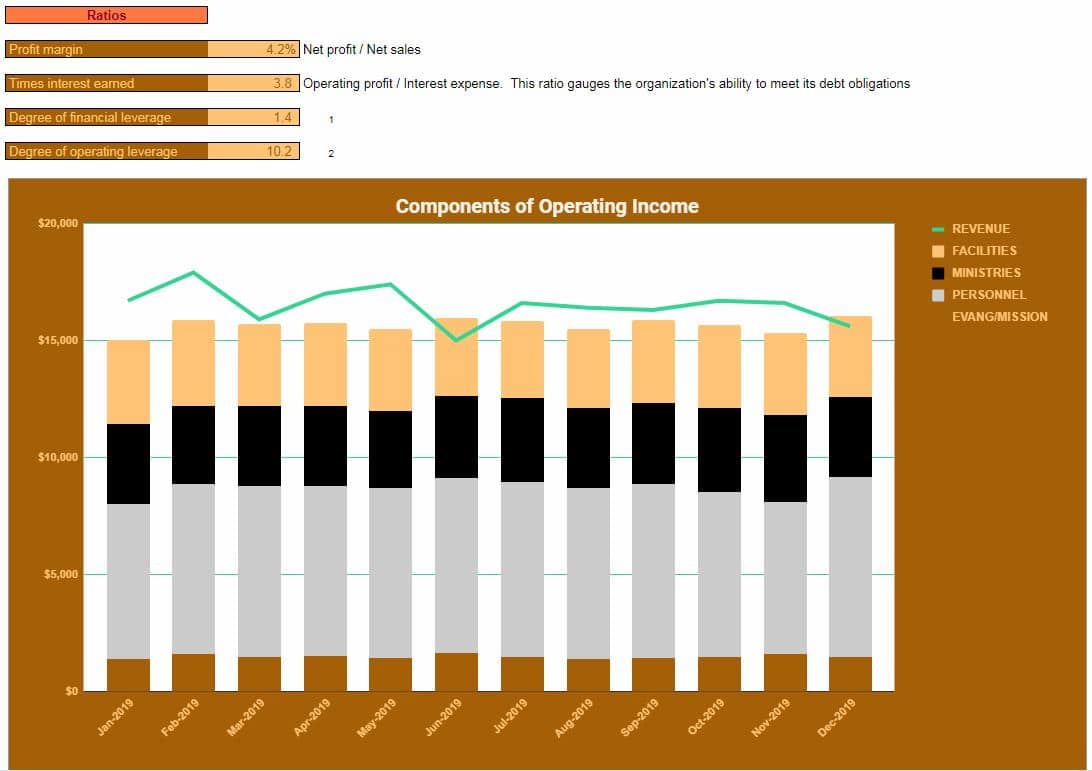
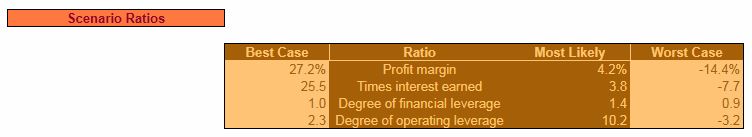
00:00 I’m gonna go over how to go about making 00:04 operating budget for your church some of 00:06 my previous videos you know I’ve done a 00:08 little more in depth with the individual 00:10 spreadsheets and how you know what each 00:12 field is about how its calculating 00:14 everything this time I’m going to try 00:16 something different I’m gonna stick to 00:18 kind of summarizing here and I’m gonna 00:19 put a link down in the description where 00:21 you can read the whole in-depth post 00:24 that covers every single aspect you know 00:27 in detail of the operating budget for 00:30 your church and the video here is just 00:32 gonna be kind of a summary so that being 00:34 said let’s get into it 00:36 we’ll start off here with a ordinarily 00:41 with a for-profit company you always 00:44 start with a revenue budget with the 00:45 church you have a little flexibility 00:47 there you start with a revenue budget or 00:48 with your expense budget so for the sake 00:52 of simplicity I’m going to walk through 00:54 this starting with the revenue budget 00:55 but you know it really is a matter of 00:59 private preference do to kind of 01:01 churches unique situations so revenue 01:04 budget is exactly what it sounds like 01:06 it’s a budget in a forecast for all of 01:08 the money you’re gonna bring in for the 01:10 year so in this case we’ve got the 01:13 different sources listed here offerings 01:15 donations facility whose charges trust 01:18 investments and other okay and we reject 01:21 them out for every month for the coming 01:23 year but the first month of our planning 01:25 period here so if you’re planning 01:27 creative begins in July or September or 01:29 whatever some other month with that in 01:32 there it’ll automatically populate it 01:33 out and all the forecasted amounts are 01:38 total by month and total by source also 01:42 point out real quick that all 01:44 spreadsheets for business templates 01:46 which there’ll be a link to the template 01:49 in the link to the post so you get that 01:53 by going to the post but all 01:56 spreadsheets for business workbooks the 02:00 white cells are adjustable okay the 02:02 colored in cells or other formulas or 02:03 their text so unless you really really 02:05 know what you’re doing don’t touch those 02:07 so revenue budget is pretty simple and 02:11 we’ll move on to the expense budgets now 02:16 let me get rid of the fixed cells here 02:21 there’s separate expense budgets for 02:25 each of the four kind of broad 02:26 categories of expenses the inspiration 02:29 for these categories comes from Bree mal 02:31 FERS if you’ve done any searching on 02:33 YouTube or on the web in regards to 02:36 Church strategic planning you’ve come 02:37 across 02:38 Audrey’s work and he’s does a great job 02:42 and you know definitely a good source of 02:47 information I’ve never seen him put 02:48 forth anything like this not to say that 02:50 he hasn’t that I used a lot of his 02:54 inspiration in creating this template 02:57 for budgeting so now he breaks it church 03:02 expenses into four broad categories 03:04 evangelism emissions personnel 03:06 ministries and facilities so as you can 03:09 sing along the bottom here that’s 03:10 exactly what we’ve done 03:12 each of these four budgets is formatted 03:15 in the same manner so for simplicity 03:17 sake we’ll just look at the evangelism 03:21 and missions budget here so what you got 03:26 at the top here is you know basically 03:29 when it would take those broad 03:30 categories expenses and break them down 03:31 into subcategories so do that first and 03:35 foremost for the evangelism missions 03:36 here and direct and Synod support 03:39 Convention Assessment local mission work 03:40 outreach etc of course each broad 03:44 category has its own separate sub 03:48 categories you came and you’ll notice 03:52 also you’ll have to fill those in 03:54 manually and also you’ll notice that 03:56 each bra subcategory of expenses gets 04:03 category wrap categorized as fixed or 04:06 variable and simply put the post goes in 04:11 a little more detail but you know fixed 04:14 is gonna be the same no matter your 04:16 level of revenue a more revenue less 04:19 revenue you would expect this expense to 04:21 stay the same 04:22 variable on the other hand you would 04:24 expect to increase with revenue and 04:25 decrease increase in decrease with 04:28 revenue less revenue less expense more 04:29 revenue more expense okay so you’ll see 04:32 that all these amounts are filled in 04:34 here a lot of them with zeros because 04:36 there’s a room for plenty of 04:38 subcategories well where’s that 04:39 information come it comes from down here 04:41 below this is where you get into the 04:42 detail okay so you’ll notice each sub 04:45 categories listed here and you can 04:47 detail expenses and this is where you 04:48 actually put in the inmense so you know 04:51 you take a broad category of expenses 04:53 break it down to subcategories break it 04:55 down further into details you know 04:58 depending on the sophistication of your 05:00 accounting software or your accountant 05:04 you know this could be these detailed 05:06 expenses here could be individual GL 05:08 accounts or whatever you want them to be 05:11 but as long as you address all expenses 05:14 that’s all that really matters it’s just 05:16 like I said kind of breaking things down 05:18 here into manageable chunks to where you 05:22 can forecast them out for every month in 05:26 the planning period then they’ll total 05:29 here and those totals will carry up here 05:32 okay so you’ll see like I said every 05:36 subcategory of expenses listed here with 05:39 plenty of room to entered detailed 05:42 expenses okay so you do that for 05:45 evangelism and admission you do that for 05:50 personnel do it for ministries it’s all 05:55 them all the same same format do it for 05:58 facilities so okay you better you expect 06:01 the revenue for the year then you 06:03 entered your expected expenses for the 06:07 year don’t forget like in this example 06:09 real quick here you’ll notice this ties 06:13 into the capital budgeting work that we 06:18 did – I like to make my workbooks tie 06:22 into each other so it can paint the 06:24 entire picture for you guys so that’s 06:26 what this means you know most of these 06:28 are Justin Eric detailed expenses but 06:30 this one here talks about snow removal 06:32 and it has to do with the 06:34 creation of a new parking lot that we 06:36 looked at in the capital budget so check 06:38 that video out to check that post out to 06:41 so and yeah once all expenses are 06:46 entered then that’s the biggest part of 06:51 budgeting okay all that’s going to carry 06:54 over here into your pro forma income 06:56 statement where you’ve got your total 06:58 revenue your total for each expense by 07:02 broad category okay and then we threw in 07:05 a percentage amount here 07:08 that’s a percentage of revenue if I 07:11 remember right yes it is okay just just 07:15 kind of paint the picture of what 07:18 categories are contributing most to your 07:20 expenses then we’ve got operating profit 07:23 which is revenue minus expenses one 07:27 other thing you have to fill in I mean 07:28 pro forma income statement here that 07:30 isn’t really covered elsewhere in the 07:31 operating budget is interest income in 07:35 interest expense okay so this is a will 07:39 have to be a forecast you’ll just have 07:41 to look at you know for income if you 07:44 have income earning assets savings you 07:49 know money market accounts something 07:52 that maybe earns a little more than that 07:54 dividends perhaps enter now here 07:57 interest expense it’s gonna depend in 07:58 large part on the amount you need to 08:00 borrow a lot of that will be covered in 08:02 the financial budget okay but you know 08:05 you can go ahead and do your financial 08:08 budget which I’ll cover in a later video 08:09 and a post that’s coming soon and circle 08:13 back around enter that information here 08:14 too okay you’re not gonna be graded on 08:18 your accuracy in terms of forecasting 08:20 this can be a living document come back 08:21 and change it as you need to 08:23 all right so operating profit minus 08:25 these interest expenses churches don’t 08:27 pay taxes so there’s net profit okay 08:32 there’s a couple of simple ratios left 08:34 in here that are applicable for churches 08:38 okay got profit margin which is pretty 08:39 self-explanatory you know your net 08:42 profit compared to you net sales times 08:44 interest earned looks at those 08:46 looks at interest expense and operating 08:50 profit how it relates to it degree of 08:53 financial leverage again the post will 08:54 get into more detail in degree of 08:56 operating leverage we’ll get more detail 08:58 on that too those are two interesting 09:00 concepts that basically tell you what 09:07 the based on degree of financial 09:10 leverage based on the amount of money 09:14 you borrow what effect increasing and 09:20 decreasing 09:21 operating profit would have on that or 09:25 the rather the effect you’ll have to 09:29 read the posts to get a detail because 09:30 if I start talking about it I’ll go on 09:32 for an hour here and like I said and try 09:34 to make this summary so basically the 09:39 effect of degree of financial leverage 09:41 is the effect of interest expense on 09:45 profit degree of operating leverage is 09:47 the effect of fixed expenses fixed costs 09:52 on profit okay and that’s why I asked 09:56 you guys to specify whether costs are 09:59 fixed or variable here okay so that’s 10:01 what that was for read more about that 10:03 like I said you’ve got the chart down 10:06 here pretty straightforward just an 10:08 illustration of what happens month by 10:10 month based off of your forecast you’ve 10:12 got the Green Line is revenue and then 10:15 you’ve got your different categories of 10:16 expenses here you can see how they rise 10:18 and fall in total and by categories so 10:22 one little extra bonus that I like to 10:26 add to my industry specific spreadsheets 10:29 is this likely best case worst case 10:33 scenario okay I think this is super 10:36 valuable you know and it’s it is another 10:39 step and the whole strategic planning 10:43 thing which is time-consuming in that 10:44 bed really is just the like I said the 10:50 plus one however you want to put it to 10:53 to the operating budget this is where 10:56 you know you’ve done you’ve been in put 10:58 your 10:59 expected revenue cost profit etc now you 11:02 get to toy with what the worst case 11:04 would be in the best case would be and 11:06 this just like most of strategic 11:08 planning 11:09 just get your mind working in that 11:10 direction so you’re you’re completely 11:14 comprehensively prepared for the 11:15 upcoming year okay so it starts off here 11:19 with the pro forma income statement 11:26 that’s what this is sure if it Proform 11:28 in there but yeah it’s a pro forma 11:31 income statement or rather this yeah 11:35 sorry okay so this is revenue up here 11:37 where you can toy with best cased amount 11:40 for each revenue source 11:45 worst case amount or you can just use a 11:48 generic multiplier okay so basically 11:52 what that means it’s like if I change 11:53 this worst case is gonna be negative in 11:55 the case of revenue the 15% you’re gonna 11:59 see these worst case amounts decrease 12:03 okay because I made the worst excuse me 12:08 in the worst case that much worse 12:10 okay but you have so you can change that 12:15 there it will affect everything in that 12:17 section but you also have the ability to 12:20 override it okay so see if we delete 12:25 this worst case would be 38,000 versus 12:31 42,000 for trust investments in the 12:34 quest but you know say you think no no 12:38 worst case could be worse than that or 12:40 worst case wouldn’t be quite as bad well 12:43 then you just override that amount okay 12:46 everything else is based off of this 12:48 multiplier but now you’ve overwritten it 12:51 with an amount so same same principle in 12:55 the best case I’d come down here to 12:58 expenses we have our abroad expense 13:00 categories again use a multiplier this 13:04 is just a ballpark figure the multiplier 13:06 basically if you know best-case in the 13:10 Fuhrer expects is going to be the 13:11 decrease 13:12 worst case for expenses gonna be the day 13:15 increase and I keep doing it 13:17 so keep that in mind and you can 13:20 override you don’t like what you see so 13:22 yeah just toy with it you know that’s 13:25 the whole point of this exercise just 13:28 toy with it see what playing with 13:32 different scenarios gives you what it 13:35 makes you think about what you might do 13:37 to plan to avoid a worst case what you 13:39 what planning you might do to take 13:41 advantage of the best case okay so just 13:44 like the pro forma income statement on 13:45 this executive summary 13:47 you got your operating profit here you 13:50 can see negative under worst case this 13:54 will match what’s on the executive 13:55 summary the ten thousand twenty eight 13:58 operating profit and best case 14:05 considerably better six times the 14:07 operating profit so that’s pretty good 14:10 it brings in interest income and expense 14:14 here also and then that profit always 14:20 calculated the exact same as it is on 14:21 the executive summary so then of course 14:25 the you know the whole purpose of ratios 14:26 is to kind of put amounts into 14:31 perspective from your financial 14:34 statements and the same thing takes 14:36 place here you know profit margin can 14:38 range from negative seventeen point 14:41 eight to twenty seven positive twenty 14:43 seven point two times interest earned 14:45 degree of financial leverage is going to 14:48 change all that it’s gonna going to 14:50 change based off of what you enter in 14:52 the best case in worst case fields above 14:57 some anyhow that’s quick rundown of the 15:01 church operating budget template you 15:04 know go get your own copy to toy with I 15:06 get his follow the link and there’ll be 15:10 a links on there follow a link to the 15:13 post there’ll be links on there to 15:14 download your own copy of it and then 15:16 you know you if you’re dealing with 15:18 concepts you’re not familiar with just 15:20 check out the post I’ve got more or less 15:22 every single field on here 15:24 addressed in there and you know if you 15:28 get stuck on something just check that 15:30 out and it’ll help you make sense what 15:33 you’re looking at so appreciate you 15:35 guys’s time appreciate you watching this 15:39 video if you have until this point the 15:41 very end YouTube it is a popularity 15:45 contest just like anything on the 15:47 Internet and if you like this video if 15:50 you think this seems like something 15:51 useful to you best way to let me know is 15:55 to either leave a comment down below or 16:00 better yet maybe I don’t know depends on 16:03 the YouTube algorithm comments are good 16:06 likes or good subscriptions are good I 16:08 know 16:10 alerts are good any of that stuff you 16:13 know I’ll feedbacks good I’ll crank out 16:16 more content there’s also a lot of stuff 16:19 to check out not just for churches but 16:22 for small businesses in general on 16:23 spreadsheets for business comm thanks 16:26 you guys take care
Download the free template by filling out the form below
Categorize and list detailed expenses
Forecast revenue needed to cover expenses
Review the pro forma income statement and ratios
Plan for the best and worst-case scenarios
Download the church operating budget template
Complete the form below and click Submit. Upon email confirmation, the workbook will open in a new tab.
Operating budget example for small churches, big churches, and every church in between
This is the second post on church budgeting and the fifth overall on church strategic planning.
Previously, the capital budget for the church was covered in depth. This post will focus on the operating budget. The capital budget, if you’ll remember, is the budget that the church completes for every potential project it plans to take on in the coming year. The operating budget consists of a forecast of revenue and expenses for the coming year. The culmination of the operating budget is a pro forma (or expected) income statement.
After completion of the capital budget and the operating budget, the church will be ready to tackle the financial budget. The financial budget will be covered in the next post.
What is an operating budget for a church?
An operating budget allows a church to be proactive regarding its revenues and expenses for the coming year. It allows the church to plan accordingly and to be ready for any scenario that might come its way. Doing so will allow the church to better meet its mission.
Information gleaned from the mission statement, SWOT analysis, strategy formulation, and capital budgeting will all play a part in preparing the Operating Budget for the coming year.
Creating an operating budget can be as simplistic as writing down a guess about how much revenue the church will make in the coming year and the number of expenses it will incur. This is better than nothing.
Dedicating some thought to each revenue source and each type of expense, plus estimating how they might rise or fall over the course of the year helps to paint a more accurate picture of the church’s financial position. Additionally, using the Spreadsheets for Business church operating budget template will give you the ability to not only estimate what the most likely scenario to play out next year will be, but will also help you to plan around a best case scenario and a worst case scenario.
Download the template by filling out the form at the top of the post.
How much time and effort should be dedicated to a church operating budget?
Any amount of planning is better than no planning. There is, however, such a thing as over-planning – AKA, paralysis by analysis. The sweet spot is somewhere in the middle – enough planning for you to feel confident that your church is in a position to thrive in the coming year.
The amount of thought you dedicate to each item in this church operating budget example is up to you. I urge you not to overthink it. However, after going through the following steps, I think you’ll find yourself rather confident about your church’s future going into the new year. With some of the worry off your plate, you can focus on other areas that will help your church achieve its mission.
How might an operating budget for a church differ from a for-profit business?
Fortunately, creating an operating budget for a church is much less complicated than for, say, a manufacturing company.
When creating an operating budget for a manufacturing company, you start with revenue and work your way through budgets for materials, labor, overhead, production, and a lot of other inputs.
When creating an operating budget for a church (which is essentially a service) some of that complication can be avoided.
Should you start with budgeting for revenue or expenses?
Personally (and maybe this is due to my background in budgeting for manufacturing organizations), I still think it’s smart to start budgeting with revenue. That way, you know how much you expect to make in the coming year and can plan your expenses around that information.
However, there’s also a school of thought, particularly by Aubrey Malphurs and his organization, that claims you should plan your expenses first. Then, you know how much you need to bring in to cover those expenses. Aubrey is much more of an expert on church operations than I am, admittedly. I can see the rationale behind this school of thought.
You should start with whichever you’re more comfortable with – expenses or revenue. I imagine as you get deeper into the process of forecasting, that you’ll be bouncing back and forth between the two anyway. So, ultimately, what you start with won’t matter. Unlike a manufacturing company, the levels of your revenue and expenses won’t necessarily affect each other. All that matters is what you end up with.
Look, your budgets are never going to be exactly right. That’s fine. What’s not fine is going into the coming year with a church that is at risk because you haven’t dedicated adequate thought to what the coming year may bring.
An operating budget won’t guarantee that your church will be successful. That’s why you shouldn’t spend every waking second working on it. It’s just a matter of giving appropriate thought to the matters of revenue and expenses.
The Pareto Principle states that 80% of outputs come from 20% of inputs. If you buy into this – 80% (or so) of the benefits of creating an operating budget for your church will probably come from the first 20% of the time that you spend on it. What this means, of course, is that by merely dedicating a tiny bit of thought to these matters, your church will reap big benefits.
How to create an operating budget for your church
Operating budgets look complicated, but at their core, they’re fairly simple. All you’re going to be doing is estimating your expenses, estimating revenues, and then filling in a couple of other details. There are no wrong answers. As a steward for your church, you’re in a better position to answer these questions than anybody else on Earth.
Let’s get started!
Your church’s expenses
Obviously, your church has costs that it incurs to provide needed support to its membership. Again, I have to give credit to Aubrey Malphurs for the framework of how expenses are grouped together.
Expenses are grouped into four broad categories: evangelism/missions, personnel, ministries, and facilities.
Within each broad category, each Expense is broken down into more specific categories and beyond that, into greater Detail.
So, depending on how organized your accounting is, you should be able to (hopefully) begin by breaking your existing expenses down into these four broad categories. Once you’ve done that, then you can begin to group similar expenses by subcategories. Then eventually, of course, you want to budget for every detailed expense.
Classifying expenses as fixed or variable
Along with every Expense in a subcategory, you’re going to classify it as fixed or variable. This sounds like a pain in the rear, but it’s good to understand the nature of each cost.
Fixed expenses, as the name implies, don’t change with revenue. They’re going to be the same whether you have a very busy year or a year where you just sit around twiddling your thumbs. For example, salaries are fixed and insurance is fixed. Any other expense which will be the same month after month, over the course of the year, is fixed.
Variable expenses, on the other hand, change. They typically change based on the level of revenue. If revenue goes up, variable expenses also go up. If revenue goes down, variable expenses would probably go down. For example, expenses related to outreach and local mission work might depend, in large part, on the amount of revenue received. So they can probably safely be classified as variable.
There’s no right or wrong answer when it comes to classifying your costs as Fixed/Variable. Some will be obvious, while others…not so much. Again, don’t dwell too much on this classification. Give it a little thought and select what you think is appropriate. The only real effect is on some of the ratios that are calculated once the budget is completed. You can always go back and change your classification.
Use the past to plan for the future
You can refer back to historical amounts, of course, to help with the forecasting of future expenses. In fact, that’s probably a very smart thing to do. Looking back at historical amounts paid will also help you to determine if an expense is fixed or variable.
If this is your first time completing an operating budget such as this, then I would suggest that you still break each expense down into broad categories (evangelism/missions, personnel, etc.). But, maybe don’t break them down into too many subcategories (district & synod support, convention assessment, etc.). And, definitely don’t overdo it breaking expenses down into detailed categories (detail expense 1, detail expense 2, etc.). You can always go into more detail next year.
On each of the broad category budget worksheets, you’re going to start at the top and list each Expense subcategory. Also, pick either Fixed or Variable from the drop-down menu.
In the bottom section – this is where you’ll break the subcategories down into detailed expenses. All of the detailed expenses will sum for the month and that amount will be carried back to the top
Let’s look a little deeper into each broad category.
Evangelism/Missions Budget
Click on image to see a full-size version in a new tab.
The Evangelism/Missions Budget is where you’ll classify expenses related to efforts directed externally from the church to reach individuals who likely aren’t members.
Next, go to the detail section and itemize the subcategory expenses. Additionally, start forecasting month by month for the whole year. Each subcategory will automatically add all the detailed expenses.
You’ll see that a Total for each month and for whole the year is calculated. These amounts will carry over into other worksheets.
Personnel Budget
Click on image to see a full-size version in a new tab.
The Personnel Budget is pretty self-explanatory. This is the money planned to be spent on the individuals who help run your church.
Expenses such as salaries, fringes, utilities for housing, and guest pastors/speakers would be entered here.
Ministries Budget
Click on image to see a full-size version in a new tab.
The Ministries Budget is where you will enter expenses directed toward the individuals that are already a member of your church.
You know the drill by now – enter the appropriate subcategories and then the names and amounts for the detailed expenses.
Facilities Budget
Click on image to see a full-size version in a new tab.
The last category of expenses is also pretty self-explanatory. A Facilities Budget includes those expenses that are required for your church, as a whole, to function.
How do you differentiate if expenses are for personnel or facilities? Easy, if the expense is, more or less, for one employees’ benefit then it’s probably a personnel expense. Conversely, if an expense is for everybody’s benefit then it’s probably a facilities expense.
As mentioned before, this is all somewhat subjective. There are no right or wrong answers, per se. Trust your gut, trust your experience, and classify expenses in whatever way makes the most sense to you.
If you’ve been following along closely, you’ll notice a special expense listed under the maint and repairs subcategory.
In the capital budget, we examined the feasibility of adding on to the church’s parking lot. Ultimately, based on the expected cash inflows and cash outflows, it was determined that making an addition to the parking lot was in the church’s best interest. So, in our hypothetical church, that project will be undertaken and will need to be included in the coming years’ operating budget. You’ll see detailed expenses related to the parking lot under the maint and repairs subcategory and the depreciation subcategory.
Don’t solely rely on what you spent in the past to create a feasible budget going forward into the future. Make a note of anything that might change and of any new expenses that might be incurred in the coming year due to projects approved in the capital budgeting phase.
How much revenue will you need to cover those expenses?
Click on image to see a full-size version in a new tab.
Estimating expenses is a bit depressing. But now we get to tackle the fun part, and that is estimating revenue.
Revenue also has subcategories, but they are not broken down into detail.
By now, you know the routine. In the Revenue Budget, enter the start date for your budget in the cell D9.
You’ll see that the Revenue Source column is already populated but you’re welcome to change the descriptions as you see fit.
For each month and each Revenue Source, enter the forecasted amount of revenue. A Total for the months and for each Revenue Source will automatically be calculated.
Maybe you’re baffled as to how to forecast revenue. Offerings and donations are probably at least somewhat consistent. But, other sources of revenue like facilities use charges and trusts, investments and bequests are difficult, if not nearly impossible, to accurately predict.
First of all, I’ll say the same thing I did when it came to forecasting expenses, and that’s to just come to terms with being wrong in the first place. The value in this, again, is to dedicate a little bit of thought to it.
Spreadsheets for Business has a free tool that can help you forecast revenue (or expenses, or anything really…) accurately and it can also help you gain insights into what drives revenue.
Once the information is entered into the Revenue Budget, then you are very nearly done with the operating budget.
The church’s Pro Forma (expected) income statement
After completing all of the expense budgets and the Revenue Budget, you should see a nearly completed Pro Forma Income Statement. All that’s left to enter is information about interest.
If your church keeps funds in an account that pays a reasonable amount of interest, enter what you might expect to earn this year in the Interest Income field.
On the other side of the coin, if your church borrows money, then you will likely have Interest Expense over the course of the year. That amount in the Interest Expense field should be added as a negative amount.
Now you should have a pretty reasonable idea of what the coming year will look like from a revenue and expense standpoint. Notice that each of your expense categories has the amount as a percentage of Total revenue listed next to it. This gives you an idea of how your expenses are weighted.
For reference, Aubrey Malphurs recommends the following weightings:
Evangelism/Missions 10%
Personnel 40%
Ministries 25%
Facilities 25%
Obviously, your church doesn’t have to have this exact percentage for each expense category. But it simply gives you a benchmark to measure your church against.
All the calculations in the Pro Forma Income Statement are pretty straightforward. Operating Profit is Total Revenue –Total Expenses.Net Profit is what’s left after Interest Income and InterestExpense are accounted for.
Ratios and chart
Click on image to see a full-size version in a new tab.
Now we’ll look at some very basic ratios to put the Operating Budget into perspective. These ratios were designed for, and are primarily used by, for-profit businesses. But even though a church operates differently than a for-profit business – especially a manufacturing company – they still might provide a little insight and perspective for the church leaders to use in decision making.
Profit margin
Profit Margin is pretty straightforward. It’s just Net Profit ÷ Total revenue. It shows you, in percentage terms, how much revenue you bring down to the bottom line.
Times interest earned
Times Interest Earned is a ratio that focuses on your ability to cover your interest payments.
Obviously, if an organization borrows money it needs to be able to meet the additional obligations placed upon them. So Times Interest Earned shows you, by taking Operating Profit ÷ Interest Expense, how many times over your church can cover its Interest Expense.
Degree of financial leverage
The Degree of Financial Leverage shows the amplification that borrowing money can provide to profits and losses. So, for instance, in the example operating budget, the Degree of Financial Leverage is 1.4. This means, at this level of borrowing, that for every 10% change in Operating Profit, Net profit would increase by 14% (10% × 1.4).
That sounds great, but the opposite is also true. If Operating Profit declined by 10%, then this level of borrowing would cause Net profit to decrease by 14%. That’s the nature of leverage. It amplifies gains and losses.
Most people can pretty easily grasp the nature of financial leverage.
If you borrow money and get to keep the gains from the borrowed money, then financial leverage is great. If you borrow money and your investment loses value, then you not only have the loss to deal with but you also still owe for the money you borrowed.
Degree of operating leverage
What’s not so easy to grasp is the benefits and detriments of other fixed costs, besides interest payments. The Degree of Operating Leverage quantifies the benefits and detriments of incurring fixed costs.
Why are fixed costs so important? Well for lack of a better answer – because they’re fixed. You are going to pay them anyway. So, if fixed costs really help you ramp up your operating profit, then that’s great. Because fixed costs aren’t going to increase on you.
The inverse is also true. Since fixed costs don’t change, you still have to pay them even if they are dragging operating profit down.
The Degree of Operating Leverage tells the same story as the Degree of Financial Leverage in the sense that it tells you how much greater Operating profit (not Net profit per se) would have been in the absence of fixed costs. This ratio really starts to get into detailed management accounting. That amount of detail is probably beyond the scope of this post, but since it’s included in the Executive Summary, I wanted to touch on it briefly.
In the example workbook, the Degree of Operating Leverage Is 10.2. This means then that a 10% increase in Total revenue, everything else being equal, would translate to a 102% increase in Operating Profit. Obviously, you know what that means if Total revenue went the other direction. It means that a 10.2% decrease would put Operating Profit in the red.
More about degrees of leverage
There is no good or bad Degree of Financial Leverage or Degree of Operating Leverage. It’s simply a reflection of the way your costs and borrowing affect your income statement. Leverage is great if Total revenue and Operating Profit are increasing. Leverage is bad if the outlook for the coming year is bad. So if your leverage is high and you’ve got concerns about your ability to bring in revenue for the coming year – then you’d better start looking to reduce fixed expenses and Interest Expenses.
Finally, at the bottom of the Executive Summary, you’ll see a handy chart that will illustrate the level of revenue and expenses (broken down by broad category) for every month in the upcoming year. This allows you to visualize how all these factors, which affect the financial health of your church, are expected to fluctuate throughout the year.
Plan for every scenario your church might face
Say that creating a simplistic operating budget is working at level 1 out of 10. Completing the Spreadsheets for Business operating budget template takes you up to 7 out of 10. This next section is what will push your church up to a 10 out of 10.
On the Likely-Best-Worst Scenario worksheet, you’ll see all the information pulled in from your Pro Forma Income Statement and the subsequent ratios under the Most Likely Amount column. But, what you will have the opportunity to do here, is to imagine multiple scenarios – some good, some bad. You’ll get to picture what your Pro Forma Income Statement will look like in the best-case scenario and the worst-case scenario.
Better or worse than expected revenue and expenses
Click on image to see a full-size version in a new tab.
To use this valuable worksheet, all you need to do is start with a multiplier for the best case and worst case. Obviously, the best case for revenue is going to be a positive percentage, and for expenses, a negative percentage.
On the other hand, of course, the worst case for revenues is going to be a negative percentage, and for expenses, a positive percentage. Here, you are going to have the opportunity to play around with positive and negative future outcomes, and see what feels right in terms of multipliers for revenue and expenses.
But beyond simply entering a Best Case Multiplier and a Worst Case Multiplier for revenue and expenses, you can also refine the scenarios even further. You do this by entering specific amounts in the Best Case Override Amount and Worst Case Override Amount.
What are override amounts?
It means that you can tweak the dollar amounts for revenue and expenses even further. For instance, maybe you hope that your church might be blessed with an extraordinarily high amount of revenue from trusts, investments or bequests. You can thus enter a specific amount in the Best Case Override Amount for whatever would constitute the “best case” for your church.
On the flip side, say you know that, potentially, the worst case scenario for facilities expenses is that you need to replace the church HVAC system. So, you enter an adjusted amount in the Worst Case Override Amount for facilities that reflects this added expense.
You can also tweak the override amounts for Interest Income and Interest Expense.
At the very bottom, you’ll see the effect on the ratios from the Executive Summary based on what you entered for the Best Case and Worst Case Multipliers and Override Amounts.
There’s an old saying that goes, “hope for the best, but plan for the worst”. With this scenario planner, you’re able to do just that. You’re able to protect your church from contingencies while being prepared to act accordingly if the coming year is full of blessings.
Church operating budget
Maybe all of this seems overwhelming. That’s understandable if you’re not accustomed to planning with this level of detail. Again, I urge you (as the creator of this “overwhelming” budgeting template) to not overthink it.
What I do urge you to do however is to download the template at the top of the post – and to boldly use it.
Go over it once, quickly filling in the information you have handy, then walk away from it. After that, come back to it, look at it, reflect on what you’ve already entered and make any changes you feel are necessary. Then walk away from it again.
This is (for lack of a less cliched term) “a living document”. It is designed to take the relatively simplistic information of your forecasted revenue and expenses and to do the hard work of providing valuable output. That will allow you to be proactive for the coming year and give you confidence as a leader of the church. It can help your church not only stay financially solvent but also fulfill its mission and achieve its goals.
What other (sub) categories of revenue and expenses would you include?
What percentages and amounts would your church enter to prepare for worst and best-case scenarios?