“Why include an analysis of the market in your business plan?” The market analysis is the foundation of the business plan. Other sections are important, of course. Not the least of which is the financial projections. But the market analysis is what will really make or break your business plan. It will solidify what problem you’re solving and what makes you unique.
If the market analysis is neglected, then the reader of your business plan is left to guess about your customers, competitors, and the environment you expect to operate in. Not surprisingly, if people are left to guess about these things – they’ll probably guess that there is no market for your product or service.
By committing to all the necessary steps involved in market analysis, you demonstrate to the reader that you understand important factors related to your company’s success. Furthermore, you’ve demonstrated your aptitude in analysis and willingness to be flexible.
Showing the reader that you know your customers, the competitive landscape, and the risk in your industry will set you apart from others who are looking for financing. Particularly those who are merely operating on a hunch.
**While writing a post for InvestSomeMoney.com on the topic of competitive market analyses, I stumbled upon this post on Buffer.com. I thought it had a lot of great ideas and would complement the information in this post.
What is a market analysis in a business plan?
The market analysis section of the business plan is where you demonstrate your qualitative and quantitative understanding of your environment. Also your company’s strengths and weaknesses.
A good market analysis will address anything and everything that pertains to your new company’s internal and external environment. For instance, topics covered could include:
- Economics
- Distribution
- Manufacture
- Regulations
- Taxes
- Privacy
- Customer avatars
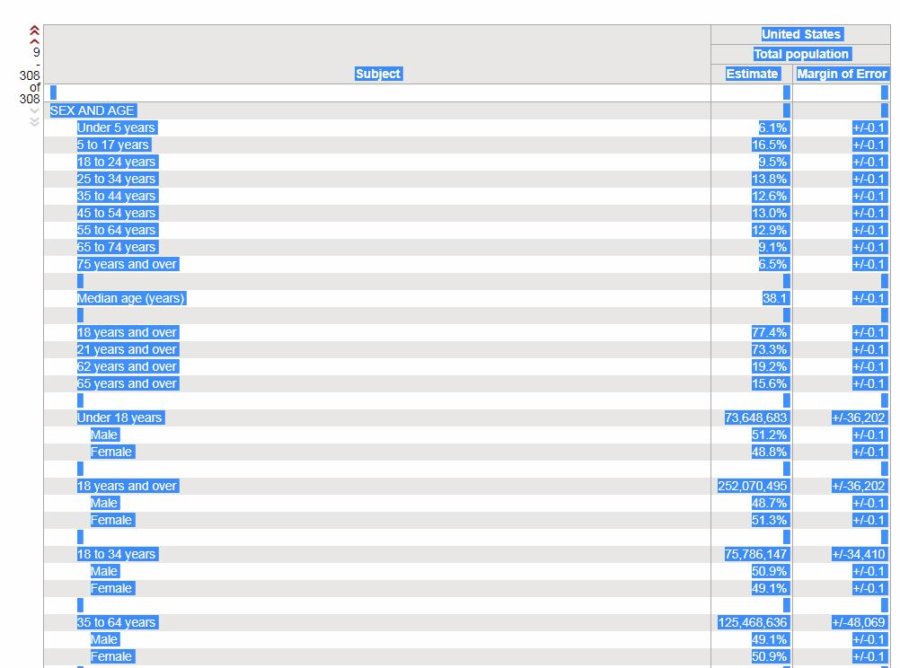
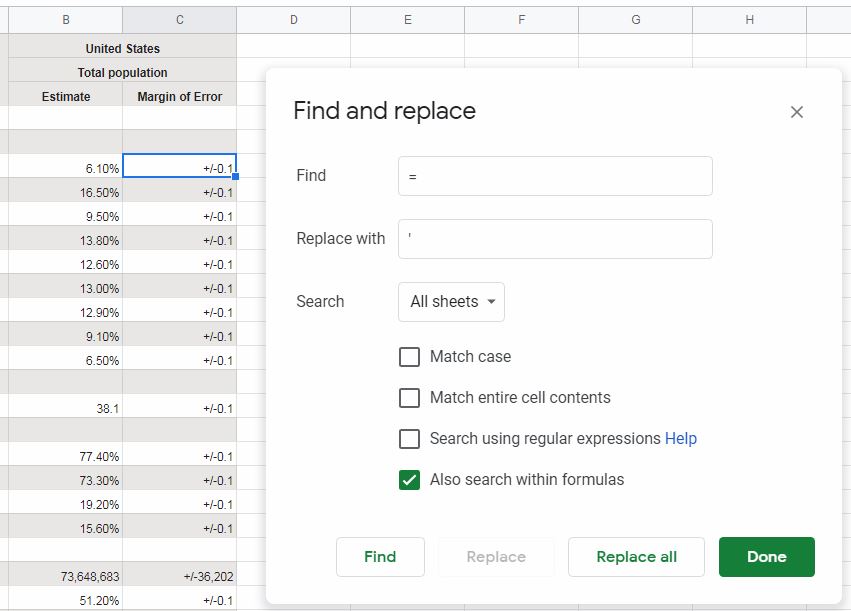
- Demographics
- Geographics
- Competitors
- Identification
- Analysis
- Customer behavior
- Decision making
- Motivation
- Risk
- Government instability
- Operational risk
- Opportunity
- Market size
- Unique selling proposition
- Value
- Problem identification
- Product/service benefits
What is the importance of a market study?
A market analysis won’t tell you what to do, unfortunately. But if you commit time and effort, it should shine some light on how to proceed. Hopefully, it will make the course of action a little easier to see. A correctly executed market analysis should help your young company to navigate obstacles and avoid being stopped in its tracks.
There are many reasons to do a market analysis. Many are unique to the small business and the industry it operates in. Here are some potential reasons for you to consider…
Think about what problem your product or service will solve
It’s kind of an old cliché, but customers buy benefits. Not features.
For instance, people don’t buy saws to cut wood – they buy them to have a perfectly shaped piece of wood. We all know this intuitively. But it still takes an effort on most of our part to consistently think in this different way.
Unfortunately, thinking in this manner opens up a whole new list of competitors. Substitute products were discussed in the demand analysis post.
To use the previous example – say you were selling saws in your retail store. You might have to consider the local lumberyard a competitor if they started making custom cuts for their customers. Their primary product isn’t the same. But they are selling the same solution.
Be honest with yourself about your product or service
When a fresh idea pops into an entrepreneur’s head, they feel like they’ve just solved all the world’s problems. If it were up to entrepreneurs, everything they conceive would be an absolute hit.
The reality is – you’re not the only one who’s going to buy your product or service. Hell, you may not buy it at all. A business plan market analysis forces you to look at your idea objectively. To confront its faults, its shortcomings, and your erroneous assumptions.
Never forget why your customers would buy your product or service. They’re just as egotistical as you, and you’ll have to convince them that you’ve solved their problem in order to get them to buy.
Solidifying your unique selling proposition (USP)
Some say there are five ways that a company (or brand) can make itself unique. That’s kind of narrow, I think. Because if there are only five ways then there’s not much room for uniqueness. Nevertheless, it serves as a good thought experiment and a way in which a company can begin to think about its USP.
There’s an old saying in business “price, quality, or customer service. Pick two.” As far as I can tell, this cliché actually has some basis in reality. It seems that companies can be above average in two of these – but never all three.
So, your company can set itself apart with one of these three categories. Or, it can look to set itself apart in terms of image. It’s good to be above average in as many categories feasible. But ultimately, your company needs to decide to be the best at something. Something unique.
Working through the steps of writing a market analysis in your business plan will help you understand what distinguishes your product or service from others in the market.. If it doesn’t, then you probably have a little more work to do!
Here are the five (general) categories of uniqueness you might explore to clarify your USP.
1) Product
Usually, a product or service has to be of high-quality in order for a company to be renowned for it. Or, at the very least, it needs to have unique features (benefits).
Porsche is an example of a company with a reputation for quality. Porsche is, of course, a luxury automobile brand that uses high-quality and unique materials. According to Consumer Reports, Porsche’s quality is viewed as higher than other reputable automobile brands such as BMW or Mercedes.
2) Customer service
Just as a quality product can set you apart from the competition, quality customer service can do the same. Service so good that the (lower) quality and/or (higher) cost of your product or service can be overlooked.
Ritz Carlton is a company well known for its exceptional customer service. This is another luxury brand. But, it doesn’t mean that only luxury brands can offer great customer service. Ritz-Carlton sets itself apart by offering personalized and unique service to its patrons.
3) Pricing
There are many different pricing strategies that a company can employ. Typically, though, the only one that is going to resonate with customers is economy pricing.
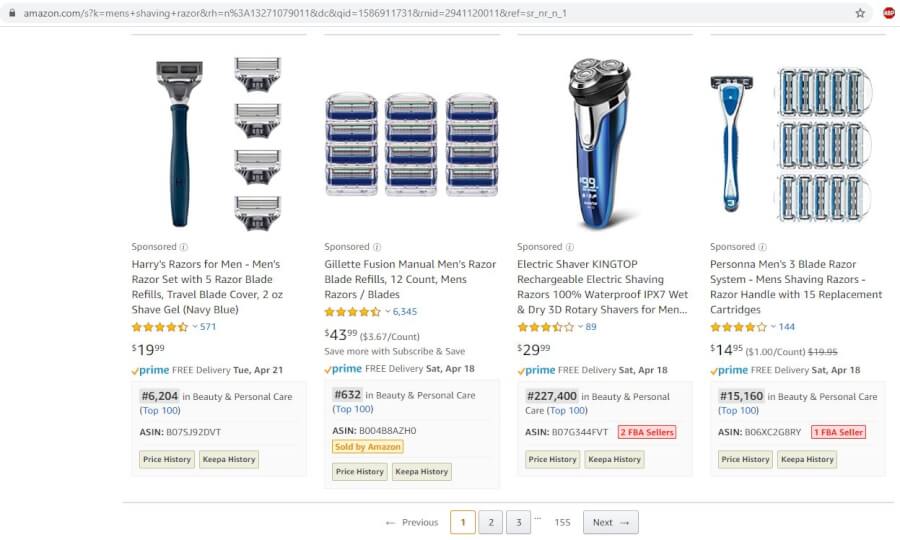
Walmart is the de facto example when it comes to economy pricing. But, I would also submit Amazon for consideration. While Walmart might beat Amazon on a lot of prices. Particularly, well-known consumables. Amazon seems to have earned itself a reputation of low pricing for things that are a little harder to find. You might be able to find unique products on a specialty retail site too. But rarely will the specialty site beat Amazon on price.
4) Branding
Of the two perception-based categories for a USP, branding is the internal one. It’s the one that has to do with the company itself. It’s the image that’s portrayed to the public and the concepts that the company associates itself with.
Burt’s Bees is known for its all-natural beeswax lip balm. But, they actually have over 350 natural body care products. Burt’s Bees’ philosophy is “what you put on your body should be made from the best nature has to offer.“ They’ve worked hard to brand themselves as a natural and healthy alternative in an industry that uses a lot of unsavory ingredients in its products.
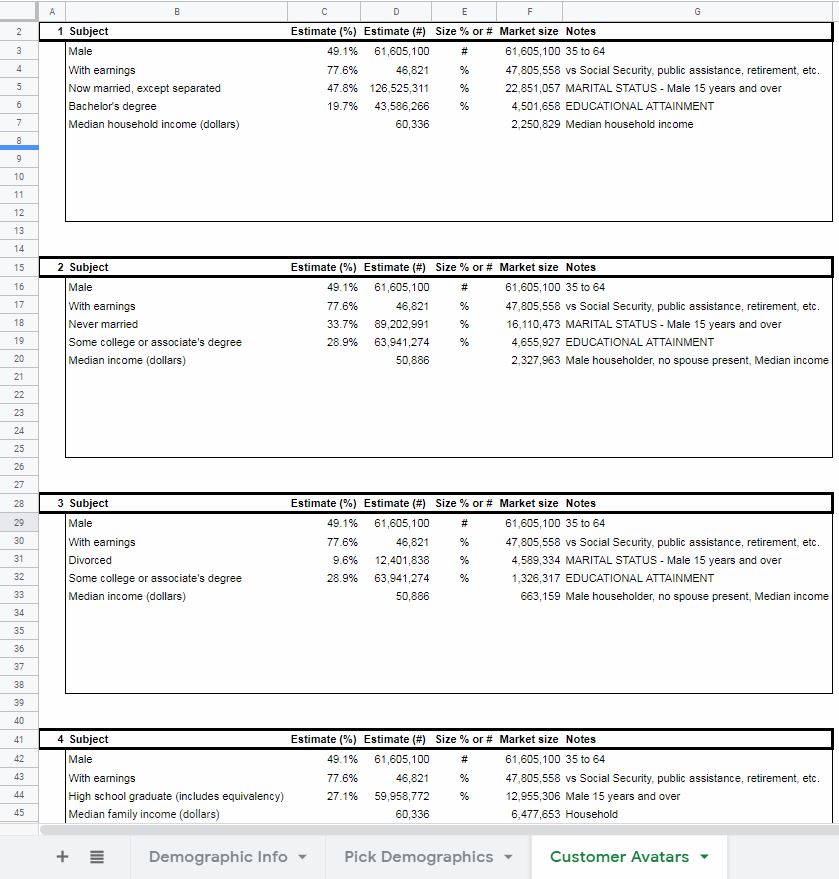
5) Customer avatar
Sometimes companies are defined by their customers. Their customer avatar is their image. Of the two perception-based USP categories, this is the external one.
There are lots of companies that could be considered as “defined by their audience.” Lululemon is an example that comes to mind. Typically if someone is a Lululemon customer you can picture in your mind some of their demographic characteristics. They’re probably, white, young, suburban, women from above-average income households. Whether Lululemon chose that demographic, or it chose them is debatable.
Now look at the competition
Since the goal here is to determine your unique selling proposition, you’re going to have to size yourself up against the competition.
The most straightforward way to do that is to lay out your information in regards to the five categories of uniqueness and compare it side-by-side with your competitors. After you’ve examined the competition’s products, customer service, pricing, branding, and custom avatars then you will have a very good idea of what it will take to be unique. More importantly, you should have an idea if that uniqueness can put you in a position to be successful.
See below for an example of how the comparison might look.
An example of USP in a business plan
If this is the first Spreadsheets for Business business plan post you’ve read then let me bring you up to speed.
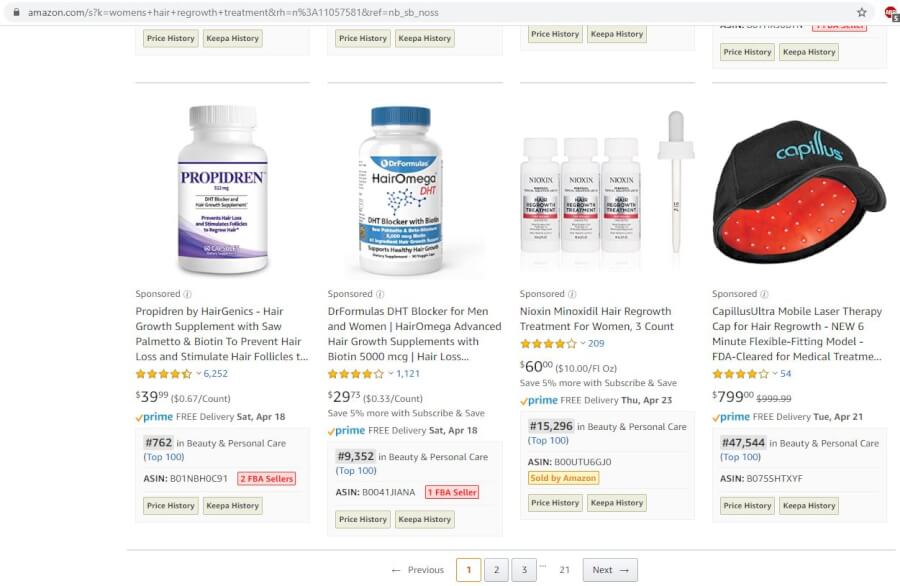
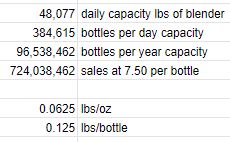
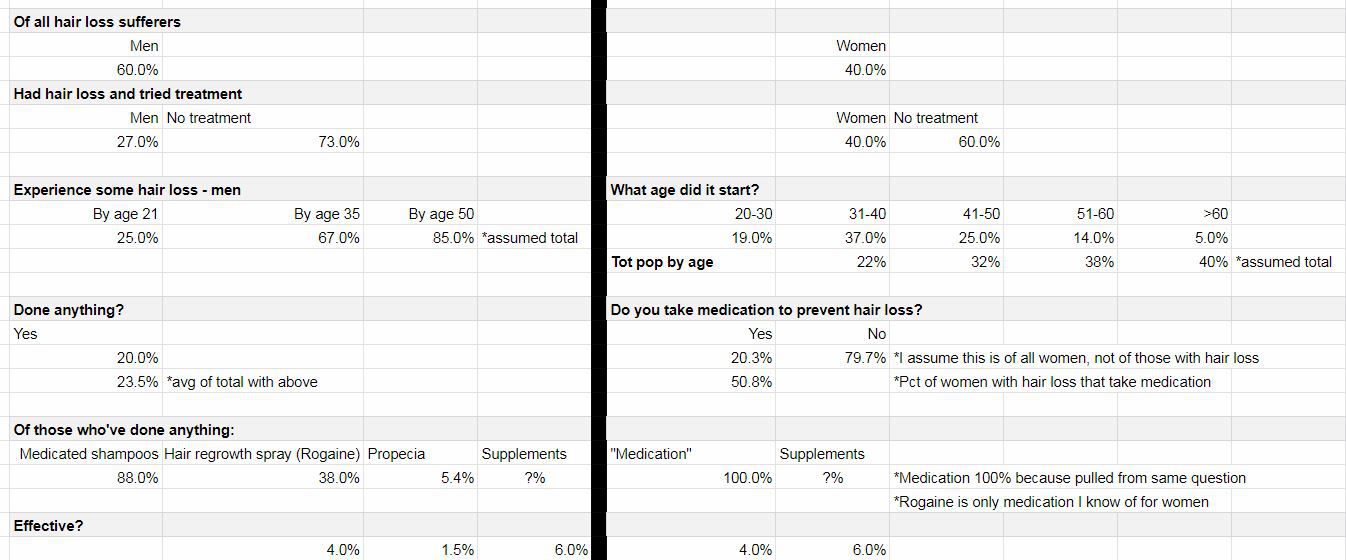
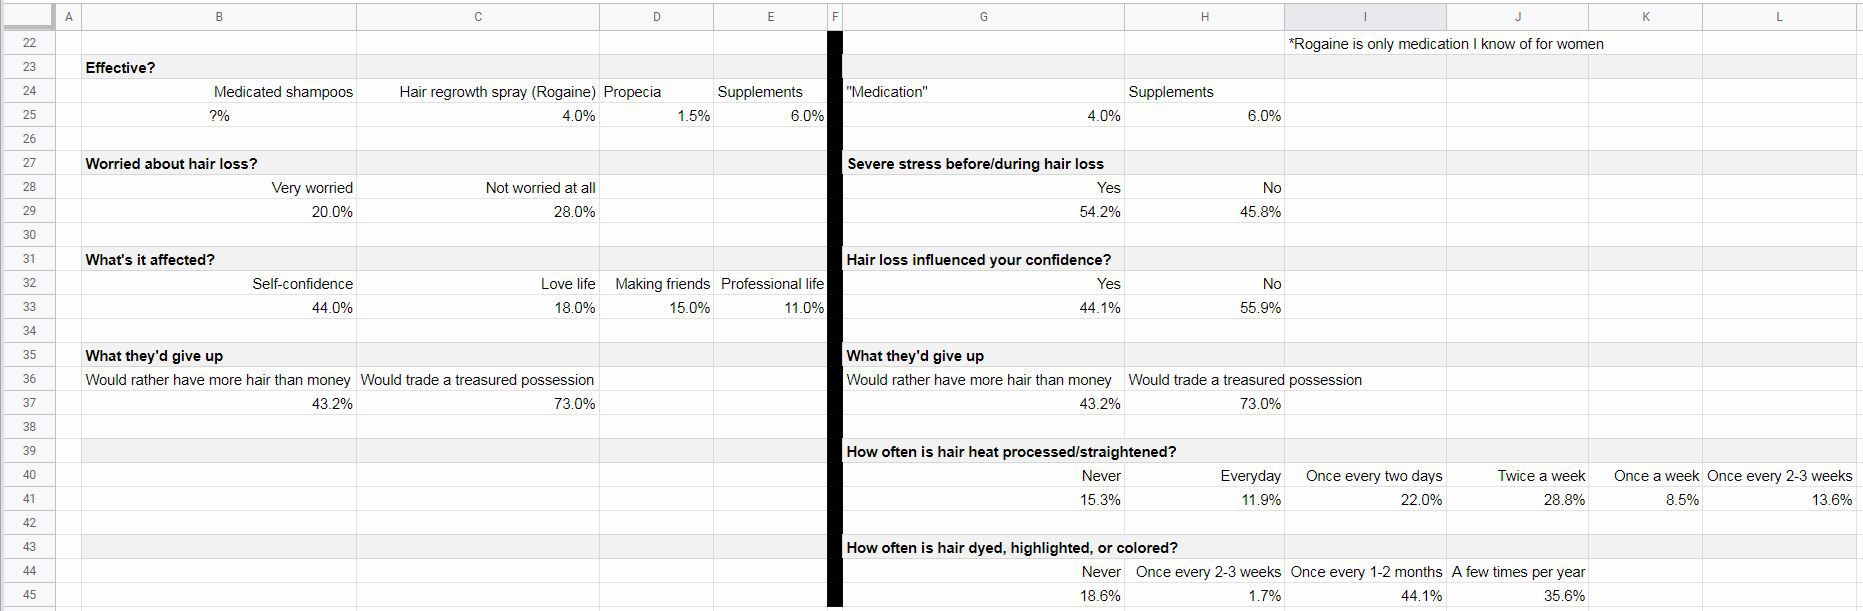
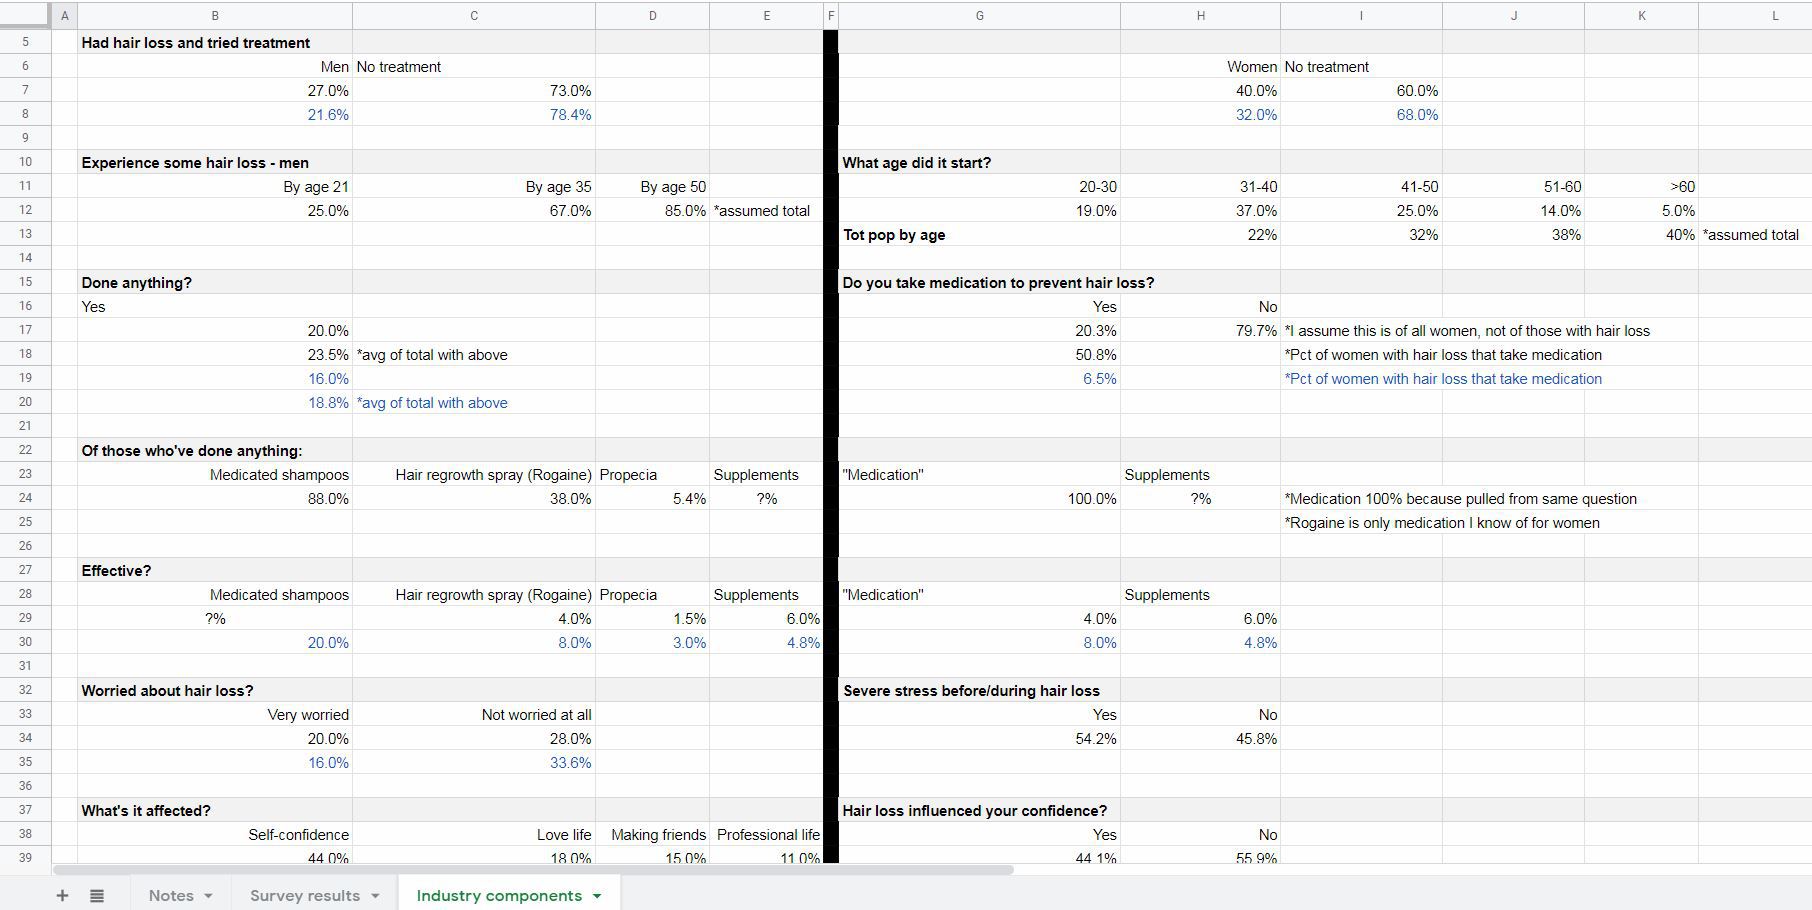
For all of the business plan posts I’ve written, I attempt to apply the subject at hand to a hypothetical startup. This hypothetical business would manufacture and distribute an all-natural, topical, hair regrowth supplement.
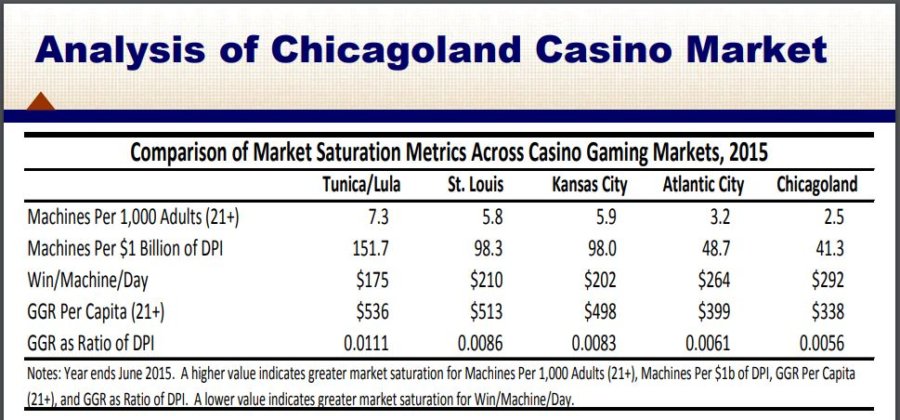
Previously, by going through the market analysis steps, I’ve learned that there may be an issue with market saturation in this space. An issue that might not make this a feasible business. But, for the sake of consistency I’ll stick with the same business idea when examining the topic of why a market analysis is important in a business plan.
In previous market analysis posts, I outlined what problems I thought my hypothetical product would solve. I also addressed some of the strengths and weaknesses of my product and business model. So, here, I’ll take the opportunity to walk through the five categories of uniqueness and what my potential business might look like when stacked up against the existing competition in that space.
| Hypothetical product | Rogaine (Men & Women) | pura d’or Anti-Thinning Shampoo | iHelmet | |
|---|---|---|---|---|
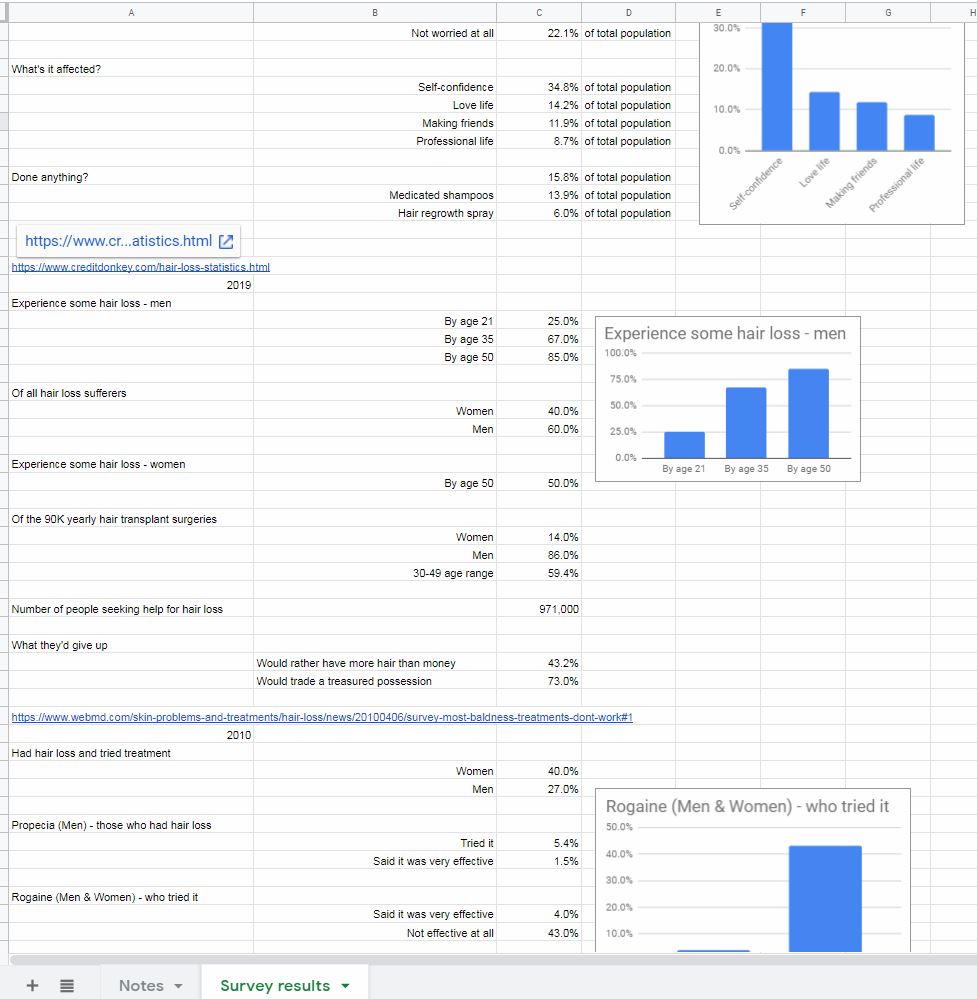
| Product | Quality ingredients. Untested. | 60-92% positive results | Very positive ratings | Up to 98% positive results |
| Customer service | Via retailer? Untested. | Via retailer | Via retailer | Unknown |
| Pricing | $35.49 men. $29.49 women. | Approx $10/month | Approx $30/month | $490-$545 one time |
| Branding | Unique natural ingred. Not FDA approved. | Only FDA apprvd topical treatment. | Comprehensive natural ingred. Not FDA approved. | Less discreet. FDA apprvd. |
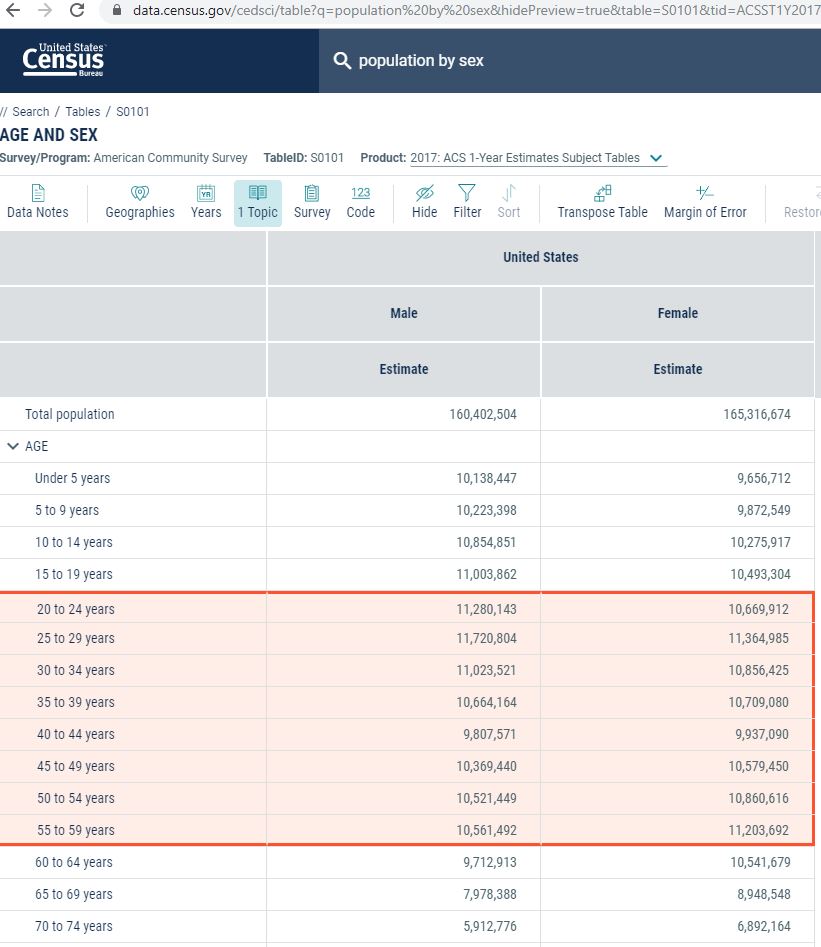
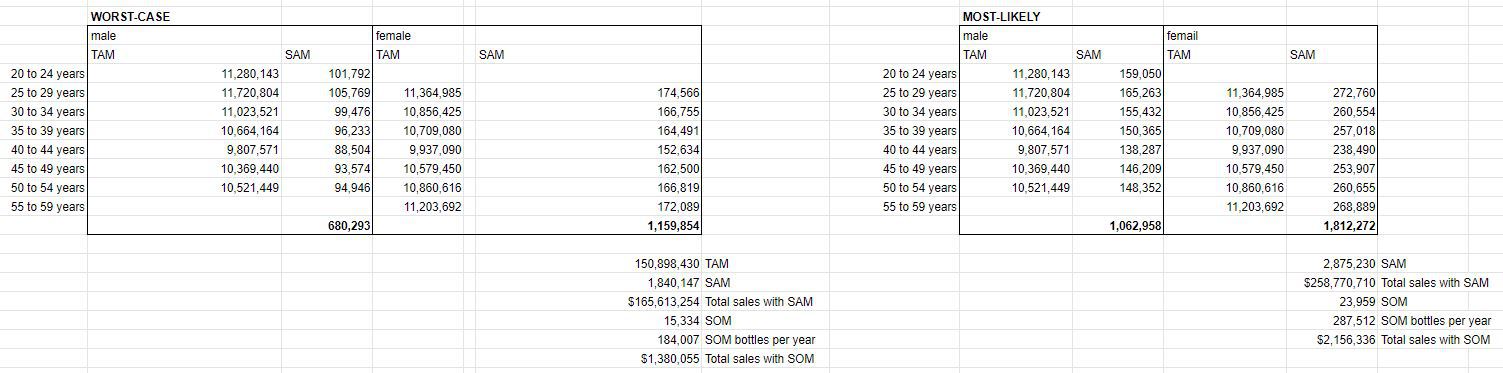
| Customer avatar | Men 18-35. Women 31-60. High income. | Men 35-50. Women 31-60. All incomes. | Men 18-35. Women 31-60. High income. | Men 35-50. Women 31-60. Very high income. |
So, what conclusions can I draw from this?
For starters, I’ll know that getting (authentic) positive reviews will be crucial to get my business off the ground. Additionally, it will probably be best to leave the customer service up to the retailers – at first anyways.
In order to justify my pricing, I’m going to have to place a huge emphasis on my unique ingredients. That’s my rough USP, for now. A “one of a kind” formula.