Every small business operates in a number of different economies ranging from their neighborhood to worldwide. The health of these economies has a huge impact on the health of small businesses.
A business plan economic analysis should paint a picture of the economic environment your business will operate in. With many economic indicators, you can delve into further detail. Referencing information specific to small businesses in your state and industry helps to provide an even clearer context.
No, these indicators might not always paint a rosy picture. What they will do, however, is show that you’ve done your homework. That you, as an entrepreneur, understand your environment. You’ll show that you can plan around the threats you face and capitalize on the opportunities.
What to look for in a business plan economic analysis
Small Business Employer Firms
Proprietors’ Income
Small Business Job Creation
Business Births vs. Deaths
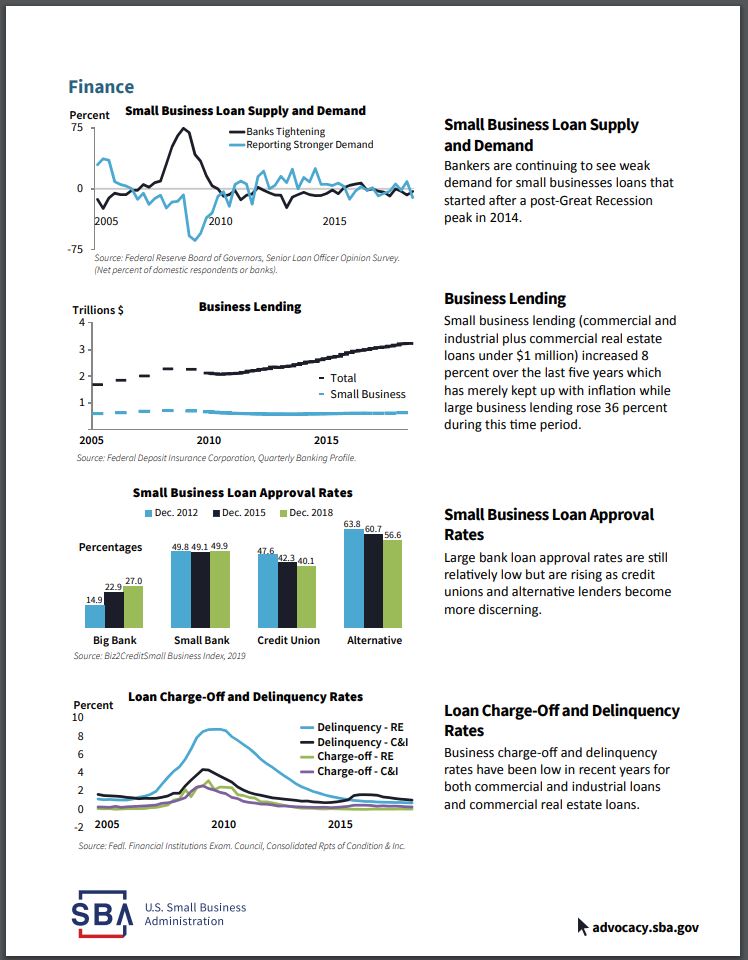
Small Business Loan Supply and Demand
Business Lending
Small Business Loan Approval Rate
Loan Charge-Off and Delinquency Rates
If you were so inclined, you could probably draw a correlation between any economic indicator and the health of your small business.
Depending on your industry, the particular economic indicators that affect your small business will vary. Whether you’re retail, manufacturing, goods, or services will make a difference.
Inspiration for these indicators was taken from the Small Business Economic Bulletin. This document is published by the U.S. Small Business Administration. Supposedly on a quarterly basis. Though, the Bulletin linked above is the most recent one I could find. It’s over six months old as of this writing.
For each indicator addressed in the Bulletin, I’ll discuss what it measures, why (I think) it matters, and how to use the information. In the end, I’ll also touch on what (if anything) each indicator might mean for my startup.
These data are just a jumping-off point. You’ll have to dig into it further to determine what it means for your business.
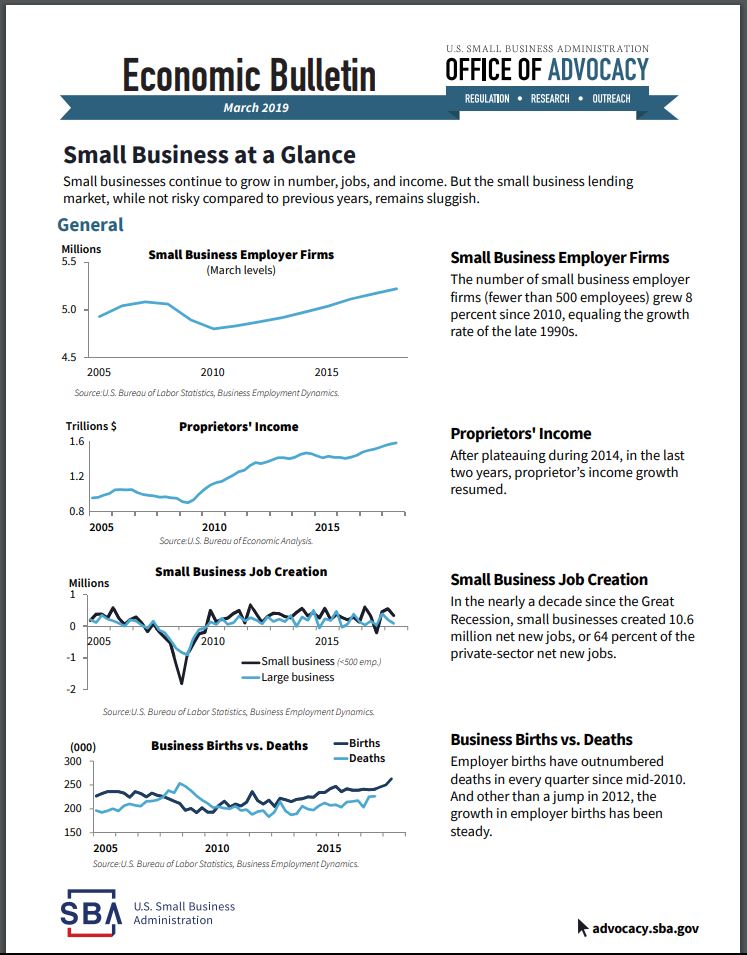
Small Business Employer Firms
This indicator measures the number of small businesses that employ people.
Small business, for the purpose of this indicator, includes businesses with less than 500 employees. I think that includes a lot of businesses that would qualify as “mid-sized.” But, that’s just me.
An uptrend in the number of Small Business Employer Firms implies that the environment is ripe for small businesses to launch. A decline would imply the opposite.
Where possible, I always recommend digging down into regional or state information. Doing the same thing by industry is smart too. That way you get the most relevant economic statistics for your business.
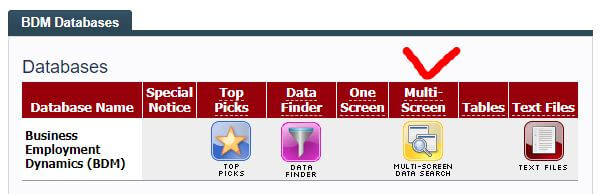
In the BDM database, the best way I found to do this is by using the Multi-Screen option for data retrieval.
Credit: bls.gov/bdm/
You’ll notice two pairs of similar phrases if you browse the BDM. These phrases are Openings/Closings and Births/Deaths. So, what’s the distinction? I sent an email to the SBA and a tweet to the BLS.
The BLS responded quickly with a link to this page. The language is a little hard to understand. However, I think that the main difference is that Openings/Closings can include seasonal businesses. Births/Deaths are considered permanent.
The SBA, predictably, didn’t respond.
It’s my guess that this indicator is a tally of Births/Deaths. Which makes sense. Including seasonal businesses in the tally would increase its volatility. Probably better to count businesses that permanently open and close.
Proprietors’ Income
This is the aggregate amount of income earned by the owners of small businesses.
Specifically, sole proprietorships, partnerships, and tax-exempt co-ops. Dividends aren’t included in this indicator. Neither is rental income (i.e. by a landlord).
Most businesses start off as a sole proprietorship (Source). Businesses that don’t pay the proprietor enough income – die. A healthy small business environment should translate into healthy growth in Proprietors’ Income.
What if Proprietors’ Income is flat (or declining), but Employer Firms are growing? That might imply that more firms (proprietors) are fighting over shrinking pieces of the pie. If this is happening in your industry, beware.
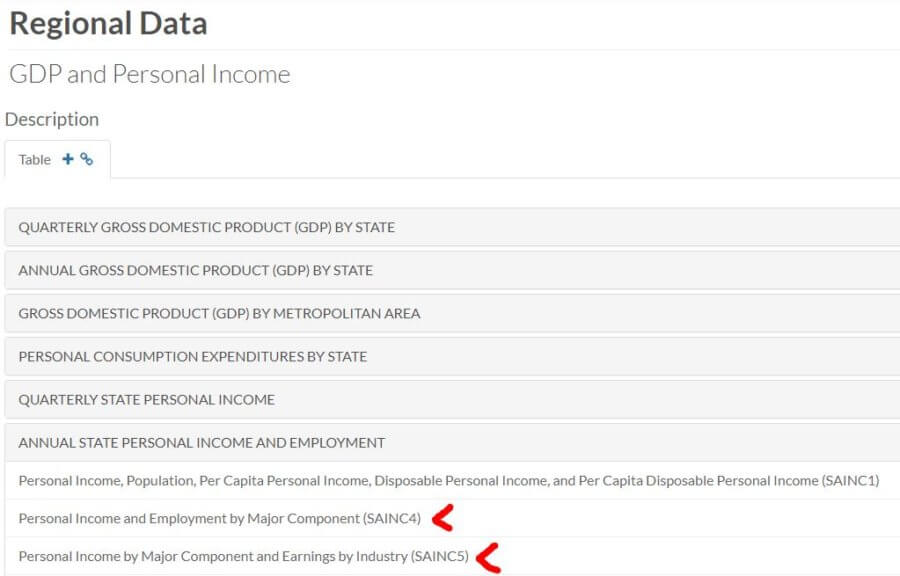
The best way I found to drill down is to look at the most current release of Personal Income by State. From there, you want to go to the Interactive Tables. Specifically, you want tables SQINC4 and SQINC5 for quarterly information. SAINC4 and SAINC5 for annual information.
Clicking on either of those should guide you to what you need. Remember, you can use Ctrl to select multiple options!
Credit: apps.bea.gov
Small Business Job Creation
Job creation is a sign of growth. As customers demand more, help is needed to meet that demand.
It might come in the form of direct labor or administrative help.
Your small business may or may not follow suit. What this indicator tells us, though, is whether there is a net gain in small business jobs or not. If there is, that could be considered a tailwind. Not something that is going to guarantee success. But, not something you’re going to have to fight against either.
Here’s the flip side of that “good news” though. If small businesses (and the big boys) keep adding jobs, quarter after quarter, eventually you could reach a point where demand exceeds supply. The cost of labor goes up and (potentially) the quality goes down. For you, your suppliers, and maybe your customers.
Like Small Business Employment Firms, this indicator refers to the BDM database. Again, I suggest using the Multi-Screen Data Search to navigate it.
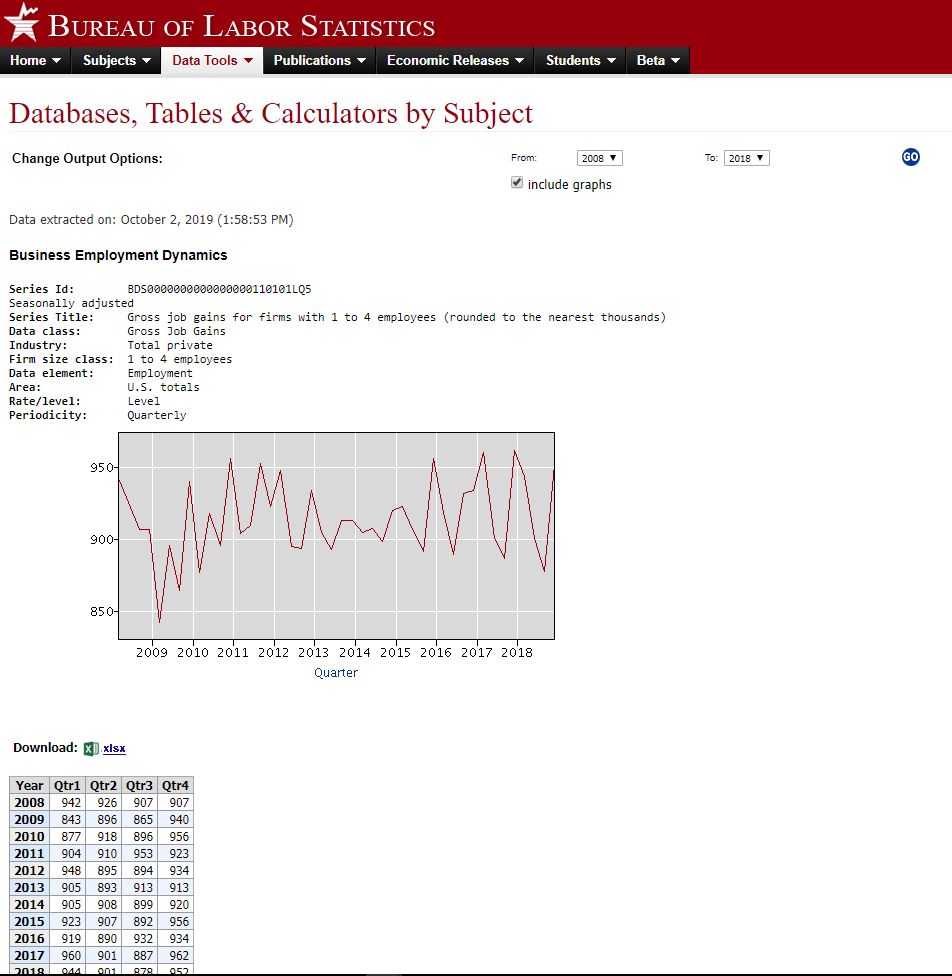
You can drill down by state if you choose to look at all industries and all sizes. However, some industry-specific searches can drill down by state too. I imagine it’s the bigger industries that allow for such a drill-down.
Click to enlarge Credit: data.bls.gov
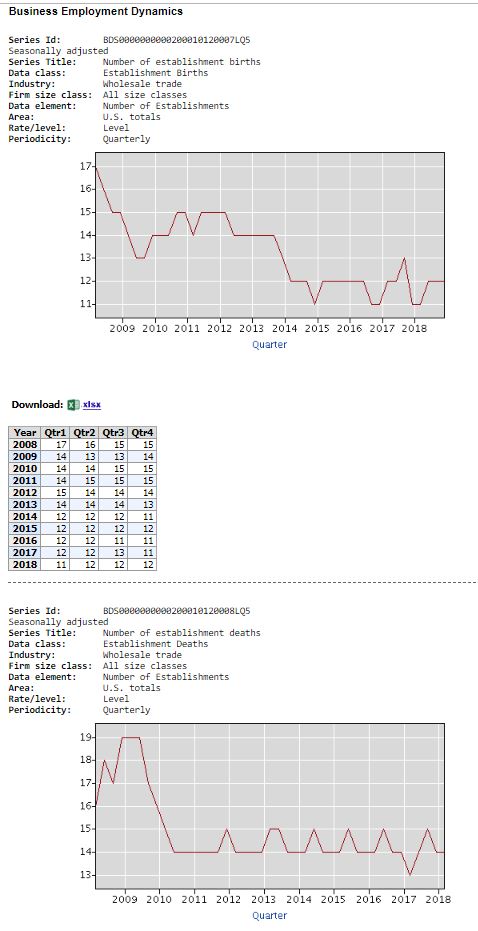
Business Births vs. Deaths
This indicator ties in directly with the Small Business Employer Firms. More Births than Deaths mean that the number of Employer Firms goes up. More Deaths than Births – down.
Once again, we refer to the BDM database. Breaking information down this way allows you to see how much of pull Births and/or Deaths are having on the number of Small Business Employer Firms. For example, is the number increasing because of more Births? Or, because of fewer Deaths?
This is just further insight into the small business environment. It might be able to provide some clue as to how ripe it is for success.
When researching Establishment Births & Deaths you can isolate by industry. But, you’ll only get totals for the whole U.S. Conversely, when looking at all industries, you can narrow down by state.
Small Business Loan Supply and Demand
This indicator measures the percentage of bankers that answered two questions in the affirmative or negative. The first question asks if banks have tightened or eased their standards on small business lending. The second question asks if the demand for small business loans has increased.
Credit: advocacy.sba.gov
Now we shift gears a little. Away from small business employment, openings, closings, births, and deaths. The focus of the following four indicators is small business borrowing.
Not a terribly objective measurement. More of “getting a feel for the room” statistic. It is just a survey, after all.
Beyond those two questions, though, there is a lot more in the SLOOS that measures bankers’ attitudes toward small business lending. Questions related to terms, collateral, covenants, and much more.
The lines on the chart seem to oscillate around 0. A negative would mean that the banker felt the opposite of what is being charted, I suppose. For example, a negative Banks Tightening figure means that more bankers answered that they were easing standards. A negative Reporting Stronger Demand line would mean that demand was weaker.
Anyhow, this indicator might provide insight into how many small businesses are seeking to employ financial leverage. Those insights can be compared with the indicators measuring expansion and contraction. If the small business environment seems ripe, but few are willing to leverage in this environment, then maybe the optimism about the future is shaky.
Don’t forget to check out the accompanying tables for a more quantifiable view of the data.
No industry or state-specific information seems to be available for this indicator.
Business Lending
This indicator compares small business loan volume to that of big business.
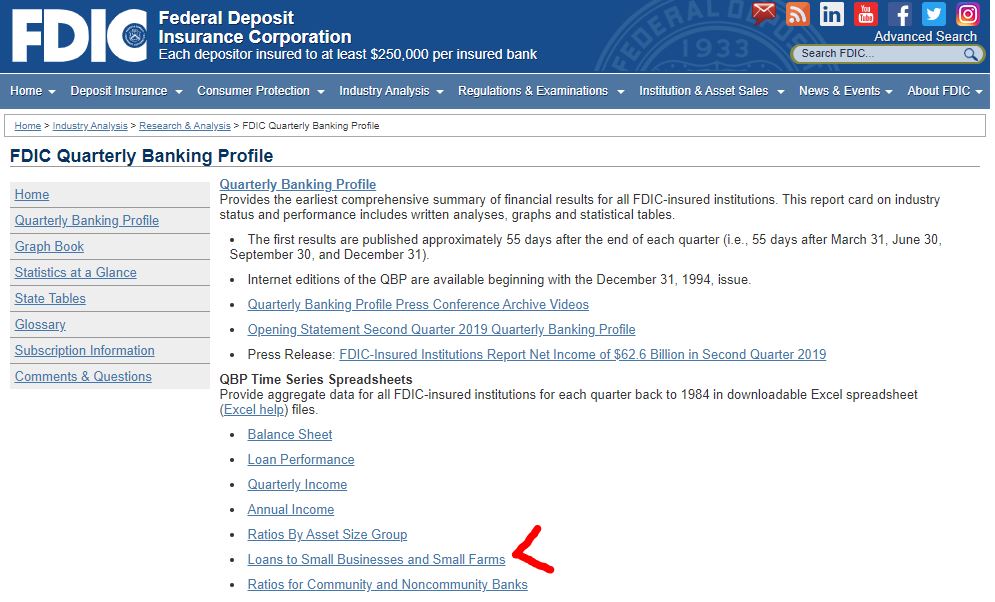
The Federal Deposit Insurance Corporation (FDIC) Quarterly Banking Profile is the source of this information.
Commercial and industrial loans to small businesses are measured. As are real estate loans under $1 million.
Like the Small Business Loan Supply and Demand indicator, I think this is indicative of small business owner optimism. If small business owners feel like the environment is good for investment, they are more likely to borrow. If they don’t feel like they can earn an adequate return for the risk, they will likely limit their exposure.
It’s wise to look at small business lending in several different ways. One indicator might tell you one thing. Another indicator – something else. When you get conflicting (credible) information you should investigate. You’ll hopefully come out the other end a shrewder businessperson.
Credit: fdic.gov Click to enlarge
Small Business Loan Approval Rates
This indicator provides valuable information two-fold. First, it gives you an idea of what the odds are of getting approved for a small business loan. Second, it breaks the approval rates down by the type of financial institution.
Granted, you don’t know the quality of the applicants measured by this indicator. That is something that would help to put this information into perspective. Are they startups or existing businesses? Maybe they aren’t adapting appropriately to changes in cash flow.
Big banks, small banks, credit unions, and alternative sources are measured. This might provide some insight as to where to go if your small business needs financing.
Unlike the other indicators, this one is more of a snapshot. Historical information is displayed. But only for the same month three and six years ago. It is not presented as a time series.
This gives you an idea of how well to prepare and where to focus your efforts when you need financing. If lenders are becoming more discerning, then you know that you’ll need to create a better business plan.
What you see in the Bulletin is pretty much all there is in the report itself. No state, industry, or size breakdown is provided.
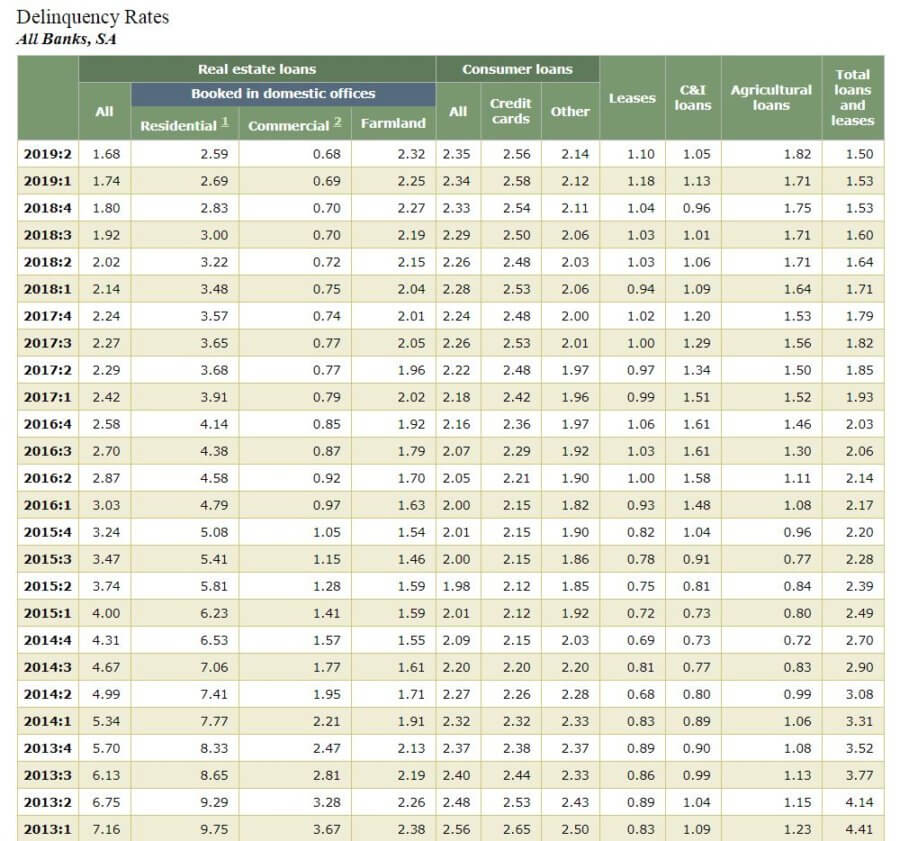
Loan Charge-Off and Delinquency Rates
This indicator gives you an idea of how effectively other businesses are employing their leverage.
Granted, it really only points out what percentage of businesses are doing poorly. It doesn’t say much about the upside. Only the downside.
The description of the report doesn’t outline exactly how the terms are defined.
My interpretation is that Delinquency means that one or more payments are late. Maybe even only by one day.
Charge-Off likely means that the bank has written off the loan against their reserves. They feel that payment for the remaining balance is extremely unlikely.
This serves as a lagging indicator for some of the others. I think the indicator it ties to best is Business Lending. If Business Lending is increasing, but Delinquency is level, we can assume that businesses are finding a good use for the borrowed money.
No state, size, or industry-specific information is available.
Credit: federalreserve.gov
Business plan economic analysis for my startup
I don’t know if I’ll finance my startup with debt or equity. Therefore, I don’t know if the lending indicators are relevant to my business plan. If I plan on using debt financing, I can circle back and scrutinize the relevant indicators.
Right now, I don’t plan on hiring any employees. So the Small Business Job Creation indicator isn’t currently relevant either.
Of the remaining three indicators, two are somewhat redundant – Small Business Employer Firms and Business Births vs. Deaths.
I feel like the Business Births vs. Deaths indicator gives a little more insight. Let’s look at what it shows for my industry – Wholesale trade.
Credit: data.bls.gov
Not terribly encouraging. In 2014, Births fell below Deaths and seemed to stay there. This suggests, possibly, consolidation in the industry. Big, strong firms forcing out smaller, weaker ones.
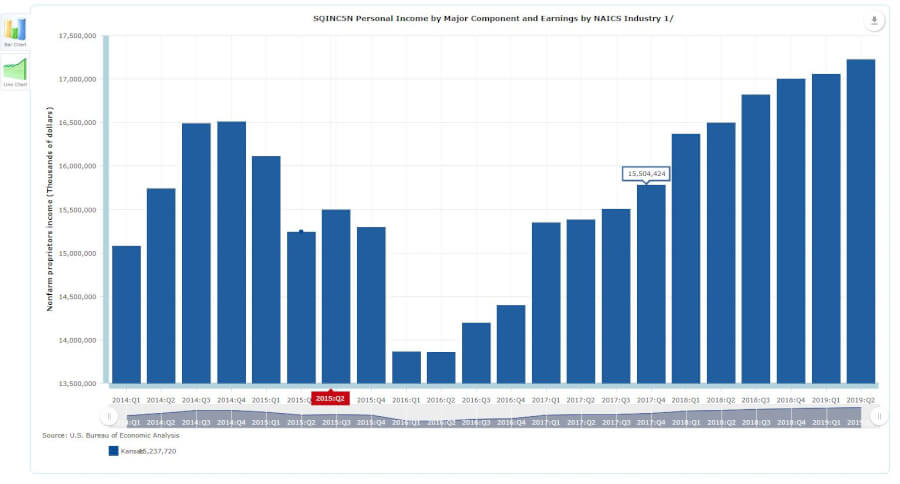
What about Proprietors’ Income?
More encouraging. Proprietors’ Income has risen sharply in my state since Q1 of 2016. Despite the title, the table doesn’t have a NAICS breakdown. But it doesn’t.
So, I don’t know the whole story. If this rise took place in my industry, I could assume that there’s plenty of money to be made. It’s just going to fewer hands. This means that I had better have a sound plan for success.
Click to enlarge
Credit: apps.bea.gov
What other indicators should I have included in my business plan economic analysis?
Which indicators are important for your business plan economic analysis?
In order to estimate how much in sales your startup can hope for, you’re going to have to estimate the market size for your product/service(s). This is critical for your startup because it will give you an idea of your business’ potential. It will also help you plan for capacity-related issues.
2 approaches to estimating the market size for a business plan
I cover this topic more in-depth in a post on market size and growth rate on my sister site, InvestSomeMoney.com.
The context there is focused on investing your money in a publicly-traded company. Though that’s a little different than what we are doing here, the fundamental principles remain the same.
The goal is to determine how many potential customers there are for a business and how much they are willing to spend. In order to do that, we can employ two general methods. These methods are a top-down analysis and a bottom-up approach to understand market size and growth.
One way to think about this is that a bottom-up approach uses multiplication and a top-down analysis uses division to arrive at an estimated market size.
After writing on this subject several times, I’ve come up with another way to think about these methods. I think a bottom-up approach should look internally, at things like unit size and capacity. A top-down analysis should look externally at things like demographics and market research.
Looking at this from these two different perspectives opens the door for further analysis. When you’re done, you should know whether you can expect to be capacity constrained or demand constrained. You’ll also start to flesh out some ideas that will help you further into your business plan.
If you do an analysis with both approaches, you can compare the results. For instance, if your bottom-up approach is higher, you’ll know that you could have excess capacity issues. You need to consider scaling that back or otherwise expanding your product/service offering to drum up additional demand.
Conversely, if your top-down analysis reveals that demand is in excess of capacity, then you are leaving money on the table. Time to start thinking about what you can do to scale up and capture as much of the market as possible.
Let’s start by taking a look at a bottom-up approach to estimating the market size for a business plan.
Bottom-up approach example
On my sister site, InvestSomeMoney.com, I researched three real-life examples of a bottom up market sizing approach. In those examples, you’ll see that they sometimes mix in a little top-down analysis with their bottom-up approach and vice versa. There’s no rule against doing that, but I would rather look at things from two totally different perspectives.
When using a bottom-up approach, try to start with the most simplistic piece of firm information you can get your hands on. Then, start to build on it with other information, or the best guess you can muster.
You can think of a bottom-up approach as one that focuses on how much and how often customers will buy.
This information might be something you have internally. Or, it might be from the information you found by researching online. Start with a single “serving size” of your product/service. Then, think about how often a customer would buy. Work your way up from there.
There’s still a lot to consider regarding packaging volume and dosage. That will require more thought. But, for the time being, I’m going to estimate the volume of a one month’s supply and the daily dosage to be the same as Rogaine. If that changes as I progress with my business plan, I can easily circle back to this and plug in different numbers.
With Rogaine as my benchmark, I know that a dosage of my product would be 1 mL. The product would be used twice a day. My product would come in 2 oz (60 ml) bottles. Each bottle would be one month’s supply, as I said.
Thinking about capacity
Okay. Now that I have a grasp on the package size – what about blending and packaging? If this idea were to come to fruition, I don’t picture myself blending batches in my bathtub and filling bottles with a ladle and a funnel. I would need access to some sort of industrial equipment.
Fortunately, a quick internet search shows that there is no shortage of contract blenders and packagers out there. Especially for food and supplements. What it costs, remains to be seen. That’s an issue for another time. For now, I just want to get an idea of how much I could manufacture.
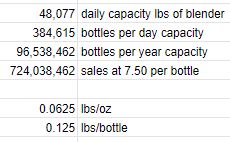
This company claims it can blend 1.25 million pounds per workday. We’ll assume, for now, this represents the average contract blender/packager. What does that translate into in terms of 2 oz bottles?
First of all, I wouldn’t need all 26 of their kettles. Only one, tops, especially at startup. So, if we divide the 1.25 million pounds by 26, we get a per kettle capacity of about 48,000 lbs per day.
Pounds are a weight unit of measure (UOM) and ounces are a volume UOM. To make the conversion, we’re going to have to do some more estimating.
Water weighs a little over 8 lbs/gallon. We’ll assume my product has roughly the same density.
8 lbs ÷ 128 oz (per gallon) = .0625 lbs/oz. With each bottle containing 2 oz, we know that it’ll weigh approximately .125 lbs/bottle.
This means that with one of this company’s kettles, I could blend 384,615 bottles worth of product per day. 96.5 million bottles per year. At an approximate sales price of $7.50 per bottle, that translates into nearly $725 million in revenue per year.
Okay, I’ve looked at things from a bottom-up, capacity-focused approach. Let’s now consider a top-down, demographic-focused analysis.
Top-down analysis
Not surprisingly, I also wrote a post on InvestSomeMoney.com with examples of a top-down analysis to determine market size for a business plan. When you read through it, you might notice that some of the examples use Census data (or something similar). They take big chunks of information and start narrowing down their market from there.
Which brings us to three important terms for performing a top-down analysis. These are:
Total addressable market (TAM) Serviceable available market (SAM) and Serviceable obtainable market (SOM)
A SOM is a fraction of the SAM. In turn, a SAM is part of the TAM.
The TAM can be thought of as every potential customer that you can reach geographically. The SAM is what’s left when you niche down a little into the population that is a good fit for your unique selling proposition. Finally, the SOM represents the percentage of the SAM you can realistically expect to take.
It’s unlikely that you will ever capture 100% of the SAM. Even in a specific niche, you can’t be everything to everyone. That’s alright, though. The goal of this exercise is to make realistic estimates so that you have a sound business plan to work from.
When doing a top-down analysis, start with a large population or an overall industry size. From there, narrow down your customer until you arrive at your SOM. It helps to have a “customer avatar” in mind before starting a top-down analysis so you know where to niche down to.
I would suggest you perform a business plan demand analysis first to get a crystal clear picture of what that avatar is. You might think you know it intuitively. But you might be surprised at what you find – like I was!
A top-down analysis for my business plan
I know that not every person in the U.S. (much less the world) is going to want or need an all-natural topical supplement for hair loss. Who might though???
I’ll refer back to my handy-dandy business plan demand analysis (linked above) to see what I can find.
Here, I’m reminded of the ages that men and women first started experiencing hair loss. I’m reminded of the percentage that has sought any sort of treatment. Finally, I’m given an idea of what types of treatment they have tried.
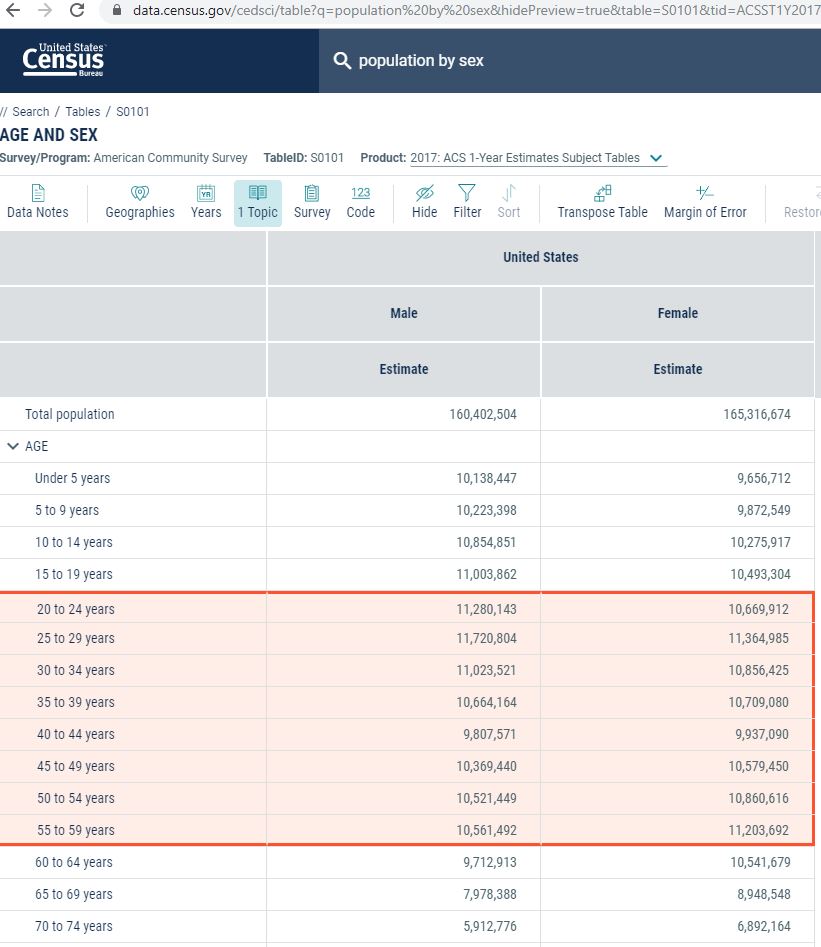
A quick visit to Data.Census.Gov and I find table S0101, which gives me the U.S. population by age and sex. I customize and filter the table real quick. Then, I copy and paste the data I need into my spreadsheet.
Next step is to narrow these numbers down. I’ll use the “regular” numbers and the pessimistic numbers from sensitivity analysis from my business plan demand workbook.
I want to know the percentage of men who have had hair loss and tried any sort of treatment. Then, I want to go deeper and estimate the number that has found supplements to be effective. I’ll do this for both the most-likely and the worst-case scenarios. On the women’s side, I’ll do, more or less, the same thing.
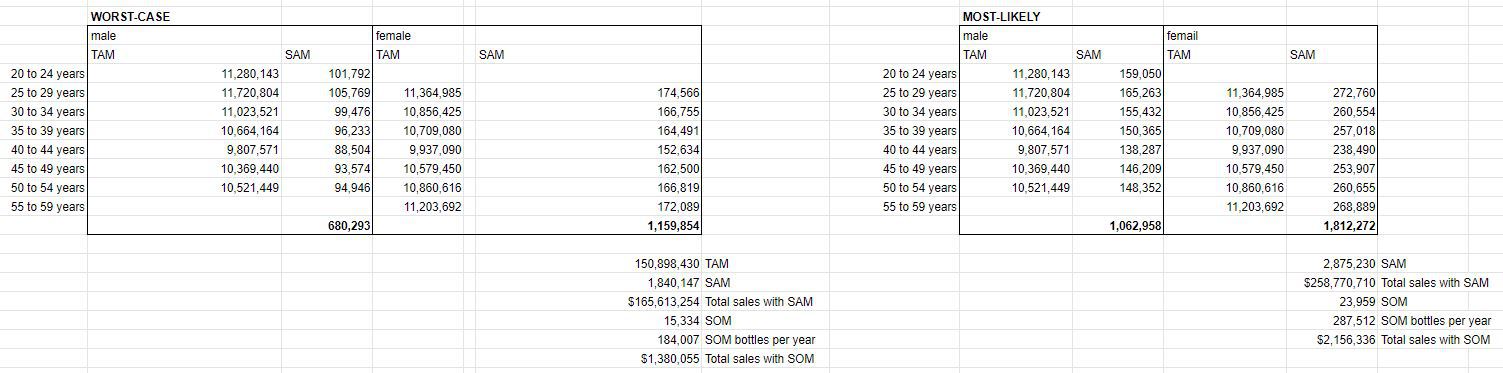
TAM and SAM
You’ll see that I didn’t use the same age ranges for men and women. I assumed that males would start experiencing hair loss earlier, but would also stop caring about it earlier too.
The age range for males in my TAM was 20 – 54. For females, it was 25 – 59. This translates into a TAM of 151 million people in the U.S.
For the SAM, my worst-case scenario estimated that .9% of the male population in the target age ranges would be part of my market. 1.54% of females in the target age ranges were also assumed to be part of my market. This translated into a worst-case SAM of 1.8 million people.
As for my most-likely SAM, I estimated that 1.41% of males and 2.4% of females in the target age ranges were potential customers. This resulted in a SAM of 2.88 million people. Over a million more potential customers.
SOM
SOM is tricky.
Who’s to say what percentage of the SAM my company could capture? Obviously, it would start at 0% and work its way up from there. Where would it stop though?
It will depend, in part, on the number of companies vying for this niche. As I often do, I will refer to the Pareto principle. The Pareto principle states that 20% of the inputs will be responsible for 80% of the outputs. Put another way, 20% of the companies will have roughly 80% of the market share.
I’ll refer back, again, to my post on business plan demand. In it, I found three direct substitutions for my topical hair loss product. I won’t include Minoxidil (Rogaine) in that group, because of its unnatural chemistry.
Again, without getting too mired in math, I estimate that there are approximately thirty companies in the topical hair loss supplement space. This was a quick and dirty estimate based on the results of an internet search.
Six of those thirty companies probably control 80% of the market. That leaves 4.2% (1 ÷ 24) of the remaining 20% as my short-term SOM. Obviously, if my product were to take off, that amount could grow considerably and could approach the SAM.
What that means as far as the market size is 15K people worst-case and 24K people most-likely. At 12 bottles purchased per year, this translates into 184K and 287.5K bottles per year respectively.
Here’s a look at the spreadsheet breaking that all down:
Click to enlarge
Comparing a bottom-up and top-down analysis when determining market size for a business plan
Obviously, a couple hundred thousand bottles (top-down) is a far cry from 96.5 million (bottom-up). So, it would appear I will not be capacity constrained in the near future. In fact, as this startup moves forward, I need to make sure I’m not over-buying capacity. Those huge fixed costs could kill my business before it has a chance to get off the ground.
Speaking of fixed costs, the information from this analysis has given me good data to build my pro forma financials – when that time comes.
Now, at some point in the future, selling my product internationally could be an option. However, in this tiny niche, it is unlikely that I’ll ever need that much capacity for this one product.
Market size for a business plan
What were there factors I didn’t consider (but should have) when estimating my potential market size?
Small businesses and entrepreneurs use demand analysis to:
Consider substitute products and services
Get input from (potential) customers
Determine what “drives” demand
Understand what variables affect demand and to what degree
Demand analysis is about challenging your preconceived notions regarding your product/service. A stress test, if you will. A demand analysis will take your idea and start molding it into something that has even higher potential.
As an entrepreneur, you can’t be too stubborn. You have to be flexible. After going through this process, the hope is that you’ll come out the other end with an even more refined idea and a greater chance at success.
Market research and competitive analysis for a business plan
This is the second post on drafting a business plan for your startup. These posts are modeled after the SBA Business Guide.
When first thinking about the market for your product/service, don’t define it too narrowly. Try to think of substitutions that you might not have otherwise considered. No, you might not compete directly with these substitute products, but the presence of substitute products will have an impact on your pricing and demand.
Pricing too high could push customers to these substitute products. Even if that pricing seems in line with your value proposition when compared to direct competitors. But, theoretically, the amount demanded changes (inversely) with the price. A higher price will push customers to consider alternatives. A lower price should result in a higher volume sold.
Further defining the market for my product
As I mentioned in my first business plan post on the topic of demographics, I am working alongside you. I have a prospective product that I would like to explore the viability of, and I am creating a business plan for this product as I write these posts. As a reminder, my potential product is an all-natural hair-thickening topical supplement.
Anyhow, in the previous post, I used “customer avatars” to roughly ascertain the size of my market. I think I was fairly liberal in that estimation. The three of my avatars that were the most detailed totaled approximately 5.2 million people. The avatar that was broader included 6.5 million people.
As mentioned above, I have to keep in mind that not all of these people will pursue hair loss treatment. Many, will just accept it as a normal part of aging. Others will choose to address the problem but will pursue an alternative treatment method to topical supplements. Some of these alternative treatment methods include:
Obviously, there’s no shortage of alternatives to my prospective product. However, many of these treatments are ongoing and the potential exists for customers to combine them.
After listing these potential substitutions, it dawned on me that there are a couple of different classes of hair loss. I would probably target individuals that are in the early stages and are merely looking for help to slow down and, hopefully, somewhat reverse the initial effects of hair loss.
Another thing that dawned on me when researching substitutions is that it might be a mistake to only consider men when ascertaining the market for this product. Most of the results I found when searching “hair loss treatments” were articles targeted at women.
As I said, I’m taking this journey right along with you. So, I’m refining my idea and picking things up as I go along.
Gathering survey information for your business plan demand analysis
The next steps are mostly statistical. That might give you pause if numbers aren’t your thing.
I really do wish I could provide you with the handiest spreadsheet imaginable to manage the information you find. There are just too many variables, though. Different surveys asking different questions. Not to mention, every industry is going to address unrelated topics. I just couldn’t figure out how to make a one-size-fits-all tool.
What we’re going to do is compile whatever relevant statistical information we can get our hands-on, and interpret what we find. You can input this information into your own spreadsheet if you like
Statistical information, hopefully, can be obtained from a simple internet search. “[your topic/industry] survey results”, or something similar should yield some useful information. If you can’t find relevant info, then you might have to reach out to industry trade magazines or organizations.
As far as how much survey information to collect – there’s no clear answer. It depends, first and foremost, on the abundance of such information. If there is plenty available, then I guess I’d recommend collecting it until you’re tired of doing so. You can always circle back around and search for more specific results if you need to in the future.
What to focus on
Right now, focus on demographics information, substitute product information, and information about motivation (drivers).
This is where having it in a spreadsheet will come in handy. With the numbers in a spreadsheet, you can combine survey information and break it down as needed. Check out my example below to see what I mean.
Click to enlarge
Survey information about my product
There was no shortage of survey results regarding hair loss. In fact, I grew tired of collecting information well before I was able to read it all.
I must admit, I learned something on this step. I learned that it probably makes more sense to do this research before creating customer avatars rather than after.
This research showed me that hair loss in women is a considerably more prevalent problem than I knew. So, I should definitely not exclude women when trying to calculate the size of my target market. Additionally, I learned a lot more about the age that hair loss starts to affect men and women. Not to mention, a lot of other interesting tidbits related to marketing and substitute products.
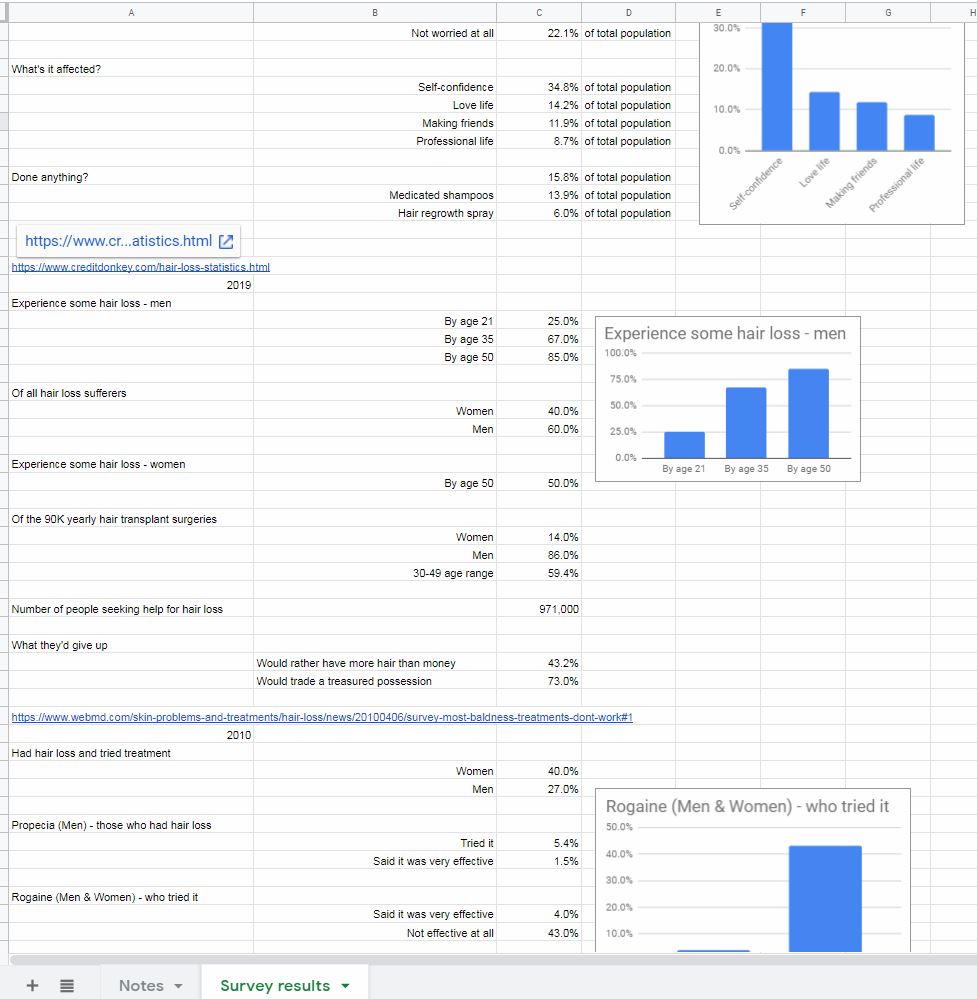
I simply typed the figures I found into the cells and tried to organize it in a somewhat easy-to-read format.
To make this information as useful as possible, I also included a link to the survey – in case I wanted to reference it again. Also, I thought it would be useful to make note of the year the survey was conducted. That way, I could note trends, if any existed.
Finally, to top it all off, I put in some charts. Charts can help to illustrate ideas in a way that numbers can’t, sometimes.
Now, I have a nice little foundation of data to build my business plan off of. I also know that there is plenty of other information out there if I want to delve further on a specific topic.
Divide total industry demand into its main components.
Now, you want to start to organize the information you found in a logical manner.
First, isolate the information related to demographics or that which otherwise describes your potential customers to you. You want to break this information up so that you can get an idea of what your potential customers might look like. You should, hopefully, begin to see customer “avatars” take shape.
Yes, I asked you to create avatars in the previous post. As I said above, that was probably premature. It would make more sense to create the avatars with this survey information, then use the census/demographic information to estimate the size of the market based on what you found.
Live and learn…
After you have the demographic information in good order, move on to the “solution” information – if available. This is information that specifies how customers are solving their problem(s) now.
If you’re lucky, this information will join seamlessly with the demographic information you organized above.
Start with the simplest questions (those with the fewest variables) and expound from there.
What if my survey data is inconsistent?
You might run into a situation where you have conflicting information. Or you might find yourself in the fortunate situation where different surveys seem to corroborate the same statistics.
If your information sources don’t jive, you have a couple of options. First, you can move forward with the information you deem to be the most trustworthy. Or, alternatively, you can average what you found. This works well if the differing results are relatively close together. Finally, you can choose to use the data source that is most recent – particularly if your industry is especially dynamic.
All of your numbers aren’t going to jive up perfectly. However, at this point, you are armed with a lot better information than when you started. Better information will ultimately lead to better decisions.
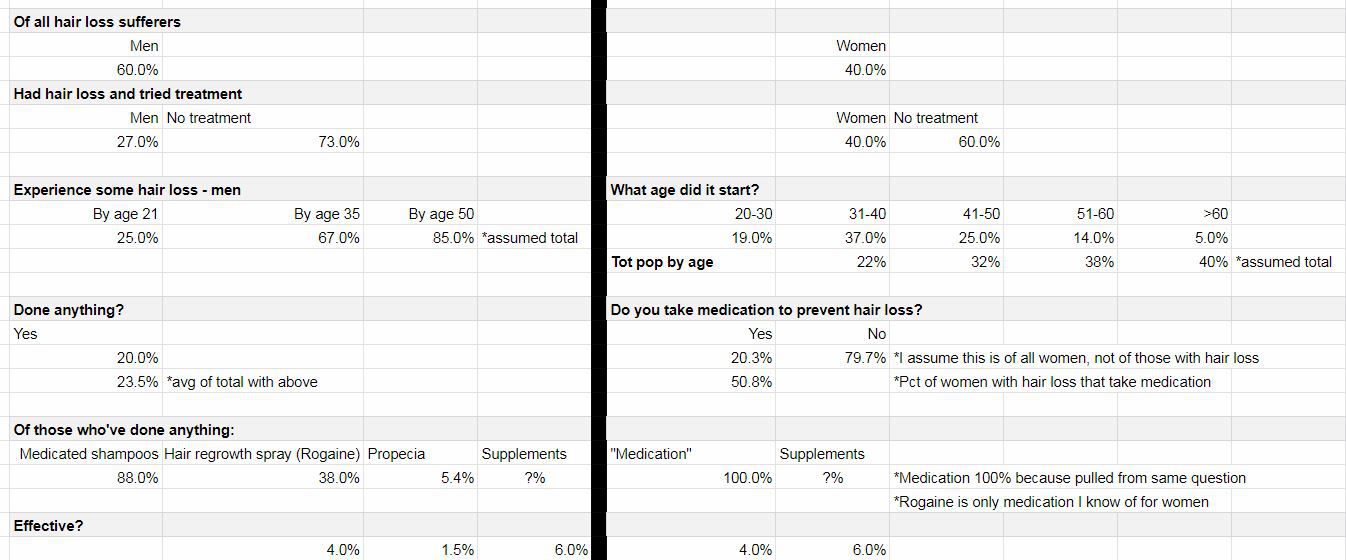
Industry components for my product
Demographics
For my part, I like to start simple and divide my demographics based on the variable with the fewest options. In this case, the simplest variable only has two choices – men and women.
From there, I used information that I found regarding the percentage of men and women that have had hair loss and have tried treatments.
Next, I break things down further based on the age that men and women started experiencing hair loss. I was fortunate to find information for both genders.
That’s the extent of demographic information I was able to obtain. I would have liked to have found some information regarding income or socioeconomic status. If that information proves to be critical as I move forward with my business plan, I’ll have to circle back around to see if I can track it down.
Once I felt good about my (revised) customer avatars, I moved on to “solution” information.
Again, thanks to the abundance of information I was able to find, I found similar questions for both genders. The first question was the simplest. It asked if the person with hair loss had done anything to address the problem.
From there, I had a couple of survey questions that explored the alternatives that hair loss sufferers had tried in the past. Additionally, I found results that gave insight into how effective these alternatives were.
When all was said and done, I had the groundwork laid for the ability to know how many potential customers I might have, their demographics, what they have tried so far, and how well those alternatives had addressed the issue at hand.
Here’s what my worksheet looks like after sorting my information into industry components:
Click to enlarge
Business plan demand analysis of drivers
Hopefully, in your search for survey results, you came across some information that provided insight into the “why people buy” question.
In particular, we’re looking for drivers of sales here. Specifically, what circumstances compel a customer to buy your product/service (or a substitute)? Hint: people usually buy to solve a problem. To avoid pain, not seek pleasure. Or, so I’ve been told…
Insight into what compels your customers to buy will not only be valuable in the drafting of the remainder of the business plan but in all your marketing efforts once you are up and running.
The information about who your customers are (from the previous step), why they buy, and what steps they are currently taking to solve their problems (also from the previous step) will hopefully paint a clear picture for you. A picture that will guide you to a point where you can position your strengths in a manner that will help other people’s weaknesses.
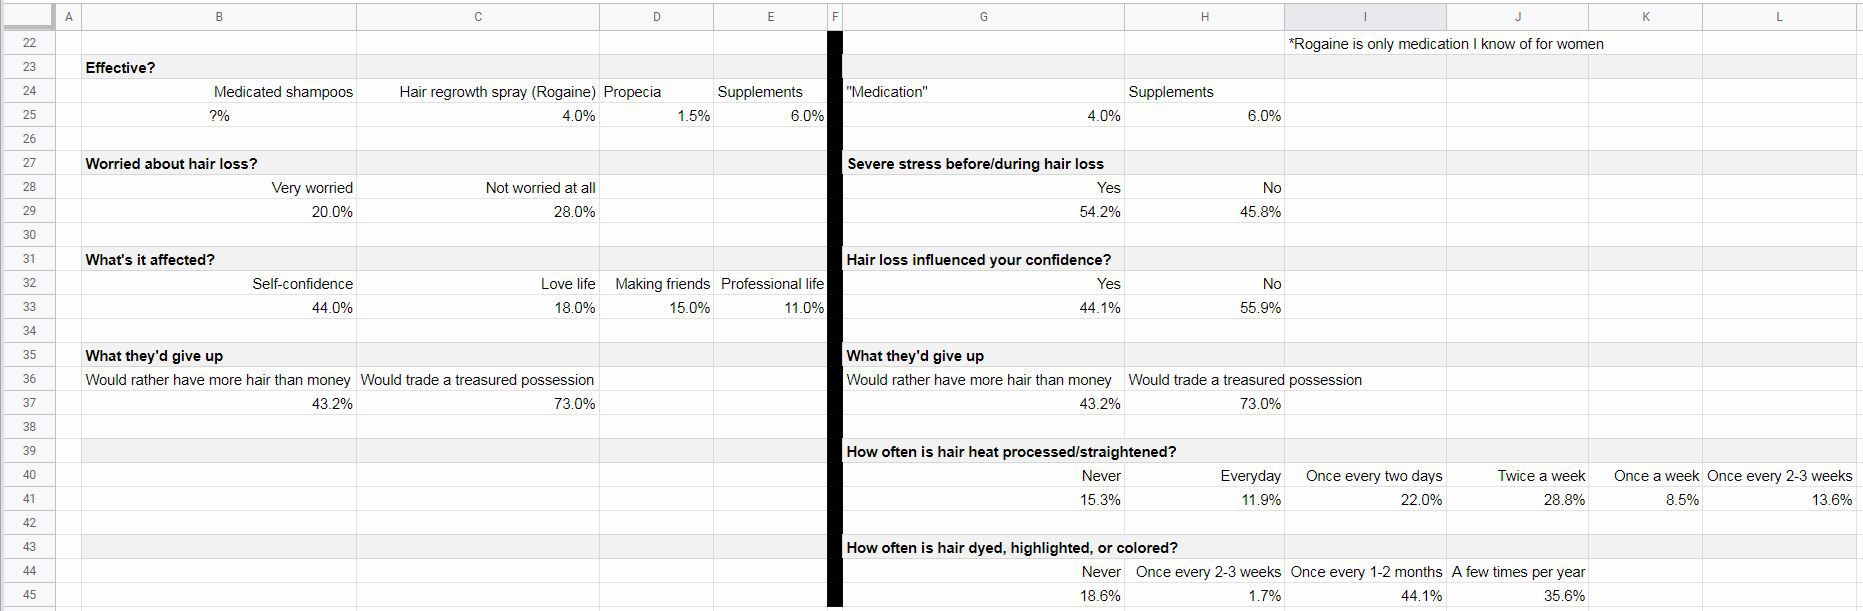
Understanding the drivers of demand for my product
Again, I was fortunate to have an abundance of survey information to draw from. A couple of my surveys not only touched on how hair loss made people feel but also on specific actions that they had taken before the hair loss started.
This information tells me an angle I can take when marketing my product, plus where a lot of my potential customers are going before they start to experience this problem. That place…the hairdresser.
Of course, that’s for women. Though there’s no rock-solid proof that it’s hairstyling that is contributing to hair loss in women, there is enough correlation to make a compelling case. For men, on the other hand, hair loss just seems to be the hand that most are dealt.
But, before we get into that, let’s look at some of the emotional drivers that might compel customers to purchase a topical hair loss supplement…
Drivers for men
On the “men” side I got information about how “worried” men were about hair loss. This told me that most men were, at least, “somewhat” worried about hair loss.
Beyond that, there was valuable information about how hair loss had affected them negatively.
Finally, the most valuable information, to me, was a question of what they would give up to solve this problem (men & women). The answers were encouraging for someone who was hoping to build a business in this industry. Almost half would rather have more hair than more money. Three quarters would give up a prized possession for more hair.
While I acknowledge that I’m not marketing a guaranteed cure to hair loss, that tells me that people are willing to try anything to fix this problem. As I know from my market segmentation analysis, supplementation works for about 1 in 17 people. Not great odds, by any means. But good enough, I hope, to at least try a new product. Especially when the ingredients are all-natural and offer no downside.
Drivers for women
About half had stress prior to experiencing hair loss. That’s a coin flip. It doesn’t mean that the hair loss was caused by the stress (though it surely didn’t help). But it provides insight into what women are feeling prior to and while they are experiencing this problem.
I also included the “What they’d give up” question on the women’s side of the analysis because my source for that information didn’t specify either gender. Plus, it seems feasible that women would feel the same or even stronger. It’s my opinion that society values female attractiveness above male attractiveness.
Finally, we get down to the brass tacks. A potential cause-and-effect situation for the problem I’m attempting to address. The number of women that are currently experiencing hair loss are also (possibly) straightening/heat processing or getting their hair colored on a semi-frequent basis.
This tells me that hairstyling might play a part in a lot of women’s hair loss (this goes back to the pressure to be attractive thing). Therefore, I should consider marketing my product in salons and other establishments that focus on women’s hair.
There’s still a lot of analysis to be done. But, two steps into the process of drafting my business plan, I feel a lot more confident about my understanding of the environment.
Here’s a look at my spreadsheet with the driver information included:
Click to enlarge
Business plan demand analysis of sensitivity
To this point, the goal has been to make assumptions and get answers. We want to have a better understanding of the environment in which our business will operate. Hopefully, you feel that you’ve accomplished that.
But, we don’t do ourselves any favors by lying to ourselves.
Lying?
Well, yes. But probably not willingly.
You start off excited about your business idea. So excited that you decide to take the first step (something that the vast majority of people won’t do). You begin to write a business plan. You can feel your idea taking shape. You’ve already refined your idea a bit and feel that by the time this whole exercise is over, there’s no way you can fail. You’ve got momentum and your confidence keeps increasing.
That is all very good. Confidence is key. But, if everything looks rosy, you might be blind to a risk that could put your baby in jeopardy.
So, I don’t want to be a killjoy. But, for the sake of our businesses, let’s take a step back and play devil’s advocate. We need to ask ourselves some tough questions and challenge our assumptions. If we can rise to these challenges, and address them with confidence, our chances of success are that much greater.
Go back through your segmentation and demand drivers and think critically about this information. Some statistics might be a given, without much wiggle room. Others might be misrepresentative of reality. In these instances, tap into your inner cynic.
Make notes of what the worst-case scenario might look like. If you’re using a spreadsheet, like me, maybe use a different colored text. Address things like survey questions that might have been misinterpreted or alternative explanations for results.
Don’t get too down-and-out here and don’t dwell on this step too long. You don’t have to necessarily plan what you would do if these worst-case scenarios came to be. You just need to imagine them so that when the time comes for serious planning, you can take these risks into consideration.
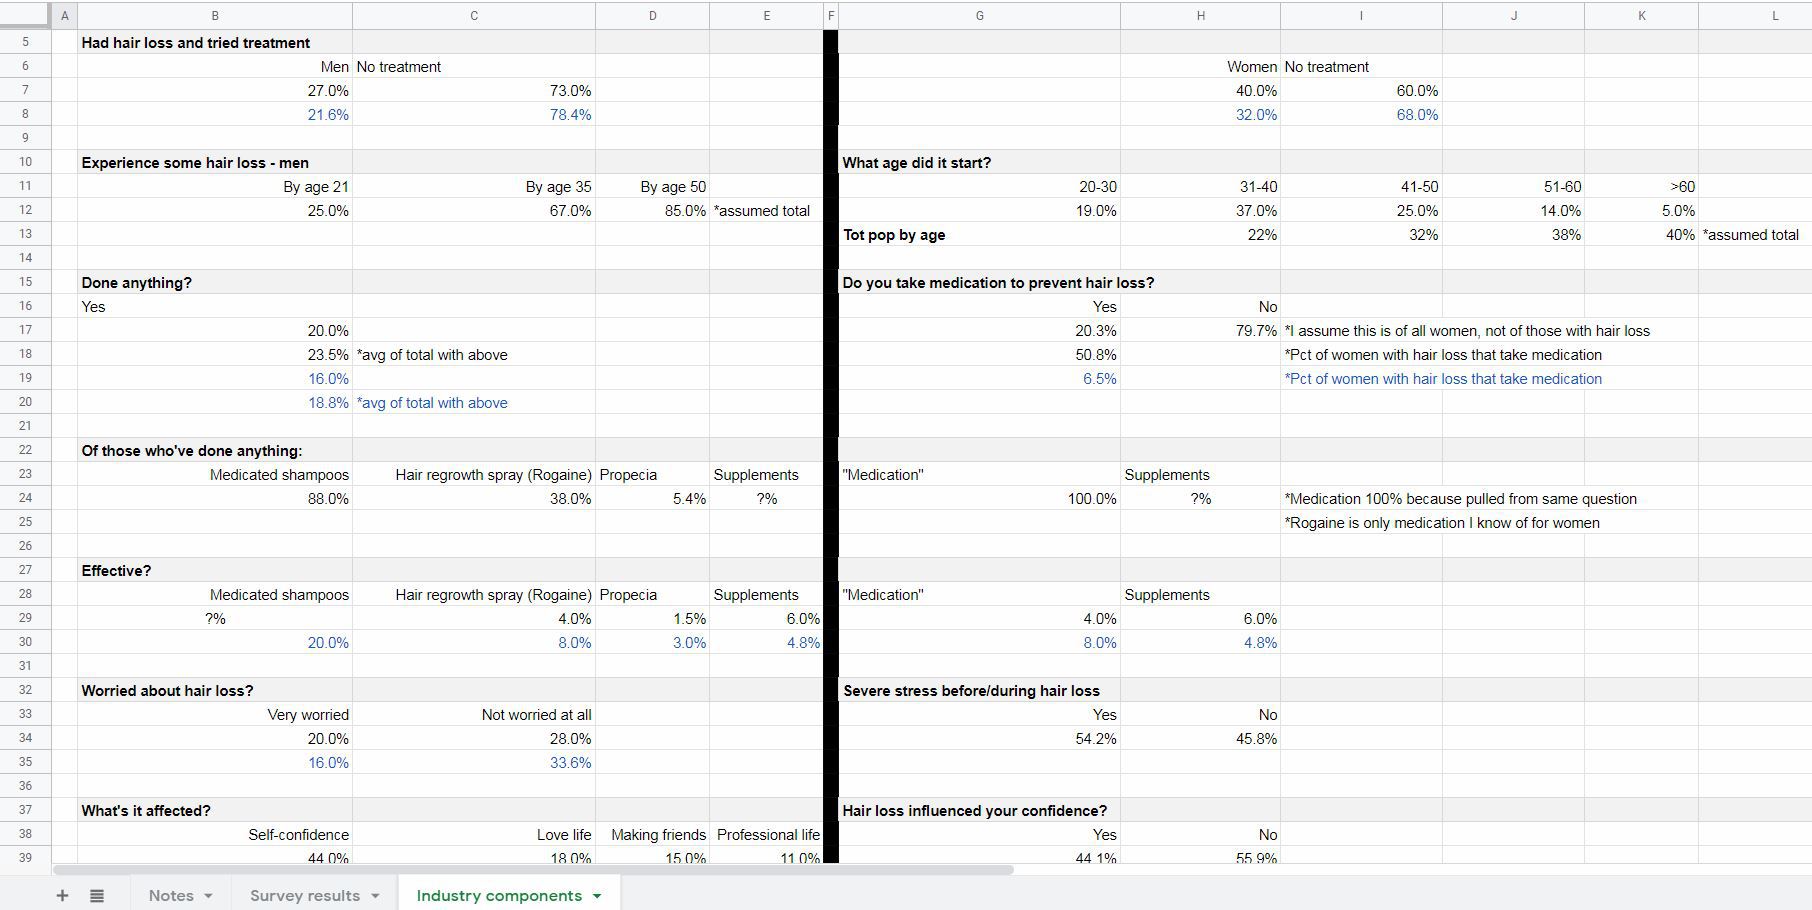
Demand sensitivity for my product
Demographics
I think my categorization by demographics is pretty safe. It’s rather well established how many men and women experience hair loss. The only thing that I might tweak is the number of men and women who have had hair loss and tried treatment. I lowered those estimates by 20%. It could be that the respondents’ interpretation of “treatment” is to comb their hair a different way or to shave their heads rather than to buy a product to battle hair loss.
Furthermore, what if the number of people that have “done anything” is lower? What if I misinterpreted the question for women that asked: “Do you take medication to prevent hair loss?” Maybe it was 20% of women who actually had hair loss rather than all women? The effect of that would be dramatic.
Substitute products
What if the alternative treatments were more effective than I’ve been led to believe? It could be that the respondents only consider “effective” to be a restoration to a full, thick head of hair? Also, just because they consider them ineffective, it doesn’t mean that they’ll stop using them. They might think that all of their hair will fall out if they stop (which could work in my favor, though). Perhaps they were overly optimistic when it came to supplements? It could be that supplements gave them other benefits, but didn’t make their hair loss any worse – so they considered them “effective.”
Drivers
Could it be that fewer men are really “(very) worried about hair loss” than I’m led to believe? Are more are “Not worried at all?” Plus, it might be that those who are only “somewhat worried” aren’t motivated to do anything about it.
As far as confidence (love life, making friends, professional life) goes, it might be that that hair loss is a contributor to low confidence, but not the primary driver. Maybe they’re overweight or socially awkward and that’s why they lack the confidence they desire?
As far as “what they’d give up” it could be that the respondents were primed by the hair loss questionnaire to be more self-conscious than they usually are. If it came down to it, perhaps not so many would be willing to part with valuables to solve this problem.
Finally, as far as hair styling being a cause of hair loss in women, it could be that I am wrong. Maybe hair styling has no effect on hair loss. Or, maybe women overestimate how often they heat process or color their hair. It only feels like every day/once every 2-3 weeks. When, in fact, they do it a lot less often.
Okay, that’s enough pessimism. It seems unlikely that every worst-case scenario would be true. But, there’s probably a mix in there between my initial interpretations and the not-so-great ones.
This exercise should help me going forward to make realistic forecasts and assumptions. Which, in turn, should help me be proactive to some of the challenges I might face.
Here’s a final look at my spreadsheet with my worst-case notes in blue:
Click to enlarge
Business plan demand analysis
This step takes a little bit of thought and a decent amount of research. This is done to give you a deeper understanding of the market you hope to compete in and the customers you hope to sell to.
What other steps would you have taken to refine estimates of demand?
Do you think my demand sensitivity was rational? Or, was I taking it too easy on myself?
Businesses use operating leverage to keep costs fixed when they expect extraordinary sales volume. Keeping costs fixed means that businesses can carry more of that revenue to net profit.
The degree of operating leverage is a formula used to calculate how much operating leverage a business is employing. This formula tells you what will happen to operating profit when revenue increases or decreases.
The degree of operating leverage can be calculated two ways.
The first calculation looks at past costs:
Degree operating leverage = % change in Operating profit (EBIT) ÷ % change in Sales
If you don’t know your cost mix (variable vs fixed) then you don’t know how it’s affecting your small business. You don’t know if it would be advantageous to change the mix. And, if you did, what would happen. You don’t have a complete picture of your business and, therefore, aren’t making fully informed decisions.
Download the operating leverage workbook
Complete the form below and click Submit. Upon email confirmation, the workbook will open in a new tab.
Degree of operating leverage and fixed costs
Operating leverage is the use of Fixed costs in order to amplify changes in Operating profit due to a change in sales.
Fixed costs might be considered risky because they do not change no matter how much you produce. But, they also don’t rise if you produce (and sell) more. The risk and reward go hand-in-hand.
The degree of operating leverage is a ratio that tells you how much your Operating profit will change due to a change in Sales.
For instance, if your degree of operating leverage is 5.0, then a 10% increase in Sales will translate into a 50% (5.0 × 10%) increase in Operating profit – all other things being equal.
Conversely, a 10% decrease in Sales will translate into a 50% decrease in Operating profit. The pendulum swings both ways.
Which formula should you use to calculate degree of operating leverage?
You can determine your small business’s degree of operating leverage through a couple of easy calculations. Or, you can just plug your numbers into the free workbook!
Some suggest calculating the degree of operating leverage as follows:
% change in Operating profit (EBIT) ÷ % change in Sales (Source)
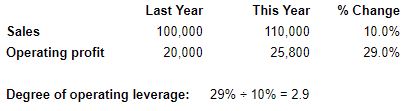
For instance, comparing this year to last year, let’s say your Sales increased 10% and your Operating profit increased by 29%.
29% ÷ 10% = 2.9. That was your degree of operating leveragelast year. This formula doesn’t tell you what it is now.
In order to calculate your degree of operating leverageright now, use the following formula:
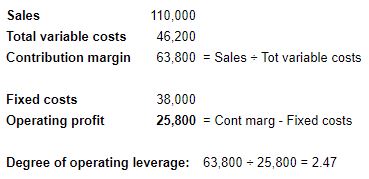
Total contribution margin ÷ Operating profit (EBIT)
If you’re not familiar, Total contribution margin = Sales – Total variable costs. Not just manufacturing variable costs (Variable COGS), but SG&A variable costs too.
Degree of operating leverage and profit
Your degree of operating leverage can give you insight into the risks you run from your cost structure (mix of fixed and variable). It tells you how susceptible your Operating profit is to changes in demand.
It will also allow you to know how much you need in Sales to breakeven. The higher your Fixed costs, the higher that breakeven point will be.
Beyond that, it tells you if your Fixed costs are in line with your ability to generate Sales. If that ability is high, then your company can benefit from the leverage provided by Fixed costs and can earn excess returns.
Conversely, if those Fixed costs are locked into assets that won’t contribute meaningfully to Sales, then they are going to be a drag on Operating profit. You’re always going to be fighting against them.
Financial and operating leverage are similar in that they employ the use of fixed costs in order to (hopefully) amplify the effects of sales on net profit and operating profit respectively.
Here are a few of my thoughts on the subject:
Since financial leverage is owed for years to come, it is, obviously, long-term. Therefore, it should be used on long-term projects. Projects that will bring in extra revenue for years to come. Hopefully, even, beyond the point when the interest is paid off. Don’t use financial leverage for something that will provide a one-time spike in sales.
Operational leverage, on the other hand, is tied to assets that can be disposed of. They’re not very liquid assets, certainly. But they are typically a burden that can be relieved of easier than contractually owed interest. Real estate can be sold, salaried employees can be laid off. And so on…
Ironically, financial leverage is frowned upon and looked at as riskier than operating leverage. However, both essentially serve the same function. They’re components of the income statement entered at different places.
Fixed expenses can be a powerful lever or concrete boots that drag your company down. It’s all about how those fixed expenses are put to work.
How to understand and act on your degree of operating leverage
Once you know what your Degree of operating leverage is, then you will know what changes in Sales will mean for your Operating profit. If you don’t anticipate that Sales can be increased, then you’re going to have to explore means to reduce Fixed costs.
On the other hand, if you anticipate the Sales will improve next year, then you have to ask yourself if you’re willing to add more Fixed costs (that will further increase Sales). If you’re confident you can do so, you might have a really great year.
A change in sales or variable costs and the effect on a company’s financials
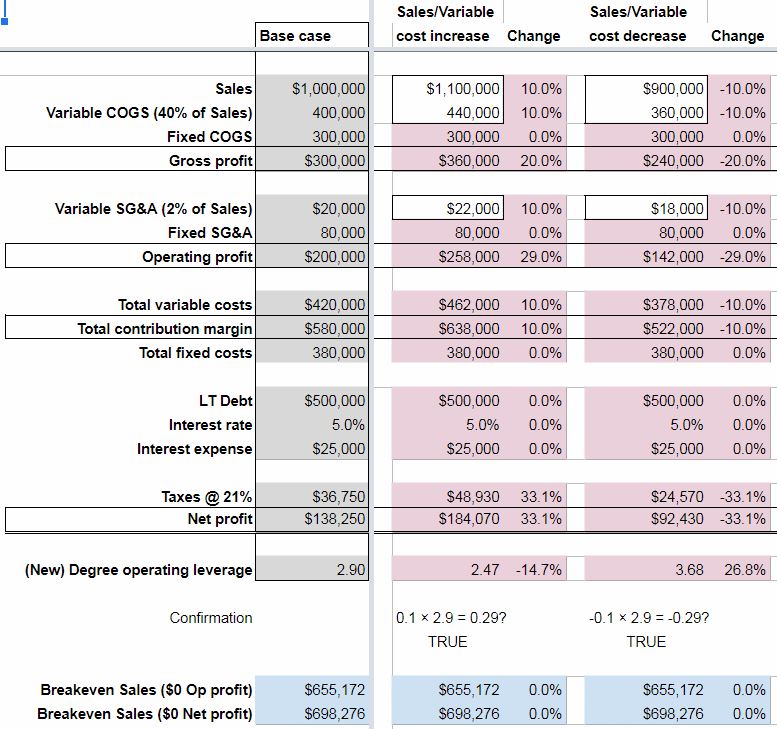
As can be seen on the Effects of changes worksheet – a 10% increase in Sales, Variable COGS, and Variable SG&A would translate into a 29% increase in Operating profit from the Base case. This is to be expected since the Degree of operating leverage for the Base case was 2.90 (10% × 2.90).
Keep in mind that Variable costs would increase at the same percentage as Sales – as is their nature.
The flip side is also true. A 10% decrease in Sales and Variable costs means a 29% drop in Operating profit (-10% × 2.90).
Note that the Breakeven Sales amount doesn’t change in either scenario. This is because Fixed costs didn’t change.
A change in fixed costs and the effect on a company’s financials
“Why would fixed costs change?” you might ask. “They’re fixed,” you say.
Well, in theory, they don’t. But in practice, they might.
First, not many costs are 100% fixed or variable. It’s a sliding scale. Over a long enough timeline, all costs are variable they say.
Also, Fixed costs are often tied to fixed assets. Fixed assets are acquired and disposed of over the years. Salaries, which can comprise a lot of Fixed costs too, fluctuate with the hiring and loss of employees.
So, as you can see, it’s not much of a stretch for Fixed costs to change.
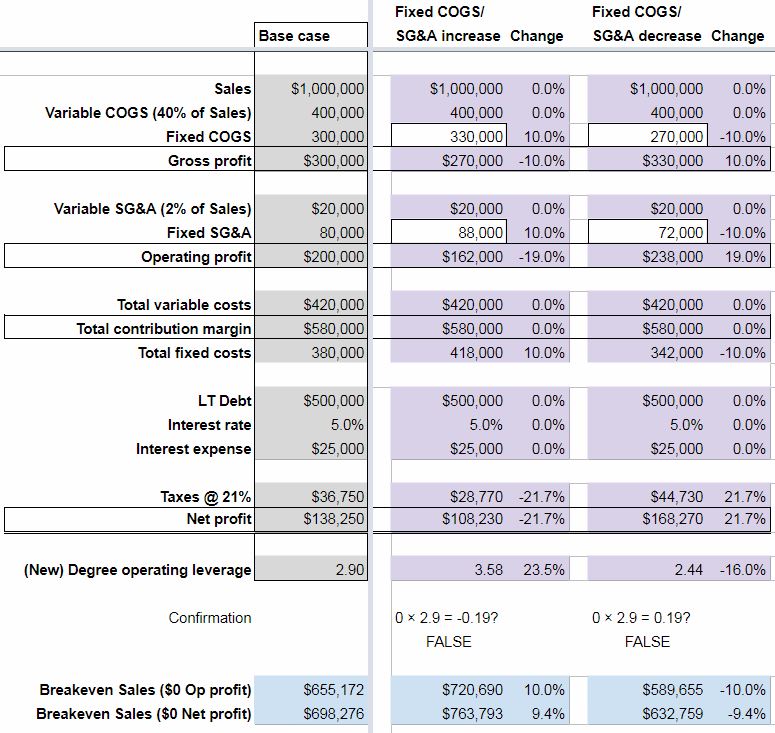
When they do, we can see that a 10% increase in Fixed costs translates into a 19% decrease in Operating profit. Not at all what we would expect from our Confirmation equation. 0% × 2.90 = 0%! Operating profit shouldn’t change!
But in this hypothetical example, it did. And, in real life, it could.
Of course, the opposite was true too. A 10% decrease in Fixed costs meant a 19% increase in Operating profit.
Notice, too, that a change in Fixed costs meant a change in the opposite direction for the Breakeven Sales amount. Not surprisingly.
What will the degree of operating leverage tell you about your company?
Don’t forget, you can get insight into the degree of operating leverage for your own business by accessing the accompanying spreadsheet for this post. Just enter your information in the white cells on the Your degree of operating leverage worksheet.
Fill out the form at the top of this post ↑ for quick, easy, free access.
What are your thoughts on the use of operating leverage vs financial leverage?
What is your degree of operating leverage and would you like to increase or decrease fixed costs?
Financial leverage is simply the act of borrowing money to invest. This is done with the hope of earning a return on that money. A return that is greater than the cost. Often, the potential for gain is disproportionately bigger than the cost. But, the cost is fixed and will be the same regardless of the return earned. Small businesses must learn how to effectively manage their degree of financial leverage. Otherwise, they could find themselves buried under the weight of repayment.
Let’s talk about some of the advantages and disadvantages of financial leverage. Also, how the degree of financial leverage ratio can provide insight into net income.
Download your copy of the workbook used in this post
Complete the form below. Upon email confirmation, the workbook will open in a new tab.
Financial leverage advantages
Financial leverage is a strategy that can be employed to boost gains. The cost of borrowed money (typically) doesn’t change. So, if that money can be used in a way that earns returns beyond the cost of borrowing – a small business can end up way better off than it would have otherwise.
I always say that every investment comes down to three things – cash in, cash out, and time. If the cost of leverage (cash out) is low enough and the terms are favorable (time), then the cash in has the best opportunity to be big enough to make financial leverage worthwhile.
High financial leverage helps small businesses avoid dilution of earnings from the issuance of equity. It also gives them the ability to put more money to work than they would have otherwise. Both of these advantages can translate into excess returns.
Additionally, interest is tax-deductible. This lessens the tax burden that a company would realize if the same funds were raised through equity. Keep in mind that interest is a fixed cost. A fixed cost that can negatively affect a small business if operating profits aren’t high enough.
Financial leverage is a better fit for some businesses than others
On my sister site, I’ve written often about the benefits of certain business models. For businesses with the right business model, more financial leverage could be very beneficial. This is if it brings in more long-term customers. These business models are conducive to earning a good ROI on borrowed money.
Handling debt responsibly = the ability to borrow more in the future
If a small business effectively employs financial leverage, their creditworthiness improves. With improved creditworthiness, they will (likely) be able to borrow more in the future. If they continue to execute effectively, they can earn compounded returns.
The cost of borrowing (rate) could drop with a successful history of repayment. This could decrease the cost of future financial leverage. Lower cost should mean lower risk. Lower risk increases the likelihood of employing it in a successful manner.
Financial leverage disadvantages
Just as it has the potential to boost gains, financial leverage can also boost losses. Every dollar borrowed represents a little more risk. Again, that’s why the return from the borrowed monies means so much.
But, the lender doesn’t care if your small business makes 10x the cost of borrowing. Or, if it “only” makes 100% of the cost of borrowing. It expects its money back, plus interest, either way.
Borrowing money will increase your cash flow out. If the cash flow in isn’t enough to offset that, then, sooner or later, insolvency will ensue.
It all depends on the context
A lot of the negative stigma surrounding borrowing stems from the personal sector. In the personal sector, when people borrow, they often do so to buy consumer goods. Things that don’t earn any sort of return. These items actually depreciate in value. For example, cars and technology.
Nobody flinches when somebody borrows an ungodly sum of money to buy a house. This is because a house (for better or worse) is expected to increase in value.
Just as certain business models are conducive to financial leverage, others are not. Consider business models that sell time for money or one-time purchase items. These businesses will have to be confident in their financial modeling to ensure that they can earn an adequate ROI on financial leverage.
Finally, the perception of leverage depends on timing. During boom times, the companies borrowing look like geniuses. Conversely, if the economy turns against a business that has irresponsibly borrowed, then they could look foolish.
Financial leverage + operating leverage?
There are two general types of leverage that a small business can use. Operational leverage (which I plan to write about next) and financial leverage. The degree of operating leverage measures the effect of fixed costs (not interest) on operating income.
Beware compounding leverage by adding operating (fixed costs) to financial, or vice versa. This could sneak up on a small business. It could create a situation where management is caught unprepared. The result is potentially catastrophic. It’s important that scenarios like this be modeled out and planned for.
Most people understand the risks associated with borrowing money (financial leverage). The risks of operating leverage are a little more camouflaged.
Make sure you plan around your company’s (potential) total leverage situation. Annual strategic planning with an operating budget allows you to do just that.
Regulatory authorities might paint an overly rosy picture
When interest rates are kept low, the hurdle rate (minimum ROI to justify investment) is also lower. This incentivizes small businesses to take on projects that they might not otherwise. Less is demanded of investments. The pursuit of extraordinary returns might stop short in favor of quick-and-easy (but “good enough”) returns.
Also, by making interest tax-deductible, the effective cost of leverage is lowered even further. This further incentivizes small businesses to use financial leverage. Doing so could amplify any of the previously mentioned disadvantages.
Financial leverage example
The Degree of Financial Leverage shows the amplification that borrowing money can provide to profits and losses. So, for instance, in the example operating budget, the Degree of Financial Leverage is 1.4. This means, at this level of borrowing, that for every 10% change in Operating Profit, Net profit would increase by 14% (10% × 1.4).
That sounds great, but the opposite is also true. If Operating Profit declined by 10%, then this level of borrowing would cause Net profit to decrease by 14%. That’s the nature of leverage. It amplifies gains and losses.
I created a spreadsheet to model the changes in profit due to changes in other line items. It helps to better understand how the income statement is affected by financial leverage,
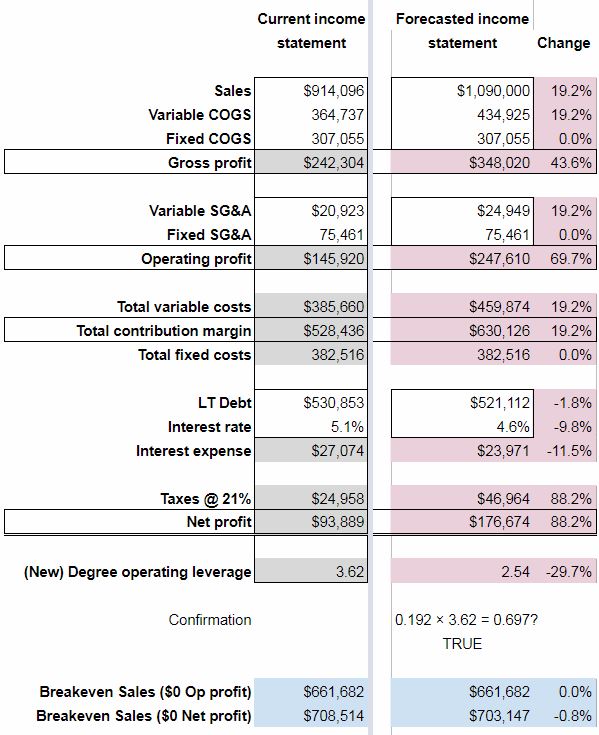
I started with a Base case income statement for a small business that has $1 million in sales. This example business also has a 20% operating margin with $500K in debt at a 5% Interest rate. Its Net profit is approximately $138K.
This company’s Degree of financial leverage is 1.14 ($200,000 ÷ [$200,000 – $25,000]).
Only one variable was changed at a time. Here’s what I found:
The effects of an increase or decrease in sales
A 10% increase in Sales translates into a 50% increase in Operating profit – all other things being equal. As expected, this 50% increase in Operating profit translates into a 57.1% increase in Net profit. This is because the Degree of financial leverage is 1.14 (50.0% × 1.14 = 57.1%).
The same thing happens, in the opposite direction. When Sales drop by 10%, Operating profit decreases by 50%. Net profit drops by 57.1%.
The effects of an increase or decrease in COGS and SG&A expenses
Since COGS is less than Sales, a 10% change doesn’t have as big of an effect on Operating profit. The result is a drop in Operating profit of 35%. As expected, the resulting change in Net profit is -40% (-35.0% × 1.14 = -40.0%).
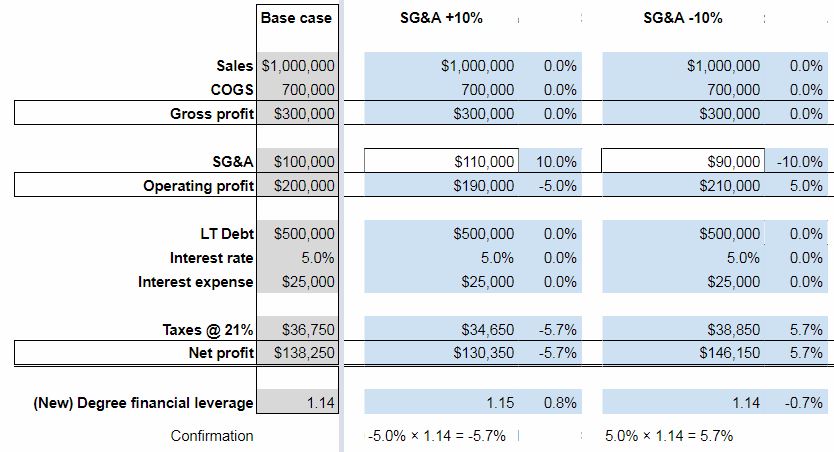
SG&A expenses, being even lower, have less of an impact on Operating profit. A 10% increase only lowers Operating profit by 5% and Net profit by 5.7% (-5.0% × 1.14 = -5.7%).
Of course, things work the same in the opposite direction. A -10% change in COGS increases Operating profit by 35% and Net profit by 40%. A -10% change in SG&A expenses increases Operating profit by 5% and Net profit by 5.7%.
The effects of an increase or decrease in Long-term Debt & Interest rates
As shown above, changes in the income statement that result in increases to Operating profit are amplified in Net profit by the Degree of financial leverage.
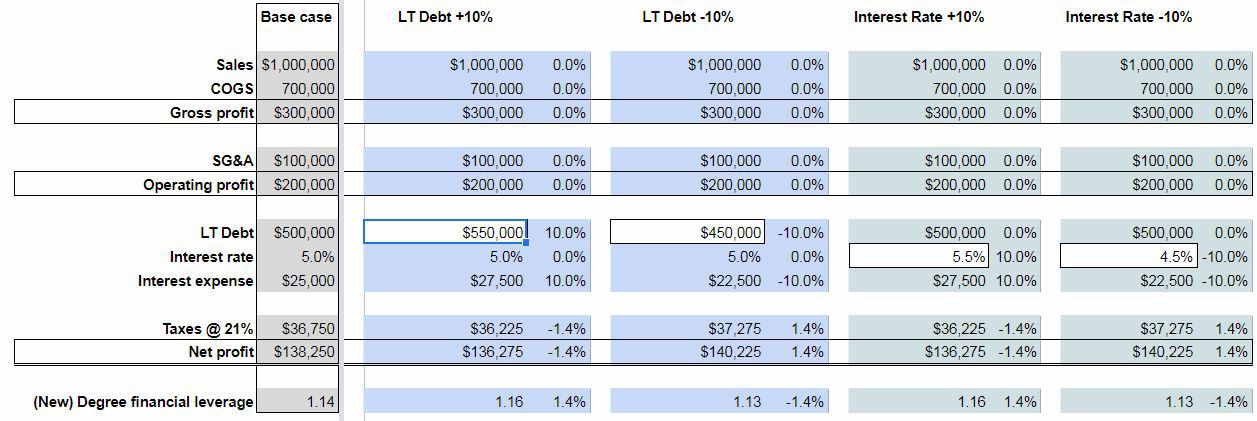
But, what about changes below Operating profit? As expected, a 10% change in either the amount of LT Debt or the Interest rate, results in a corresponding 10% change in Interest expense.
This hypothetical small business carries a sizable amount of LT Debt. Still, Interest expense is still a relatively immaterial expense. Thus, the effect of a change in LT Debt and Interest rates is only ±1.4% on Net profit.
Click to enlarge
Going forward with a new Degree of financial leverage
Because of the nature of the Degree of financial leverage calculation (Operating profit ÷ [Operating profit – Interest expense]), when Operating profit increases, the Degree of financial leverage decreases – all other things being equal. The opposite is, of course, true too.
What does this mean?
It means that if your small business increases Operating profit this year, then your Degree of financial leverage is going to go down for next year. Which isn’t catastrophic. But, it means that a similar gain in Operating profit next year won’t translate into the same boost in Net profit.
To get that, your small business would have to borrow more funds.
On the same token, if your company has a decrease in Operating profit this year, then your Degree of financial leverage will increase for next year. This increase will amplify the effects of a gain in Operating profit next year. But, it doesn’t necessarily mean that you’ll end up ahead of where you would have been if you would have increased Operating profit in year 1.
Shortcomings of the Degree of financial leverage ratio
Again, the Degree of financial leverage ratio is calculated as follows:
Big companies typically borrow money through the issuance of bonds. This means that they only pay interest until the bond matures.
Small businesses, like yours, don’t issue bonds. The nature of borrowing can vary, but often, loans are repaid on an installment basis. E.g. payments consist of both principal and interest.
So, a ratio that only measures the effects of Interest expense doesn’t completely capture the impact of financial leverage. For small businesses anyways.
Two extreme examples
First, consider a small business that borrowed 10x their previous year’s revenue. If they did so at a very low interest rate, their Degree of financial leverage would also be relatively low. But, having borrowed a disproportionate amount of money, they would theoretically have the opportunity to boost Sales/Operating profit greatly.
Also, consider the other extreme. What if a company borrowed a very modest amount of money? But, was forced to pay an exorbitant interest rate? In this instance, the Degree of financial leverage would be relatively high. But, the company’s opportunity to use this leverage in a beneficial manner is limited.
Finally, in order for the Degree of financial leverage to accurately predict the change in Net profit, Taxes must remain at a constant percentage. E.g. they can’t be 21% of Operating profit – Interest expense (EBT) one year and 22% the next. The Forecasted Change in Net profit won’t equal what’s calculated in the Confirmation.
The amount of LT Debt and the Interest rate/expense must also remain constant for the “Operating profit × Degree of financial leverage = Change in Net profit” equation to work out.
So, obviously, the Degree of financial leverage has limitations. It is designed for big businesses – not necessarily small ones. It is based on amounts in the income statement, and not the cash flow statement. Thus, no consideration is taken for the effects of principal repayment.
If its limitations are kept in mind, and if reasonable changes are forecasted, then it can provide guidance on the potential benefits or detriments of financial leverage.
How financial leverage affects business decisions
Plug your small business’ information into the Your degree of financial leverage worksheet. It will help you better understand how your borrowing might help or hinder you in the coming year.
Financial leverage, in and of itself, is neither good nor bad. It’s all about how it’s employed. If it’s used to buy (rather than sell) consumable assets that provide little or no return – it’s wasted. If it’s allocated to resources that increase productivity (or earn extraordinary returns) – it’s a valuable tool for small businesses.
What are your thoughts on the use of financial leverage?
What are some of the advantages and disadvantages I neglected to include?
How about some ways that you’ve effectively employed financial leverage in your small business?
(to balance weaknesses, capitalize on opportunities, and neutralize threats)
(shore up to “good enough”)
1) Long-term membership
1) Shortage of handicap facilities
2) A good reputation
2) Volunteers worked too hard
3) Rich & lengthy history
3) Uninviting
Possible opportunities
Possible threats
(exploit as much as possible)
(limit downside as much as possible)
1) Located near a university
1) Small town & aging population
2) Influence in other organizations
2) Competition for new members
3) Internet & social media
3) Economic hardship in community
A SWOT analysis should paint a picture of the environment your church operates in.
The members of your church are a great resource for ideas about what your strengths and weaknesses are.
Examining where your strengths, weaknesses, opportunities, and threats intersect will help your church understand what goals should be set as strategic planning progresses.
If you’re not familiar, SWOT stands for strengths, weaknesses, opportunities, and threats. A church SWOT analysis is an examination of the environment the church operates in. The internal environment is represented by strengths and weaknesses. The external environment by the opportunities and threats.
Strengths and weaknesses are things within your church’s control
In order to control them, though, you’ll have to be brutally honest with yourselves when listing them. Don’t include things you wish you did well or should be doing well. Don’t gloss over weaknesses because you’re embarrassed by them or because they are something you should be better at. We all have things that we are among the best at, and we all have things that hold us back. Creating a sound strategy for your church requires that you capitalize on your strengths and don’t ignore the “elephant in the room” when it comes to your weaknesses.
Opportunities and threats are outside of your control
They’re the hand you’ve been dealt and are forced to play. There is probably less of a temptation to fib with these external factors than with the internal ones. However, keep yourself and the other decision-makers honest when listing opportunities and threats. Don’t let political correctness, stubbornness, or any other sort of artificial block keep you from being completely objective in this process. Also, be thorough in your analysis. Sometimes opportunities and threats lurk below the surface. They aren’t easily seen with a passing glance. You’ve got to focus a bit harder to see what’s really there. It’s really quite simple: an opportunity is anything external that could help your church and a threat is anything external that might harm it.
If you’re honest with yourself, you’ll have a very accurate picture of the reality you operate in. It might make you a bit uncomfortable but you’ll be equipped to actually make improvements and protect what you already have.
You started brainstorming when you came up with a church mission statement, time to do some more. Gather the other leaders in your church and start jotting down ideas.
What if you find yourself in an awkward position where another one of the leaders in the church is a weakness? Mentioning this might rustle jimmies and bring the whole strategic planning process to a halt. How to proceed then?
Use your best judgment. That’s a vague answer, I know, and I’m sorry. If the buck stops with you, then you’re, fortunately, in a position to address this weakness. If not, then you’re just going to have to use whatever means you have at your disposal. That may mean that you can actually correct this weakness. Or, it may not. If not, you’ll have to consider if you can work around it. If you can’t work around it, then you may have to consider separating yourself from it.
That’s not written to be melodramatic. It’s written to remind you that you always have options.
Start consuming information
Understand your opportunities and threats as best you can. Get on the internet. Communicate with your peers. Do your scuttlebutt. Don’t rely on assumptions if you can help it. Get the whole picture.
Time to start narrowing things down
At this point, you should have a big ol’ mess on your hands. Consolidate similar ideas.
Disregard the lesser strengths, weaknesses, opportunities, and threats. We want to focus on the major factors here.
If you’re not familiar with the Pareto Principle read about it here. The “law of the vital few,” as it’s called, states that (typically) 80% of the effects are caused by 20% of the causes. What’s that mean for your church in general and your SWOT analysis specifically? It means that we want to simplify things and narrow our focus to the strengths, weaknesses, opportunities, and threats that will have a big impact. A big long list of SWOT factors is overwhelming. You won’t even know what to do with it.
So, how many of each should you list? Here comes another vague answer (apologies again). There is no hard and fast rule. If it seems like too much, then narrow it down. If you feel like something critical is missing, then add something back. The strategic planning process should be reviewed every year. So, if something is on the fence, leave it off the list. Simplify. Address the more pressing factors and consider adding it next year.
The last step of the church SWOT analysis
Try to understand how these factors can interact with each other. For instance, how will your strengths and weaknesses interact with your opportunities and threats?
If your church has strengths that are on the same wavelength as your opportunities then you have what is referred to as “low hanging fruit.” If you’re not already taking advantage of these situations, then you need to right now. Strengths are usually long-term, but opportunities can be fleeting.
Where strengths match up with threats, you know that you have a margin of safety. As long as the strengths aren’t stifled, you should maintain your protection.
What about opportunities you can’t take advantage of due to weaknesses? This is a problem. You’ll have to think about how you can shore up these weaknesses. Can you hire someone? Is there someone from the congregation that is willing able to contribute their strengths? Can you partner with someone? As I said, opportunities are fleeting. Don’t let them slip through your hands if you can help it.
Finally, where weaknesses and threats meet up – you need to assess how much risk you’re taking. Again, can you shore up these weaknesses? If not, can the threat be neutralized by some other means? This can be a scary exercise. Ignoring this reality won’t help anyone, however.
As you probably gathered, the point of this exercise is to understand your environment so that you can limit your downside and take advantage of the upside as much as possible. If your downside is limited, then there is only upside left.
Information to gather before preparing your church SWOT analysis
It might help to gather some information before starting the steps necessary to prepare a SWOT analysis for your church. This list is not by any means all-inclusive. Hopefully, though, it will give you an idea of where to start.
Traffic count
I’ve found that several major metropolitan areas keep traffic count data. What’s traffic count? It’s exactly what it sounds like. The Department of Transportation (or some similar entity) counts the number of vehicles, on average, that use a particular stretch of road over a predetermined period of time. I’ve found that usually, the counts are displayed in the number of vehicles per day.
What to do with this data? Determine your visibility – your exposure to passers-by. If you get heavy traffic in front of your church, then make sure you’re marketing to all those eyeballs. Put up a billboard, get a marquee, or otherwise ensure that those people know who you are and what you have to offer.
Church attendance tracking
Even though churches aren’t for-profit businesses, they’ve got to know their data. You’re making uneducated decisions otherwise. If you don’t know what your attendance numbers are, then I really think you should rectify that.
How to track church attendance? Software exists to help you with this. To be completely forthcoming – I’ve never used any of this software and I can’t speak to its value. Every piece of software has its shortcomings, but it probably beats tracking it by hand.
This might seem a little intrusive – and it is. There’s no way around it. So, I would suggest limiting the frequency of this step to once every couple of years. A church census is exactly what it sounds like. It’s the gathering of demographic data about the members of your church.
What should you include on a church census?
Obviously, you don’t want to get too personal. For one, it’s not necessary. For two, it’s intrusive to the people you’re trying to help. So stick to the essentials.
You’ll probably want to know the age of your members. Knowing their professions would also be beneficial. Since families will likely fill out a census form together, you’ll be able to piece together who’s married to who and who is somebody’s child. This is a good chance to gather contact information too. You don’t want to abuse that, but it’s very valuable information to have. Think about what you’d really like to know about your members and limit the questions to that information. Maybe slip in an option for those who want to volunteer and would like to be contacted.
What’s an example church census look like? Here’s an example I found online. Use it as inspiration, but make it your own. The more authentic and less pushy your form is, the better your response rate will be.
How do I get members to fill out a church census?
You’ll have to decide what works best for your church. My opinion is that you want to be just the right amount of pushy. Keep gently reminding members that you’d like their participation. But don’t be obnoxious by any means. Use your good judgment here. Let them know you’d appreciate their participation, but it is not required. A 6 week or so campaign should do it. You don’t want to drag this out.
Keep in mind too that you won’t get 100% participation. 80% would be remarkable, so keep your expectations in check.
What do I do with this information?
If you have dedicated CRM (customer relationship management) database software to handle this information, then great – put it in there. If you don’t that’s fine. Assuming the data isn’t overwhelming, you can use Microsoft Excel or Access. It’s important to get this information in digital form, however. You want the ability to search for this information and be able to filter it so that you can use it to paint a demographic picture of your congregation.
A church survey
Your congregation is your customers. If their needs aren’t being met, they will eventually go somewhere else to get their needs met. Don’t just assume that you know what your members think. Conduct a state-of-the-church survey on a regular basis (annual, semi-annual).
A survey is a great way to confirm the items you brainstormed in your SWOT analysis. Do you think you have great leadership? Okay, what’s the congregation think? Do you think that too few members are volunteering? Ask questions that can help you uncover why. You get the point.
If the results of your survey run contradictory to what you thought you knew about your church, then you had better reconcile why there’s a difference. Making decisions that run contrary to your members’ perceptions is risky. So, don’t be so sure you’re right. Just ask.
Make sure the questions in your survey are pertinent. Don’t ask trivial questions. You want to keep the number of questions reasonable; say 10-15. We’ve all taken surveys that seemed to go on forever. They’re annoying. Keep it short and keep it limited to the things you have to know.
Like I said, your SWOT analysis is a great place to start for survey question ideas. Google “church survey” and you’ll find plenty of other examples if you’re stuck. Here are some great ideas to get you started.
How to distribute the census and surveys
If you want paper copies – before and after service is a great time to ask for feedback. People are already in a church mindset, so the timing is perfect. Just make sure it’s not pushy and that nobody will feel singled out if they opt not to participate.
If you have members’ addresses, you can mail out the survey. Keep in mind that doing so will incur additional costs.
Gathering digital responses will be more efficient. It’s up to you to decide what’s appropriate for your congregation. Do whatever gets you the highest response. Here’s a good post on choosing the right digital survey platform. Just remember – if you collect your members’ information digitally, you have a duty to protect that information. Make sure the platform you use is secure, and make sure you have policies in place to ensure that their valuable personal information isn’t compromised.
Good, old-fashioned, talking
Another good way to get your finger on the pulse of your environment is to simply ask the opinion of people you respect.
Ask your family what your strengths and weaknesses are. Ask your professional network what opportunities and threats exist. Let them know that you are genuinely interested in improving and you appreciate their candor. Listen to what they have to say.
Whether it’s flattering or hard to hear, it’s valuable. So let them say their piece and don’t take anything they say personally.
Ideas to get you thinking
If this is your first time taking part in a church SWOT analysis, then you might not know where to begin. Here are some ideas on potential strengths, weaknesses, opportunities, and threats for your church. This list is by no means exhaustive, it’s merely meant to help get your mind on track.
Possible strengths
Your church is on a high-traffic road
Your church’s membership is stable or growing
Most of your members have been with the church for a long time
A pool of retired members with skills that could help the church
Your church is welcoming to newcomers
Your church has a good reputation in the community
A strong source of donations
Great leadership
A self-sufficient attitude
A rich and lengthy history
A sense of family
Church members who speak the same language as locals in the community
A quality mission statement
The capacity to accept a lot of new members
Possible weaknesses
Church membership is declining
The church has low attendance from children and young people
A “welcoming process” for new members that is lacking
A congregation that is inflexible and stubborn to change
Low turnout at community outreach events
Your church doesn’t do a good enough job of “inviting” people in
Members that aren’t getting value from church
A reluctance to challenge the status quo
Volunteers that are worked too hard
Antiquated technology
A shortage of handicap facilities
Lack of a strategic plan
The inability to budget effectively
Possible opportunities
The population of your geographic area is growing
Local youths who are in need of church services
Your church is near a college
Members with influence in other organizations throughout the community
Offering services at different times than Sunday morning
The internet and social media
Hosting community events in otherwise unused facilities
Possible threats
Your church is in a smaller town that has an older population
Laws and regulations that inhibit actions
Competition for new members
An anti-religious culture/environment
Economic hardship in the community
How the factors might interact in your church SWOT analysis
Keep these in mind as strategic planning progresses. Especially when it comes time to formulate a strategy in general and set goals in particular.
Obviously, your church’s SWOT factors are going to be different, and therefore the interactions between factors are going to be different. The examples below simply serve to help illustrate how the separate factors can interact and generate ideas about steps that can be taken to help your church reach its goals. To get the gears turning in your head, so to speak…
Strengths & Opportunities
This is where the stars align. We’re matching what your church does well with external factors that can help it achieve its goals. We don’t let these sorts of opportunities slip through our fingers.
Your church is on a high-traffic road + The population of your geographic area is growing = Ensure your signage is effective
Your building and your signage is the bridge between your church and everybody who passes by on foot or in a vehicle.
Just because your organization is a church, it doesn’t mean that you get a pass on marketing. Marketing is just as important for churches as it is for businesses and for individuals. We all have to be mindful of the image we are projecting out into the world. If we want attention, we’re probably going to have to grab it.
Here are some tips on how to make your signage effective. Beyond that, make sure your building and your grounds are well kept. Real estate that is run-down conveys a very negative image. Also, consider taking advantage of a marquee to attract attention and pass along messages that you think will resonate with the general public
Your church is welcoming to newcomers + Hosting community events in otherwise unused facilities = Offer church facilities at a reduced price to members
Many churches offer the use of their facilities to members for very reasonable prices. What I am suggesting is that your church uses these facilities as a marketing (there’s that word again) tool.
Don’t just take the stance that “the facilities are there for people if they want to use them.” Look at your facilities as an opportunity to get non-members in your church and to show them why you’re so great.
What you don’t want is for people to say “My nephew had his graduation party at some church on the East side of town.” Rather “My nephew had his graduation party at the East Side Church of Christ and man, what a great venue. I can see why my sister and brother-in-law like going there so much.”
Make sure that non-members can find out what your church is about when attending functions in your facilities. Have information available for anyone that might want to learn more. Let all who attend know about upcoming events and opportunities, e.g. singles events, volunteering, kids’ activities.
Make sure that your reputation as a welcoming church is obvious to all who attend. The more people you win over in informal circumstances like these, the more you’re probably going to win over during services.
So look at the calendar for your available facilities. Is it full? If so, great. Make sure you’re putting your church’s best foot forward during these events so that you can attract the types of members you want. If your calendar isn’t full, ask yourself why. Is your Building Use Policy too restrictive? Are the cost and the hassle too high? Do members even know that these spaces are available to rent?
Nobody likes to be faced with threats. But, they are part of life. By utilizing the things you do well to neutralize threats you can lessen their impact.
A pool of retired members with skills that could help the church + Economic hardship in the community = Classes, and workshops to help community members earn more and spend less
Match members of your congregation with those in the community who might be able to benefit from their expertise. For instance, retired members who have years of experience in financial matters such as budgeting, self-employment, taxes, and investing could be a lifesaver for those who are experiencing economic hardship.
Offering classes like these reinforce your good reputation in the community. It gives you the opportunity to really help people and it helps them to become self-sufficient. It gets people into your church and gives you the opportunity to show them the benefits of being a member.
Someday these people will likely bounce back from tough times. Many will remember who was there for them in those tough times. Using volunteer time and expertise to help others is a big part of church life. Not every contribution needs to be in the form of money or food. The gift of knowledge might be the most valuable thing your church has to offer.
The capacity to accept a lot of new members + Competition for new members = The chance for your church to set itself apart
Everybody in the world might want to come to your church, but if you don’t have room for them – they won’t. As will be addressed in a later post, you have to have the capacity to handle your peak demand, not just your average demand.
Obviously, overbuilding can create its own set of problems, but if you have more church than members now, you might have a competitive advantage. While other churches are clamoring for new members without anywhere to put them – your church will seem comfortable by comparison.
Think about it this way – would you rather try to pile into a compact car with five other people? Or, would you rather share a ride with one other person in a large SUV?
Weaknesses & Opportunities
Opportunities are typically fleeting. Not being able to take advantage of them is a tragedy. If your weaknesses are preventing you from taking advantage of opportunities, then shoring up those weaknesses is a must.
The church has low attendance from children and young people + Local youths who are in need of church services = Local youths attending church somewhere else
Youngsters are a different breed. You and I both were when we were young. If you want attendance from the youngsters then you’ve got to incentivize them to come. You’ve got to meet them where they are.
Admittedly, some of the things I was into as a kid had no place at church. But, don’t think that you can’t reach them at all. I’ve worked at after-prom parties for my daughters’ school that was relatively vice-free and the kids seemed to have a very good time.
The particulars of planning activities for young people are outside of my expertise. A church is an organization that is supposed to appeal to every demographic, including pre-teens, teens, and young adults.
I can’t envision any benefit to excluding these groups. So, if your church is losing the young crowd to other churches, then I believe you should consider steps to rectify the situation. Here’s a pretty good article I found on the subject.
Members that aren’t getting value from church + The internet and social media = The ability to provide extra value to members and nonmembers
If an individual’s experience with church consists strictly of going to service on Sunday and being subjected to the same thing they have one million Sundays before, the experience is going to get a bit stale.
Take advantage of technology and get the most you can out of social media. Share inspirational material that expands upon what you preached at church. If you add value to people’s lives, they’re going to become more engaged.
I’ll hazard to guess that a lot of your congregation is addicted to social media. Sorry to say it, but it’s probably true. From my experience, social media has its benefits, but it can also be a cesspool of negativity. Be a diamond in the social media dump.
Here’s the trick, though. Be authentic. Don’t just say what you think people want to (or should) hear. Have a real human being handle your social media. Authenticism will attract more people than tired old talking points.
When a threat is on the horizon and you have no answer for it, you’re in trouble. You’re not alone though. Every individual and every organization has weaknesses. Everybody is exposed, to a greater or lesser degree, to threats. The key is to protect your downside.
A reluctance to challenge the status quo + An anti-religious culture/environment = Time to come to terms with reality
It’s my opinion that many people in America and other first-world nations have opted to forego the worship of God in favor of the worship of government and scientists. In a lot of ways the Church has no one to blame but themselves.
It wasn’t that long ago that people would lament being preached at by the fanatically religious Christians. Now, ironically, the ones I see telling me what to think and say are those who are fanatically “progressive.” I’m getting out of my lane here – this is a site about solving business (profit and non-profit) problems. Not a soapbox.
Anyhow, it seems to me that the pendulum has swung in the other direction. I’m not saying to change your beliefs. But, if you want to win people over, you’ve got to meet them where they are. Highlight the good the church is doing. There’s a lot, I know. Don’t just read Bible verses to people – I don’t think it will resonate. Expand on what the Bible says. Apply to real, everyday life in 2018.
Those in your church that want to stick with the “way it’s always been done” might be holding you back. There’s a lot of value in religion, but you might have to employ a little more subtleness when conveying that value.
Here’s a trick I credit to Aubrey Malphurs, Church Consultant – if you find yourself faced with a stubborn (possibly older) member, ask them what they’d be willing to change to have their (grand) children seated next to them at church. When framed this way, you might find that they are a little more willing to be flexible.
The inability to budget effectively + Economic hardship in the community = You need to practice what you preach
Your church is going to thrive more in strong economic times than weak ones. That’s obvious. However, handling your church’s finances in a responsible manner is a necessity no matter the economy. Seeing a place of worship crumble in poor economic times is only going to make those who are losing hope become more despondent.
The beauty of numbers in general and finance, in particular, is their inescapable reality. Short of committing fraud, you can’t make things appear or disappear out of thin air. Embrace the reality you’ve been blessed with and make the most of it.
What are some of the hardest strengths, weaknesses, opportunities, and/or threats to come to terms with?
I have found that the hardest barriers to SWOT analyses have centered around honesty, focus and organizational commitment. A church or any organization doing a SWOT needs to provide an honest assessment of strengths and weaknesses. Often people don’t want to hurt anyone’s feelings so everything becomes a strength. If worship isn’t inspiring or if sermons seem repetitive and lifeless, call it out as a weakness. If children’s ministries lag or member participation is lackluster, call it out. A SWOT has no meaning if the organization isn’t honest about its current state of affairs. Sometimes you might have to clarify why it’s a strength or weakness. Is it related to facilities, resource distribution, leadership or church demographics. Looking at strengths and weaknesses simply says what you do well and what you might not do as well as you’d like. It’s information that can help during the planning process.
A second barrier is focus. While it comes into play more with setting objectives, most churches find it difficult to focus. Individual churches do not have to be all things to all people. Yes, we want to be the spiritual home of all those who are around us, but that’s impractical. Individual churches have different strengths and weaknesses that may or may not play into the needs of those in the community. Churches also have limited resources, so focus allows us to play to our strengths, make changes where we need to, and use our resources more effectively.
Organizational commitment is essential if the church is going to make the plan work. Having a core of dedicated people is great, but unless the church as a whole gets behind the planning committee’s work, you may create a great plan that sits on the shelf. Be sure to build in opportunities for people to contribute to the plan in order to build internal support for the process.
One last thing, planning is a process; it doesn’t stop with a document. A plan should be dynamic and change as circumstances change. This shouldn’t be a once-a-decade “cookie-cutter” exercise. There isn’t one solution to the ills of a church; there are many, but, often, people limit the opportunities they are willing to consider. We get calls from people who ask how they can resurrect their youth programs and attract families with children. Sometimes the likelihood of revitalizing a church with no children is extremely limited making it impractical to expect in a short time frame. In cases like that, sometimes the best path is the one least traveled – being led to focus on something involving other underserved individuals that fit in your “wheelhouse”.
Do you have any other sources of information you would suggest being gathered before preparing a SWOT analysis?
Demographic information is available through your annual conference office. If they are unable to support you, contact the Local Church Services team at United Methodist Communications, localchurchservices@umcom.org. I would recommend working with your annual conference if possible because they may have other resources and support available beyond demographic data. If your church’s internal information is difficult to access, visit www.umdata.org. The site has information based on what your church has submitted to GCFA through 2017. United Methodist Communications also offers a local church assessment survey. Contact umcomresearch@umcom.org for information.
Wrapping up the church SWOT analysis
Holy cow, that’s a lot of info. I write a lot of info because there is a lot to think about (it is a “comprehensive” guide, after all). If your church is new to strategic planning or SWOT analyses, your head might be spinning.
Maybe you’re thinking “this is too much trouble.” Like I said in the church mission statement post – you don’t have to follow this guide “to a T.” There are lots of other great sources of information out there. If something suits you better, use it.
There’s really no downside to going through this thought exercise. Even if you can’t get anyone else in the church to buy in. It’s hard to imagine that you would be worse off afterward if you did follow these steps.
Don’t expect perfection. Especially the first time you draft a church SWOT analysis. You’ll make mistakes and you’ll learn from them. Next year – you’ll improve, as will you the year after that…
Whatever you do, just make sure that you feel good about the direction your church is heading.
What are some of the hardest strengths, weaknesses, opportunities, and/or threats to come to terms with?
How about some good resources (available to everyone) for understanding opportunities and threats?
Do you have any other sources of information you would suggest being gathered before preparing a SWOT analysis?