Competing on Price? There’s a Better Way: Value Pricing

value pricing treasure featured

common excel questions

Do you know everything you need to about pricing? Read this:

5 PRICING STRATEGIES: GAIN MARKET SHARE FOR YOUR SMALL BIZ

You’d like to be able to charge more for your small business’s products or services. However, you feel pressure to sell for near or below what your competitors do. Otherwise, your customers will go elsewhere, right?

“What Are Features vs Benefits of a Product?” The Difference

However, every dollar more that you can charge is (likely) an extra dollar in profit. Bringing in more revenue would help your small business with cash flow and would contribute to achieving your goals. You know that better pricing strategies exist, but maybe you’re not sure how to implement them?

Is every business forced to compete on price? Everybody knows that, to a greater or lesser degree, you get what you pay for. Most people, at some point, have “spent a little extra” but felt like they got their money’s worth.

Do you know everything that compels your customers to buy, besides price? Unless you’re selling highly commoditized products, I’d say it’s unlikely that price is the only purchasing decision.

Why not sell your products and services at a bare minimum, then? Only make enough profit to stay in business – assuming that nothing unexpected happens. Customers are the only side of the transaction that matters after all…

How do your (potential) customers make buying decisions – have you asked them? Think about this, along with what it is that you do better than anyone else. The better you understand variables, beyond price, the better position you’ll be in to maximize your small business’s revenue and potential.

What would really happen if you raised your prices? Sure, it’s probable that some customers would leave. I’m betting it wouldn’t be your best customers. In fact, for a lot of small businesses, I’d hazard to guess that earning more revenue from “good” customers and having less hassle from the “bad” customers would be a very welcome development.

Simple Small Business Cash Flow Template, 7 Week Projection

About value-based pricing

Understanding how much your customer thinks a product is worth is important. That’s why companies try to price their products with what the customer values in mind. This type of pricing is customer-focused. Companies that employ this strategy have to make sure they are meeting customer needs.

Value-based pricing is an approach to pricing products and services that focuses on the value provided to the customer rather than the time or cost incurred by the provider.

Value pricing can be contrasted with cost-based pricing. Cost-based pricing focuses exclusively on the costs incurred to bring a product or service to market.

Since the perceived benefits from a product or service can far exceed the cost it took to create it, the potential for a small business to earn extraordinary returns is very high.

How to convey value to customers?

It is important to know the value of your products and services. If people don’t think they are getting their money’s worth, then you have no power to raise the price. But if people believe they are getting their money’s worth, then they will stay with you even if you raise prices.

“How Do I Write a Marketing Business Plan?” Breaking It Down

Small businesses need to be careful with value pricing, however. If you overestimate how much the customer values the product or service then, it’s possible, that sales will suffer. It’s rare that customers will willingly overpay for something.

Emotion plays an important part in value-based pricing. It’s emotion that drives the desire to purchase a product or a service. 

Whereas value can determine price, price can also convey value to the customer. Counterintuitively, not having a relatively high price can communicate a lack of quality to customers. Even if that’s not necessarily the case.

By its very definition, we know that the more value a small business can create for customers the more it can charge. So, how to create and convey all of the value you’re providing?

Be authentic and transparent

Deliver on what you promised to customers. Both explicitly and implicitly.

Customers are customers, not employees. So, don’t expect them to spend additional time and money handling things that should have been handled by you. Make doing business with your company easy, not a chore.

Draw a distinction between you and your competitors

Your customers aren’t stupid. They know that they could spend their money elsewhere. So, there’s no point in pretending that you don’t have competitors.

Highlight where you’re strong and they’re weak. Where the opposite is true – try to shore those weaknesses up.

Frustrated With Your SWOT Analysis? 15 Templates To Download

Customize as much as possible

Every customer is unique. Even those within the same market segments.

Not every business model is built for customization. However, try to look for ways to get closer to giving your customer exactly what they want.

Follow up (gently)

If practical, follow up to make sure the customer is satisfied with their purchase. Most times, they should be. If they’re not, this is a good opportunity for feedback.

Get testimonials

Customers believe other customers. Frankly, more than they believe you. Reviews and testimonials provide valuable social proof that provides very real justifications for raising your prices and increasing your profit.

Make giving testimonials and positive reviews easy. Provide an incentive if you can.

Calculating a value-based price

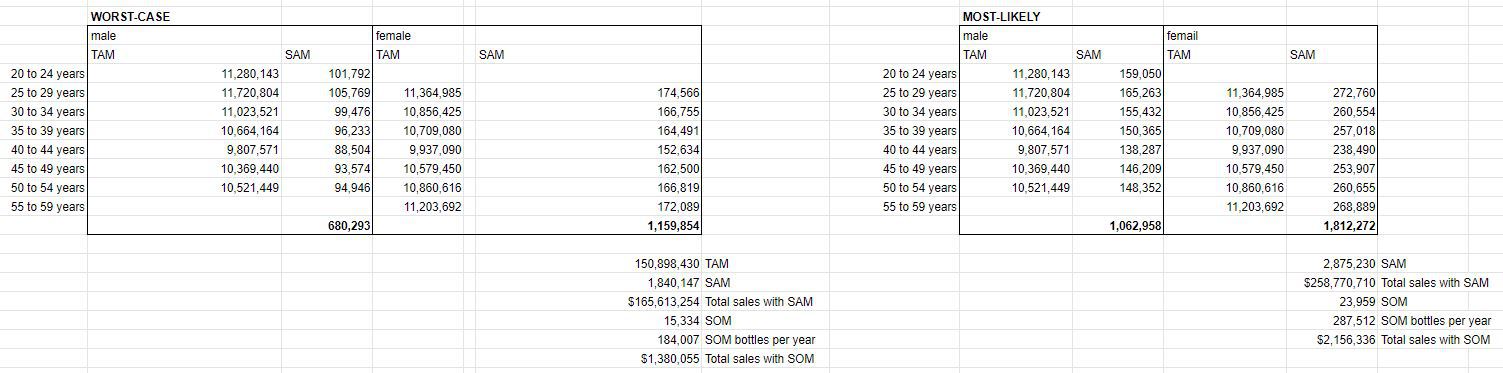
Value-based pricing is a way to set a price. You start by figuring out what your product is worth, or how much someone might pay for it. This can be confusing because some people think that they should charge as little as possible.

Data about customers and their purchasing patterns can help drive value pricing decisions. Analyzing this data can help you decide what your customers value. CRM software can help with this.

The problem is – nobody is really average and every individual values different things. It’s not advisable or even practical to charge each individual a different price based on what they value.

What Is a Sales Strategy Example for a Business Plan? 6 Tips

Here is how one marketer suggested that you set value-based prices:

  1. Think about what your customer would spend that money on if they didn’t buy your product or service
    1. Find out the price of that alternative
  2. Consider the ways your product or service is better (more valuable)
    1. Settle on a monetary value for those differences
  3. Consider how the alternative is better
    1. Settle on a monetary value for those differences
  4. Price of the alternative + value of your superiority – value of their superiority

Source.

Keep in mind that this will likely only work with products or services that are direct substitutes.

Advertising Digitally: Novice Guide for Small Business

Advantages of value-based pricing

  1. Save time
  2. Increase profit margins
  3. Simplicity
  4. A focus on quality

Marketing your product or service with value in mind is a great place to start. It actually puts you into the mind of your customer. This helps ensure that you are giving them what they want.

Save time with value pricing

Most businesses are trying to get as many eyeballs on their products and services as possible. Since value pricing forces you to get into the mind of your customers, you’ll better define your customer segments. More importantly, you’ll not waste time on those customer segments that aren’t interested in your small business’s products and services.

Business Plan Demand Analysis, Four Things to Consider

Higher profit margins

Not every small business has a good grasp on its costs. This makes discounting dangerous. If you haven’t allocated all your costs in a meaningful manner, you could be losing money on sales.

Alternatively, by focusing on value pricing, your presumably getting the most revenue possible out of every sale. You still need to know your costs. However, your likelihood of maximizing profit is much higher versus an alternative strategy.

Activity-Based Costing vs Traditional – Steps & Example

Simplicity

Not every small business owner is a math or accounting wiz. That’s absolutely fine unless you are selling math or accounting services.

Once you get a feel for value pricing, you might find it simpler than, say, a cost-plus method. You might find it more intuitive. 

Promoting quality instead of quantity

Value-based pricing isn’t just about selling more products or services, it’s also about selling better products with higher quality standards.

Value pricing makes you focus on what you are providing your customers. So, you have quality on your mind. Contrast this with a discounted pricing strategy where you’re starting from a point of cutting costs (and likely quality). Even if prices are higher, your customers might appreciate a focus on quality.

Disadvantages of value-based pricing

  1. Different markets might have different values
  2. Subjectivity
  3. Time-consuming

Every decision has upsides and downsides. There are disadvantages to value-based pricing that you should consider when deciding if it is suitable for your small business. 

Different markets, different prices?

One of the most notable disadvantages of value-based pricing is that different niches will have different values. Having niche markets for customer loyalty purposes is good. But, it may also mean that certain niches may get over or underpriced. That, or you have to charge different prices to different markets. Which, can get tricky.

Challenging to set the prices

This might seem to contradict the “simplicity” advantage. But, it all depends on where your strength lies.

If you’re a more quantitative-minded small business owner, then a cost-plus pricing strategy could come more naturally to you. The nuance of a value pricing strategy might elude you.

Time and effort

If value pricing proves to be challenging to you, it could take an inordinate amount of time. Time that could be spent on other aspects of your business. Generally speaking, given the importance of pricing, even if it is time-consuming, it is most likely time well spent.

Benefits probably outweigh costs

Competing on price is a losing battle. There are only so many costs that can be cut. Plus, low margins put your small business at risk of cash flow issues and impede growth.

A little thought and a little research will help to uncover what it is that your customers value. Highlighting the value you are giving your customers will reassure them that what they spent was worth it.

Anecdotally, I’ve never seen a story where a business was regretful for raising prices. Granted, this could be an issue of survivorship. But, I think, generally speaking, raising prices (and conveying value) offers a bigger upside for your small business than downside.

FREE 2 Page Auto Repair Shop Marketing and Sales Business Plan

marketing sales busines plan example featured

common excel questions
COPY COUPON CODE HERE: DFE25KLPMN768ZB5

The marketing and sales section of your business plan is where you explain your strategy for bringing in sales. It is critical because making sales is paramount for business success.

The following example draws heavily from the previous two posts on the subject.

In this example, I’m using a fictional startup auto repair and maintenance shop we’ll call Auto Repair, Inc.

Feel free to copy this example and tweak it for your needs.


Marketing strategy

Auto Repair, Inc.’s (ARI) marketing strategy aims to earn a high return on investment (ROI) on marketing efforts. The marketing strategy is rooted in the marketing theme.

The goal is to carefully consider and continuously review the marketing strategy – making adjustments where necessary. Whatever strategies are implemented, adherence will be enforced.

Target market

As described in more detail in the market analysis section, ARI’s target market can be summarized as follows:

  • Households in the same or bordering ZIP Codes as the service facility
  • Male
  • Age 21 years and over
  • At least 1 vehicle available to the household
  • Household income ranging from $40,000 to $199,999 per year

Marketing theme

ARI’s marketing will adhere to a consistent message highlighting the benefits of using their auto repair services and their unique selling proposition (USP).

ARI will hold itself to the highest standards of honesty and integrity. The benefit to the customer will be knowing that they aren’t being deceived and not being charged for unnecessary repairs. The intent is to make ARI the first choice for automobile maintenance and repairs in the local market.

Furthermore, by paying for the expedited shipping of parts that aren’t in inventory, ARI will be able to offer its customers timely service. The benefit of expedited shipping is that customers won’t be inconvenienced for any longer than necessary.

It is these two things – honesty, and timeliness, that comprise ARI’s USP. This is what ARI will strive to be known for. It is what will make them unique among their competitors.

Promotional strategy

It is ARI’s intent to focus on three promotional strategies at any given time. The ROI for these promotional strategies will be measured to the extent possible.

Flexibility will be a priority. The promotional strategy that is performing worst will be replaced or adjusted upon quarterly review. This strategy should result in a continually increasing marketing ROI.

All promotional efforts will emphasize the previously mentioned marketing theme.

The following are the initial strategies ARI intends to employ:

Sponsoring local community events

ARI will focus on community events in the local metropolitan area that pertain to automobiles. These events will be sponsored, if possible. A presence will also be maintained at these events where coupons and promotional materials will be handed out.

Social media

ARI will maintain a strong social media presence. In order to increase the likelihood of effectiveness, ARI will outsource this activity to a local marketing firm. Additionally, ARI will employ the use of exclusive codes in social media promotions which will aid in tracking the scope and scale of social media efforts.

Referral program

ARI will implement a referral program that will strongly incentivize current customers to refer new customers. Under this referral program, if new customers state that they were referred by an existing customer, the existing customer will receive a 50% discount on their next oil change.

Technology

ARI will rely heavily on technology in order to leverage and measure the effectiveness of their promotional strategies.

Social media, as mentioned previously, will play an important part of ARI’s marketing strategy. Initially, social media will serve as one of the primary means of promotion.

Additionally, analytical tools will be relied upon to gauge the effectiveness of ARI’s marketing and sales strategies.

Finally, customer relationship management (CRM) software will be critical to maintaining a reliable database of prospects and existing customers. Plus, it will facilitate the collection of relevant information and aid in the overall marketing and sale strategy.

Pricing strategies

Carefully considered pricing is critically important to ARI’s success. Automobile service and repair is, unfortunately, viewed as a commodity. It is ARI’s intent, through an effective marketing strategy, to differentiate themselves from the competition and lessen the commoditization of their services.

ARI’s initial pricing strategies will be as follows:

Bundle pricing

A detailed analysis will be conducted to determine attractive, yet profitable, discounts that can be provided to customers who purchase two or more services concurrently. These dynamic pricing models will be programmed into the CRM software and applied automatically.

Psychological

Psychological pricing will also be used in promotional materials. Where practical, prices will be adjusted to the nearest $.99.

Sales strategy

ARI’s sales strategy revolves around a flexible, practical, and transparent process that makes all employees continuously aware of the company’s progress towards its sales goals.

Process

All of ARI’s employees will be coached on the sales process which revolves around its marketing theme. The marketing theme emphasizes customer service, honesty, and timely service.

This theme will be highlighted in all customer interactions. Particularly through the use of transparency in discussing repairs. Also, through emphasizing the expected time of maintenance and repairs.

Continuous learning

Training will be conducted quarterly for all employees and on an as-needed basis individually.

During training, the tenants of the marketing and sales strategy will be highlighted. Employees will be given the opportunity to ask questions and discuss scenarios. At this time, there will be an opportunity to address any necessary issues, shortcomings, or changes. All of this is done in an effort to reinforce the strategy, and to be flexible as needed.

Sales goals

At ARI’s quarterly sales training, sales goals for the company as a whole will be stated.

Additionally, the sales goals, and progress towards them, will be made clearly visible to all employees throughout the quarter. Every employee will understand the part they play in contributing to those goals.

Sales goals will be tied to the annual strategic plan, and, more specifically, the operating budget.

Sales goals will revolve around total revenue, and be broken down into monthly, weekly, and daily milestones.

Sales forecasts

Sales forecasts are covered in detail in the financial projections section of the business plan.

How Can Your Business Measure Customer Engagement?

measure customer engagement featured

Generally, there are three things to quantify – how often customers visit, how long they stay, and what actions they take while they’re there. Understanding this information will help your business maximize its investment in marketing.

In order to sell to customers, you have got to get them to engage with your small business. In order to sell to a lot of customers, you need them to engage with you heavily.

Therefore, it’s worth thinking carefully about measuring customer engagement. Customer engagement can happen in person, on a website, on social media, or over the phone.

Defining customer engagement is tricky. You’re likely to get 10 different definitions from 10 different people. Personally, I like to think of customer engagement as a reflection of how passionate your customers feel about your business.

If you’re going to make big efforts in the customer engagement arena – you had better make sure you’re measuring the results of those efforts. After all, you can’t improve something you’re not measuring. Fortunately, there are many metrics that you can track to see if your efforts are bearing fruit.

These metrics fall into three broad categories:

  • How often your customers engage?
  • How long your customers engage?
  • What actions are they taking when they engage?

What is meant by customer engagement?

Customer engagement is a term used to describe the active involvement of a consumer in a company’s product or service offering.

It’s about creating an ongoing dialogue with customers, and it takes many forms:

  • Customers who feel that they can influence a product or service offering (such as government services).
  • Customers who are encouraged to provide feedback on products/services (and whose feedback is acted upon).
  • Customers having ownership over their experience. This could be through buying shares in the business or other methods where customers become owners.

Here are a few examples:

Part of the Solution

People will always complain about customer service. However, if you look around, there are ample examples of brands making consumers part of the solution. This happened in a big way in the airline industry after 9/11. Airlines needed to improve service or face losing customers.

In many cases, they brought in the consumers by holding town hall meetings as part of the solution. Customers aired their grievances and were rewarded for constructive criticism with better service.

Crowdfunding

In other instances, consumers raised money via crowdfunding sites like Kickstarter to fund development projects of products that had not yet hit the market.

It is interesting how companies are trying to get new technologies out there by using Kickstarter so people can test them before buying them. For example, this was used on the Amazon Echo when Kickstarter backers got a special price to buy it.

Marketing Strategy

In other cases, companies have co-opted the customer as part of their marketing strategy, which is a modern twist on word-of-mouth promotion.

For example, a recent campaign by clothing company Patagonia encouraged customers to return their older jackets via a special box they created, with every returned jacket being recycled into new materials for future use.

It’s an attempt to stop ‘fast fashion’ where many clothes are cheaply made and only worn once before being discarded. The campaign essentially told consumers: “you can help us make better products, and we’ll reward you for doing so.”

It’s also interesting how companies rely more on word of mouth or ‘buzz’ where they give discounts to people who talk about their products.

How often are your customers engaging?

One of the biggest mistakes that small businesses make is doing too much (or not enough). There is a good spot in-between and it depends on what type of business you have, how often you offer your service, and who the customer is.

A prospect that visits your business and then disappears is a lost opportunity.

If a prospect visits your business and becomes a customer – that’s valuable, of course.

If that customer keeps coming back – that’s the most valuable of all.

It’s from the repeat customers that you get the most bang for your marketing buck.

If customers keep coming back, you can assume that they feel as though they are getting value from your product or service. The more often they come back, the greater the value. Customers that engage daily are generally worth more than does that do weekly or monthly.

Applications such as Google Analytics will tell you how frequently (potential) customers visit your website. If you sell your products/services in-person or over the phone then gathering customer information might help you to understand customer engagement. Rewards programs might also help here too.

How long are your customers engaging?

Customers who receive high value from your products and services are not only going to visit often but they’ll stay for longer too.

Again, there are many options when it comes to software that measures user frequency and activity time for your website. Activity time is not as easy to measure for a brick-and-mortar business. If most of your customer activity is over the phone, it might be that you have records that can give you some insight. Or, it might be the sort of thing that you can log into your CRM software

In-person, this can only be practically measured through observation. Therefore, the results will be anecdotal. However, if you commit to measuring this information, insights can be gathered. It might be that you need to group customers by demographics when measuring.

What actions are your customers taking?

A company cannot think about every possible customer, product, and context interaction. However, no business should forget to get basic information from customers.

Customers who come often and stay a long time are positive indicators, certainly. But, ultimately you need those customers to take action. The ultimate action you need them to take is to make a purchase.

If your business is online, you can measure what pages customers visit, if they opt into marketing communications, if they abandon their cart, plus a multitude of other things. For a brick-and-mortar business, as usual, it’s not so easy.

A brick-and-mortar business that only deals with customers over the telephone could only really document what the customer said. Speaking is really the only “action” customers can take. For example, what products did they inquire about? What other questions did they have?

For a retail (in-person) business, again, you probably have to group customers by demographics.

I read a book on this subject once. Unfortunately, I can’t remember the title. Anyhow, it was about a guy who built a consulting business by documenting customer actions.

He would go into a retail business and take notes of the actions that the customers typically took in the store. He would also measure the amount of time they were in the store.

Armed with this information, he would then approach the retailer and offer to sell it. The information he gathered would speak volumes about customer actions and habits. Much of the retailers’ responses revolved around repositioning merchandise in the store.

If you’re a retail small business owner, you don’t have to approach this as scientifically as the author of the book did. But, you can do something similar. It’s just a matter of setting aside the manpower. Discreetly watch the actions that customers take in your store and document it. Plug the data into a spreadsheet or some other software where you can interpret it. Then, take the necessary actions.

Below, are some ideas on customer actions that you can measure. Many are similar across all three mediums. Others, with a little tweaking, might be applicable in another medium.

Website/OnlineIn-personPhone
Visiting your websiteVisiting in-personCalling your business
Viewing/clicking an adReferencing an adReferencing an ad
Downloading documentTaking a flyerReturning a call
Opening emailAsking for assistanceMaking a purchase
Requesting more informationMaking a purchaseRequesting more information
Viewing webinarAccepting assistanceCompleting a survey
Visiting online storeJoining rewards programAccepting solicitation
Making a purchaseApplying for financing
Contacting live chat
Referring customers
Completing a survey
Leaving a product review
Rating a product/service
Reordering a product

Challenges to measuring customer engagement

Marketers measure customer engagement by email, social media, website traffic, and purchases. But they often forget to include service metrics.

As you might have gathered from the previous sections, measuring customer engagement isn’t always simple.

Sometimes, collecting data is logistically difficult. Such as documenting what actions your customers are taking. Other times the information is hard to quantify and interpreting actions can be very subjective.

Ultimately, you want to measure customer engagement to understand how it will affect your revenue and net income. But, making the connection between actions and revenue can be difficult. Don’t lose sight of your ultimate goal – which is to build a healthy small business.

What do you do with customer engagement data?

Collecting and analyzing customer data will help your marketing campaigns. It also lets you improve the customer experience, like by giving people better product recommendations, communicating with them more often, or even making sure that they stay loyal to your company.

Once you’ve gone to the effort gathering customer engagement information, what then?

It may be that, in the beginning, you simply want to understand how your customers are engaging with your business. But, there will come a point where you want to act on the measurements you gather.

At which point, you need to be clear on what it is you want to achieve.

Do you want to increase the frequency of customer engagement?

To get more out of your marketing dollars?

Or, do you want customers to take different actions?

You can get even more specific. For instance, do you want to sell more of a particular product/service to a particular customer avatar?

You might find that you need to start using different customer engagement metrics in order to meet your more lofty goals.

What it all means

Measuring customer engagement is important for maximizing your marketing ROI. It’s also closely tied to your conversion funnel – turning leads into customers.

Therefore, even nominal efforts in measuring customer engagement can go a long way toward helping your small business.

An expert’s thoughts on customer engagement

Snigdha Patel, Deputy Manager – Content Marketing at REVE Chat

How would you, personally, define customer engagement?

I would define customer engagement as any interaction that happens between a consumer and the brand across multiple channels during the customer journey. The whole idea of customer engagement is not only selling but also to have continuous engage customers through their lifecycle. Having a solid customer engagement strategy is vital for delivering a conversational experience.

What are some ways brick-and-mortar businesses can track customer engagement?

Some ways the brick-and-mortar businesses can track customer engagement are:

1. Store visits – It includes the number of transactions per month

2. Spend per visit (basket size) – Refers to an average $ size per transaction

3. Product spend – It indicates the revenue by category, upsell, and cross-sell rates

You can set a CSAT survey to track your store experience based on the score by asking ‘how satisfied were you with your most recent experience?’

What should a business do once they’ve gathered customer engagement data?

Once the data is collected the data, businesses can proceed with the following steps:

1. Segment the data based on your target audience and product category to understand how your customers are spending.

2. Identify your value in terms of your product positioning and identify the gaps to align your products to your target audience.

Market Size for a Business Plan – 2 Methods to Gauge It

market size for a business plan featured

In order to estimate how much in sales your startup can hope for, you’re going to have to estimate the market size for your product/service(s). This is critical for your startup because it will give you an idea of your business’ potential. It will also help you plan for capacity-related issues.

2 approaches to estimating the market size for a business plan

I cover this topic more in-depth in a post on market size and growth rate on my sister site, InvestSomeMoney.com.

The context there is focused on investing your money in a publicly-traded company. Though that’s a little different than what we are doing here, the fundamental principles remain the same.

The goal is to determine how many potential customers there are for a business and how much they are willing to spend. In order to do that, we can employ two general methods. These methods are a top-down analysis and a bottom-up approach to understand market size and growth.

One way to think about this is that a bottom-up approach uses multiplication and a top-down analysis uses division to arrive at an estimated market size.

After writing on this subject several times, I’ve come up with another way to think about these methods. I think a bottom-up approach should look internally, at things like unit size and capacity. A top-down analysis should look externally at things like demographics and market research.

Looking at this from these two different perspectives opens the door for further analysis. When you’re done, you should know whether you can expect to be capacity constrained or demand constrained. You’ll also start to flesh out some ideas that will help you further into your business plan.

If you do an analysis with both approaches, you can compare the results. For instance, if your bottom-up approach is higher, you’ll know that you could have excess capacity issues. You need to consider scaling that back or otherwise expanding your product/service offering to drum up additional demand.

Conversely, if your top-down analysis reveals that demand is in excess of capacity, then you are leaving money on the table. Time to start thinking about what you can do to scale up and capture as much of the market as possible.

Let’s start by taking a look at a bottom-up approach to estimating the market size for a business plan.

Bottom-up approach example

On my sister site, InvestSomeMoney.com, I researched three real-life examples of a bottom up market sizing approach. In those examples, you’ll see that they sometimes mix in a little top-down analysis with their bottom-up approach and vice versa. There’s no rule against doing that, but I would rather look at things from two totally different perspectives.

When using a bottom-up approach, try to start with the most simplistic piece of firm information you can get your hands on. Then, start to build on it with other information, or the best guess you can muster.

You can think of a bottom-up approach as one that focuses on how much and how often customers will buy.

This information might be something you have internally. Or, it might be from the information you found by researching online. Start with a single “serving size” of your product/service. Then, think about how often a customer would buy. Work your way up from there.

A bottom-up approach for my business plan

As mentioned in earlier posts about business plans – I’m building one as I write these. My theoretical product is an all-natural topical hair loss treatment.

In the post linked above, I performed something of a top-down analysis of market size for a business plan. I later discovered that I was operating with incomplete information.

There’s still a lot to consider regarding packaging volume and dosage. That will require more thought. But, for the time being, I’m going to estimate the volume of a one month’s supply and the daily dosage to be the same as Rogaine. If that changes as I progress with my business plan, I can easily circle back to this and plug in different numbers.

With Rogaine as my benchmark, I know that a dosage of my product would be 1 mL. The product would be used twice a day. My product would come in 2 oz (60 ml) bottles. Each bottle would be one month’s supply, as I said.

Thinking about capacity

Okay. Now that I have a grasp on the package size – what about blending and packaging? If this idea were to come to fruition, I don’t picture myself blending batches in my bathtub and filling bottles with a ladle and a funnel. I would need access to some sort of industrial equipment.

Fortunately, a quick internet search shows that there is no shortage of contract blenders and packagers out there. Especially for food and supplements. What it costs, remains to be seen. That’s an issue for another time. For now, I just want to get an idea of how much I could manufacture.

This company claims it can blend 1.25 million pounds per workday. We’ll assume, for now, this represents the average contract blender/packager. What does that translate into in terms of 2 oz bottles?

First of all, I wouldn’t need all 26 of their kettles. Only one, tops, especially at startup. So, if we divide the 1.25 million pounds by 26, we get a per kettle capacity of about 48,000 lbs per day.

Pounds are a weight unit of measure (UOM) and ounces are a volume UOM. To make the conversion, we’re going to have to do some more estimating.

Water weighs a little over 8 lbs/gallon. We’ll assume my product has roughly the same density.

8 lbs ÷ 128 oz (per gallon) = .0625 lbs/oz. With each bottle containing 2 oz, we know that it’ll weigh approximately .125 lbs/bottle.

This means that with one of this company’s kettles, I could blend 384,615 bottles worth of product per day. 96.5 million bottles per year. At an approximate sales price of $7.50 per bottle, that translates into nearly $725 million in revenue per year.

Okay, I’ve looked at things from a bottom-up, capacity-focused approach. Let’s now consider a top-down, demographic-focused analysis.

Market Size for a Business Plan capacity

Top-down analysis

Not surprisingly, I also wrote a post on InvestSomeMoney.com with examples of a top-down analysis to determine market size for a business plan. When you read through it, you might notice that some of the examples use Census data (or something similar). They take big chunks of information and start narrowing down their market from there.

Which brings us to three important terms for performing a top-down analysis. These are:

Total addressable market (TAM)
Serviceable available market (SAM)
and
Serviceable obtainable market (SOM)

A SOM is a fraction of the SAM. In turn, a SAM is part of the TAM.

The TAM can be thought of as every potential customer that you can reach geographically. The SAM is what’s left when you niche down a little into the population that is a good fit for your unique selling proposition. Finally, the SOM represents the percentage of the SAM you can realistically expect to take.

It’s unlikely that you will ever capture 100% of the SAM. Even in a specific niche, you can’t be everything to everyone. That’s alright, though. The goal of this exercise is to make realistic estimates so that you have a sound business plan to work from.

When doing a top-down analysis, start with a large population or an overall industry size. From there, narrow down your customer until you arrive at your SOM. It helps to have a “customer avatar” in mind before starting a top-down analysis so you know where to niche down to.

I would suggest you perform a business plan demand analysis first to get a crystal clear picture of what that avatar is. You might think you know it intuitively. But you might be surprised at what you find – like I was!

A top-down analysis for my business plan

I know that not every person in the U.S. (much less the world) is going to want or need an all-natural topical supplement for hair loss. Who might though???

I’ll refer back to my handy-dandy business plan demand analysis (linked above) to see what I can find.

Here, I’m reminded of the ages that men and women first started experiencing hair loss. I’m reminded of the percentage that has sought any sort of treatment. Finally, I’m given an idea of what types of treatment they have tried.

A quick visit to Data.Census.Gov and I find table S0101, which gives me the U.S. population by age and sex. I customize and filter the table real quick. Then, I copy and paste the data I need into my spreadsheet.

Market Size for a Business Plan data census gov

Next step is to narrow these numbers down. I’ll use the “regular” numbers and the pessimistic numbers from sensitivity analysis from my business plan demand workbook.

I want to know the percentage of men who have had hair loss and tried any sort of treatment. Then, I want to go deeper and estimate the number that has found supplements to be effective. I’ll do this for both the most-likely and the worst-case scenarios. On the women’s side, I’ll do, more or less, the same thing.

TAM and SAM

You’ll see that I didn’t use the same age ranges for men and women. I assumed that males would start experiencing hair loss earlier, but would also stop caring about it earlier too.

The age range for males in my TAM was 20 – 54. For females, it was 25 – 59. This translates into a TAM of 151 million people in the U.S.

For the SAM, my worst-case scenario estimated that .9% of the male population in the target age ranges would be part of my market. 1.54% of females in the target age ranges were also assumed to be part of my market. This translated into a worst-case SAM of 1.8 million people.

As for my most-likely SAM, I estimated that 1.41% of males and 2.4% of females in the target age ranges were potential customers. This resulted in a SAM of 2.88 million people. Over a million more potential customers.

SOM

SOM is tricky.

Who’s to say what percentage of the SAM my company could capture? Obviously, it would start at 0% and work its way up from there. Where would it stop though?

It will depend, in part, on the number of companies vying for this niche. As I often do, I will refer to the Pareto principle. The Pareto principle states that 20% of the inputs will be responsible for 80% of the outputs. Put another way, 20% of the companies will have roughly 80% of the market share.

I’ll refer back, again, to my post on business plan demand. In it, I found three direct substitutions for my topical hair loss product. I won’t include Minoxidil (Rogaine) in that group, because of its unnatural chemistry.

Again, without getting too mired in math, I estimate that there are approximately thirty companies in the topical hair loss supplement space. This was a quick and dirty estimate based on the results of an internet search.

Six of those thirty companies probably control 80% of the market. That leaves 4.2% (1 ÷ 24) of the remaining 20% as my short-term SOM. Obviously, if my product were to take off, that amount could grow considerably and could approach the SAM.

What that means as far as the market size is 15K people worst-case and 24K people most-likely. At 12 bottles purchased per year, this translates into 184K and 287.5K bottles per year respectively.

Here’s a look at the spreadsheet breaking that all down:

Market Size for a Business Plan top down
Click to enlarge

Comparing a bottom-up and top-down analysis when determining market size for a business plan

Obviously, a couple hundred thousand bottles (top-down) is a far cry from 96.5 million (bottom-up). So, it would appear I will not be capacity constrained in the near future. In fact, as this startup moves forward, I need to make sure I’m not over-buying capacity. Those huge fixed costs could kill my business before it has a chance to get off the ground.

Speaking of fixed costs, the information from this analysis has given me good data to build my pro forma financials – when that time comes.

Now, at some point in the future, selling my product internationally could be an option. However, in this tiny niche, it is unlikely that I’ll ever need that much capacity for this one product.

Market size for a business plan

What were there factors I didn’t consider (but should have) when estimating my potential market size?

How might you have approached this differently?

Join the conversation on Twitter!

Census Data Market Research at the New Data.Census.Gov

census data market research featured

In an effort to modernize, the Census Bureau recently launched its new portal for census data market research. It is located at Data.Census.Gov. Here, you can find information on a bevy of subjects including population, economics, education, business, and many other topics.

Market research is important to know who your customers are and where they are at. No other free resource (that I know of) has the breadth of information that the Census does. It is your ticket, as a small business owner, to better understanding your customers and your environment.

What is Data.Census.Gov?

This tool is part of the Census website. It has an enormous amount of demographic, economic, and geographic data. If you could use only one source of information in your market research, this might very well be it.

The main portal for accessing Census data used to be the American FactFinder. In July of 2019, the Census began using Data.Census.Gov as its primary means of providing Census data.

The user experience is much more polished on Data.Census.Gov than it was on the American FactFinder. It seems to have been built with the general public more in mind the data-centric business users.

Why use Data.Census.Gov?

It’s unlikely there isn’t something here that could help you. A better understanding of your environment will help you make better decisions. Also, avoid potentially disastrous mistakes.

Most people think of the Census of only having data on population and demographics. In fact, the Census has a lot more. You can find data on health, housing, business/trade, employment, and more.

So, whether your business is retail, manufacturing, B2C, or B2B, you’re likely to find insights here that you would not have otherwise known.

How to access census data market research?

With the American FactFinder, there were four ways to conduct a search: Community Facts, Guided Search, Advanced Search, and the Download Center.

At Census.Data.Gov you are presented with two options. A search bar at the top, and “canned “searches at the bottom.

Start your search with whatever’s most important to you. If it’s a geographic area, start with that. If it’s related to employment, population, or some other topic, start with that.

At any time, if you want to start over, click on the United States Census Bureau button in the upper left. That will take you back to the home page to start a new search.

A solely geographic search

A geographic search will bring up a screen full of “quick facts” about that area. To access this information you need to select the geographic area you want from the drop-down menu that appears as you enter your query. Don’t just type it and click Enter.

The “quick facts” include things like People and Population, Race and Ethnicity, Families and Living Arrangements, among other topics. Basically, the same topics outlined in the “canned” searches at the bottom of the home page.

A topic-based search

A search that includes a topic such as health insurance or housing will give you a results page that includes TABLES, MAPS, and PAGES related to your query. By clicking on the corresponding result-type along the top of the page, you’ll be taken to results that are exclusively that type.

Tables

census data market research tables
Credit: data.census.gov

TABLES are the bread and butter of the data-centric user. Upon clicking on the TABLES option, you’ll see a list of tables in the left-hand menu that corresponds with your query.

Once you find the table you’re interested in delving into, click the Customize Table button. It’s in the upper-right.

Now, you can expand and collapse rows so you can only see the data you’re interested in.

When you’re ready to get this information into a spreadsheet, click the chevron (two arrows pointing up) by the title of the table. Select Download/Print/Share. Next, you’ll select the years you want information for and click Download when you’re ready.

Unfortunately, the downloaded data sucks. As I also outlined in the Defining a Target Market… post. It’s difficult to read and can’t easily be put into a format that facilitates understanding. It can’t be copied and pasted into a spreadsheet easily. The American FactFinder site did allow for easy copying and pasting..

Also, if you’d like to add or remove other geographic areas, or the year of the data, click CHANGE GEOGRAPHY or CHANGE YEAR respectively.

Also using the Filter with the tables will allow you to use similar functionality as the Advanced Search option. The Advanced Search will be covered later.

Once you’re satisfied, you can click TABLES in the upper left corner to return to the main tables page.

Maps

census data market research map
Credit: data.census.gov

The map and table are tied together. The changes you make in one will bleed over into the other. For instance, if you choose a different Geography in the map, your table will change accordingly.

Along the top, you can also change the Data Variable. These options correspond with the rows in your table.

Geographies will change color according to the data variable. In the lower-left, you’ll see a legend that shows the amounts and quantity of Geographies in each quintile.

You also have the option to click on surrounding Geographies (states, counties, etc.). When you do, they’ll be added to your analysis.

Filters

In the tables, maps, and the Advanced Search, you can narrow down the results by adding Filters. The Filters are pretty intuitive. Select those that you want to use and the data will be updated accordingly. If a Filter isn’t available, it will be greyed out.

Census data market research

What other tips and tricks do you have for finding the data your business needs with Data.Census.Gov?

Do you know of a better way to get information from the tables into spreadsheets?

Join the conversation on Twitter!

Government Statistics for Market Research via USA.gov

government statistics for market research featured

Links to valuable government statistics for market research can be found in the Data and Statistics section of the USA.gov website (those links can also be found below!). These resources are valuable whether doing market research or drafting a business plan. You’ll appreciate the value of the information and the time saved.

Here is a link to the government statistics for market research at USA.gov.

What is the Data and Statistics section of the USA.gov website?

The Data and Statistics section of the USA.gov website doesn’t really have any original data. It’s more of a gateway to other government websites that have the information you need.

It’s a good place to start if you are wondering if any data even exists about a specific topic. Some of the topics addressed are:

Economics

Information from the Bureau of Economic Analysis. This includes data on industries, trade, other economic data including the GDP.

The justice system

Provided by the Bureau of Justice Statistics. Data on crime, victims, offenders, and the operation of the justice system at all levels – local through national.

Labor

Labor information comes from the Bureau of Labor Statistics. The BLS prides itself on the objective reporting of data. This data is used to support public and private decision making. Things such as price changes and labor market activity are addressed.

Transportation

The Bureau of Transportation Statistics provides information on airline performance, transportation safety, and much more. As part of the DOT, this site is the preeminent source of data on anything with wheels or wings.

Demographics

The Census Bureau is the granddaddy of all demographic information sources for the U.S. Additionally, you can also find a plethora of business data here too.

Energy

All things involving energy are covered on the Energy Information Administration website. They collect data on all sources of energy. Their goal is to provide impartial information and encourage sound policymaking.

Taxes

The Internal Revenue Service isn’t all that popular with the general public – for good reason. But, maybe you can get a little bit of value for your money by utilizing their statistics information. Included, is data on income, foreign companies controlled by U.S. companies, and exports. Plus, investments in the U.S. by foreign entities, among many other things.

Agriculture

The National Agricultural Statistics Service addresses nearly every aspect of U.S. agriculture. Production, prices, labor & wages, chemicals, and demographics are all part of the data they collect.

Additionally, the Economic Research Service, which is also part of the USDA, addresses agriculture issues too. The ERS’s focus is more on the future (trends and emerging issues) than the past.

Education

The National Center for Education Statistics addresses education. As you might have guessed. As part of the U.S. Department of Education, they are the number one aggregator of data on education in the federal government.

Health

The National Center for Health Statistics is part of the CDC. Their data is, of course, health-related. Information on nutrition, vital statistics, and death is also addressed.

Science & engineering

Here’s a data source that you might not have known about – the National Center for Science and Engineering Statistics. They exist to collect data on research & development activities and the STEM workforce. Also U.S. competitiveness in STEM fields, and STEM education.

Government spending

The authoritative site for U.S. government spending is USAspending.gov. As a taxpayer, you might find this a bit depressing. But, if your business revolves around government spending, you’ll appreciate the transparency.

State & local governments

The federal government isn’t the only public entity that has money burning a hole in its pocket. On the USA.gov website, you can find links to your state and local government websites. No guarantee that they’ll report with the same level of detail as the federal government. But, if you need it, you’ll at least have a starting point for research.

Social security

The Office of Research Evaluation and Statistics is part of the Social Security Administration. Their duties include reporting data related to social security payments, benefits, and more.

Maps

In addition, there is a collection of very cool maps from the Census Bureau, USGS, EPA, and other agencies.

market research data sources usa.gov maps
Click to enlarge
Credit: usa.gov

Why should I use the USA.gov Data and Statistics?

No matter what you’re researching, I would suggest at least glancing at the USA.gov website. It will help you make sure you’ve got a complete picture. Most market research will revolve around information about consumers and businesses. However, information from other sources can help paint a complete picture.

You might even come across a resource that you didn’t know existed. This can ensure that you have rounded out your knowledge of your industry. Which, is particularly important if you are in the startup stage.

How to use these government statistics for market research

Since this website is merely a portal to other government resources, there’s not really any technical know-how needed. Obviously, that might change if you follow a link to another government website/tool.

I would suggest if you have the time, to browse all the federal agencies listed and consider how they might apply to your market research. Again, you might already have a comprehensive picture of your industry/market. But, information presented in a different context might compound your understanding of a particular subject.

Analyzing market research from the U.S. government

In addition to the USA.gov website, the Data.gov website also serves as a valuable resource. Here, you’ll find detailed information about the American public. About their workplaces, purchasing habits, and about any other aspect of life you can think of.

Are there any other resources for this type of information (government or private) that deliver the same value as the sites listed above?

What about overseas? It’s a big world out there and marketing to international customers could be very lucrative. Where can similar information be found for other countries?

Join the conversation on Twitter!

Business Plan Demographics – Defining a Target Market

business plan demographics featured

Sorting through demographic information is one of the first steps in doing market research and competitive analysis. This is stuff you’ll need to know in order to prepare an effective business plan. Without this information, you, as a founder, don’t know if there is a sufficient market to support your business. You will also be starting off at a disadvantage when planning other aspects of your business.

**Note: this business plan demographics guide was written just before the Census Bureau changed its primary portal for data from the American FactFinder to Data.Census.Gov.

Download a free copy of the workbook used in this post

Complete the form below and click Submit.
Upon email confirmation, the workbook will open in a new tab.

Keep in mind that this workbook is only designed to work with table S0201, Selected Population Profile in the United States. Any other table might not be in the correct format.

About these posts

This series of posts was written to convey my take on how to write a business plan. My intent is to follow up with several more posts after this one.

I’m using the U.S. Small Business Administration (SBA) Plan your business guide as my outline (link). In true SpreadsheetsForBusiness.com fashion – I plan to include free downloadable spreadsheets where appropriate.

Rather than just recycling the same information you could find elsewhere, I’m going to take this journey with you. I’ll be building my own business plan as I write these posts. This is my first business plan, so you’ll be learning right along with me.

My business plan

My plan is based around a hypothetical business that will manufacture and market a hair regrowth product for men (and women, I suppose). The plan is to manufacture the product with all-natural ingredients.

What are business plan demographics?

Sorting through demographic data for your business’ potential customers is the first step in understanding what type of person (or business) might be interested in your product or service.

It can provide an unofficial ceiling to the number of customers you might expect. It’s from this information you can get into more detail about demand, market saturation, pricing, and so on.

Common demographic information includes:

  • Gender
  • Age
  • Race
  • Income
  • Education
  • Marital status
  • Employment status
  • Geographic area

Why worry about business plan demographics?

Focusing on marketing to specific individuals helps you plan with clarity. The saying goes: “you can’t please all the people all the time.” By not trying to market to everyone a little bit, you can focus your efforts on creating a really good experience for some people.

Understanding your target demographics can help you determine if your target market is saturated. Read this post:
CALCULATING MARKET SATURATION FOR YOUR BUSINESS PLAN

Whatever your business is, it probably is a reflection of yourself. Your interests and talents, that is. Who you market to will also depend on your characteristics and preferences. So, as you choose the demographics of your avatar, consider who you identify with and would be comfortable marketing to.

How to find and analyze business plan demographics

The market for a product or service is quantified by the number of people who make it up and the total amount of money they spend. We can quantify the size of the market by segmenting people based on their demographic characteristics

Of course, since most of this information is numerical, I’ll be using a spreadsheet to keep track of what I found and what changes in variables mean for the market of my aspiring business.

Also, I’ll be using online resources for the sake of time and simplicity. Theoretically, market research could involve things like focus groups and surveys. That’s more involved than I want to get for this idea, so, I’ll stick with the free information.

The SBA has a nice list of resources for market and competitive analysis here.

Demographic information

Here, we’re just looking for basic information about the people who I might be selling to. For instance, how many people are in the age range that I would market to? How much money do they make? Are they single and looking to mingle? Or, are they in committed relationships and proud of their bald head (like a certain “old man” I used to know and miss very much)?

From FactFinder to spreadsheet

First stop is the U.S. Census FactFinder (link).

Here, you can find Census data about your state, city, or even zip code. Not every business is going to be nationwide. Some, like a restaurant, will be very local.

Also, if your business will market to other businesses (B2B), then the information contained here may or may not be pertinent to you. Try another part of the Census website called the Small Business Edition (link) if you’re not finding what you need.

Interested in mining the Census website for more valuable market research? Read this post:
CENSUS DATA MARKET RESEARCH AT THE NEW DATA.CENSUS.GOV

Since, as of now, I envision my business being nationwide (at the very least regional), I chose to use the “Guided Search.” From there, in the “Topics” section, I chose to look at information pertaining to age, sex, age group, income/earnings (households), and marital status.

I can always delve into more detail or retrieve different information at a later time. My hope is that this gets me started.

business plan demographic analysis census search
Click to enlarge.
Credit: factfinder.census.gov

Additionally, on the next screen, I chose to break the information down by region. I included all regions so that I could total them for a view of the entire country.

Finally, on the last screen, I opted to see the one table that outlined this information in 2017, the latest year available.

Don’t bother with the “Download” Action. It will give you your data in a different format than it is displayed.

download format
Click to enlarge

Instead, just highlight everything in the FactFinder table and copy + paste it in a spreadsheet.

business plan demographic analysis copy census table
Click to enlarge
Credit: factfinder.census.gov

Fixing errors

From there, do a Find and replace in your spreadsheet to get rid of the errors that are a result of a “=” being placed in front of the “+/-.01” in the Margin of error column. Replace the “=” with an apostrophe. Be sure to Also search within formulas.

find and replace

Filtering for the demographic information I need

My goal here is to get a range of the number of potential customers based on a set of demographic statistics. I have a lot more information than I need, so let’s see if we can widdle this down into something more useable.

To do this, I added some columns to the Demographic Info worksheet.

First of all, I added a column (Estimate #) that aimed to translate some of the percentage population information into quantities. The format of every download from FactFinder isn’t going to be the same. But, an attempt was made to give you access to both percentage and quantity information for each line item.

Additionally, you’ll find a column named Enter 1-10 to rank demographics. Here, you’ll be able to rank demographic information and narrow down your market on the Pick Demographics worksheet.

Want to nail down the size of your market before you move forward? Read this post:
MARKET SIZE FOR A BUSINESS PLAN – 2 METHODS TO GAUGE IT

Creating customer avatars

Maybe you have a couple of different mixes of demographics in mind. That’s fine. Once you are satisfied with one mix of demographics you can highlight the information on the Pick Demographics worksheet, then copy and paste the values (Ctrl + Shift +V) into one of the boxes on the Customer Avatars worksheet.

This allows you to keep tabs on several different customer profiles as you move forward with your business plan.

Keep in mind, this is just the first step of the business plan. The whole point of a plan such as this is to be proactive. In order to be proactive, you’re going to have to be flexible.

If, as you move along through the steps, you reconsider your target demographic – that’s fine. Just circle back and refine your avatars and make adjustments to other parts of the plan as necessary. Don’t get discouraged if you have to do this. That is the whole point of this exercise.

My avatars

For my avatars, I created four, relatively similar mixes of demographic characteristics.

Gender and income

All include males. Though females can also suffer from hair loss, I am assuming that males would be the primary customer and who the majority of marketing would be geared toward.

Next, every mix of demographics included individuals with earnings as opposed to those with retirement income, with Social Security income, or any other type of public assistance.

Right now, I anticipate that this product would be sold at a premium price due to its uniqueness and all-natural ingredients. This would mean that customers would likely need to earn above-median incomes in order to be in a position to buy a product such as this. Assumptions such as this might change as I progress through this business plan.

In three out of my four avatars, I made assumptions about the relationship status of these men. The demographics included were Now married, except separated, Never married, and Separated. These were my three main avatars.

Education

The fourth included Males, With earnings, and who were High school graduates. This is my “catch-all” avatar. The real total addressable market for my product is probably between this population and the total of the three mentioned above.

The main difference between the three main avatars had to do with education. I assumed that men who were single might be more likely than married men to purchase a product such as this, I lowered the EDUCATION ATTAINMENT to Some college or associate’s degree.

business plan demographics avatars

Defining a target market with business plan demographics

Be sure to download your own copy of the workbook used in this post. Just fill out the form at the top.

What other sources would you use to find demographic information for your business plan?

How about the avatars? How would you have screened them further?

Join the conversation on Twitter!