

The church’s Pro Forma (expected) Balance Sheet
With all of the groundwork laid for the financial budget, we’ll turn our attention over to the Executive Summary worksheet.
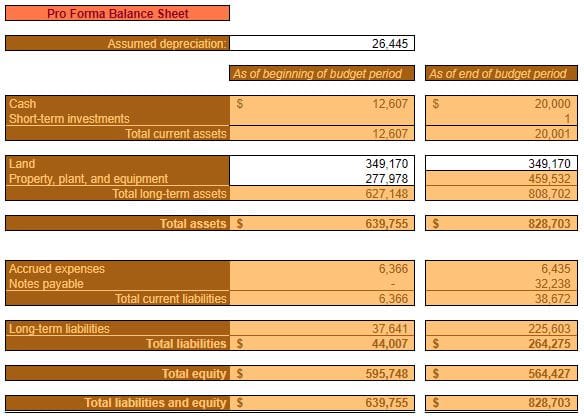
Here, you’ll find two pro forma financial statements. The first of which is the Pro Forma Balance Sheet. Pro forma, in essence, means “projected” or “expected.” This is the expected changes in your church’s Balance Sheet accounts based on the inputs you entered throughout the financial budget.
As of
If you don’t like what you see, you have the opportunity to revisit your inputs on the previously mentioned worksheets. There, you can tweak your plans to give you an expected outcome that you’re more satisfied with.
The Pro Forma Balance Sheet
Assets
First of all, beginning and end(ing) Cash and Short-term investment balances are pulled directly from the Cash Budget.
After that, Land and Property, plant, and equipment are itemized. Since Land doesn’t routinely affect cash balances (but definitely affects the Balance Sheet) you’ll have to enter this information manually for your church.
Additionally, a beginning balance will have to be entered for Property, plant, and equipment. Because that information was not captured elsewhere in the financial budget. The ending Property, plant, and equipment is affected by what you entered in the capital expenses section of the Cash Disbursement Schedule.
Don’t forget to enter an amount for Assumed depreciation at the top of the Balance Sheet. Again, this is a non-cash expense, so it wouldn’t be captured elsewhere in this workbook. With your existing depreciation schedules and planned capital expenses, this should be easy enough to estimate.
That’s it for Assets. You’ll see that current and long-term assets are totaled for both the beginning and ending periods.
Liabilities and equity
Accrued expenses and Notes payable beginning and ending balances are automatically pulled from information entered elsewhere. As are Long-term liabilities.
Accrued expenses balances will be affected by Cash Disbursements and Notes payable/Long-term liabilities by the amount of borrowing entered on the Cash Budget.
Total liabilities are the sum of Accrued expenses, Notes payable, and Long-term liabilities. Total equity is the difference between Total assets and Total liabilities.
Therefore, it stands to reason that Total liabilities and equity will automatically equal Total assets. Assuring you that your Pro Forma Balance Sheet is balanced and representative of your church’s planned financial situation.
Why have a pro forma balance sheet?
As a small part of strategic planning, the Pro Forma Balance Sheet is drafted for the same reason that strategic planning is undertaken. Not so much because you feel that you can precisely forecast the future. But, rather, to give your church’s Balance Sheet accounts an appropriate amount of thought.
Rather than simply hoping that everything works out, you’re given the opportunity to address problems head-on and also capitalize on potential opportunities.
The church’s Pro Forma (expected) Cash Flow Statement
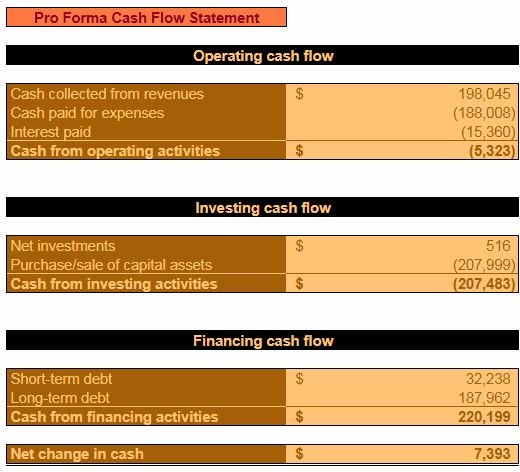
The next pro forma financial statement that you’ll find is the Cash Flow Statement. Here, you’ll see the changes in the cash balance expressed in a different manner than previously seen. Changes are categorized by operating, investing, and financing cash flow.
You might also notice that below the Pro Forma Cash Flow Statement is the Pro Forma Income Statement. Why are there three pro forma financial statements when I said there’d be two?
The Pro Forma Income Statement was copied over from the Church Operating Budget workbook. It doesn’t pull information from the financial budget. However, many of the amounts from the Pro Forma Income Statement are needed in order to calculate the Ratios below.
There are no beginning or end of the budget period amounts on a Cash Flow Statement. That’s because it encompasses the entire budget period – like the
Pro Forma Income Statement. By contrast, the Pro Forma Balance Sheet takes snapshots of particular times.
The Pro Forma Cash Flow Statement
Operating cash flow
In the Operating cash flow section, Cash collected from revenues and Cash paid for expenses are totaled.
Cash collected from revenues is the sum of the Total cash collections from revenue on the Cash Collection Schedule. Cash paid for expenses is the sum of Total cash payments for each category of expenses on the Cash Disbursement Schedule.
Interest paid is the total cash spent on interest for short and long-term borrowings. These amounts are totaled in the background. They aren’t itemized in the Cash Budget or the Cash Disbursement Schedule.
Cash from operating activities = Cash collected from revenue – Cash paid for expenses – Interest paid
This is the total effect on cash that operating activities had for the budget period.
Investing cash flow
Net investments are the total of all Deposits and Withdrawals in the Investments section of the Cash Budget. It is the net addition to, or subtraction from, cash that has come from the investment account.
Purchase/sale of capital assets is the net amount of cash paid for capital expenses. Or, conversely, cash received from the sale of equipment. These amounts are totaled on the Cash Budget and Cash Disbursements Schedule. For simplicity’s sake, no equipment sales are assumed to have taken place. It’s assumed that cash received from the sale of capital assets would offset cash spent on the
Cash from investing activities = Net investments – Purchase/sale of capital assets
This is the total effect on cash that investing activities had for the budget period.
Financing cash flow
The last section on the Pro Forma Cash Flow Statement addresses short-term debt’s and long-term debt’s effect on cash.
Short-term debt reflects the difference between the end and the beginning Notes payable amounts on the Pro Forma B
This has been factored into the formulas.
Long-term debt reflects the difference between the end and the beginning Long-term liabilities amounts on the Pro Forma Balance Sheet.
Cash from financing activities = Short-term debt + Long-term debt
This is the total effect on cash from financing activities (borrowing).
The total change in cash
Net change in cash = Cash from operating activities – Cash from investing activities + Cash from financing activities
This net change in cash should equal the difference between your church’s Beginning cash balance and Ending cash balance (first period and last period respectively). If it does not match, an error will show up in the cell below. Unless a formula has been changed in this workbook, these amounts should automatically be equal.
Why have a pro forma cash flow statement?
For the same reason to have a Pro Forma Balance Sheet and Pro Forma Income Statement. It’s the culmination of a lot of critical thinking that went into planning for the next year. It gives you the opportunity to address potential issues proactively rather than reactively.
Ratios and chart
Financial ratios complement the information contained in financial statements. Without context, they don’t mean anything. When paired with financial statements, however, they provide insight that might be difficult to interpret otherwise.
A good ratio or a bad ratio is a relative sort of thing. Every industry is different. Nonprofit organizations can’t be expected to have ratios (particularly profitability ones) on par with for-profit businesses. Everything must be judged in context. In this case, the best benchmark to use might be your church’s historical ratios. Or, if you have access to them, other, similar, churches ratios.
Any individual, or group of, ratios don’t make or break a business. They simply help to paint a clearer picture of the organization’s current financial health. They might point out strengths or weaknesses that you wouldn’t have realized otherwise.
Most ratios are calculated using simple division. Others are a bit more complicated. Let’s look at some of the ratios that will be calculated for you when you complete the church financial budget.
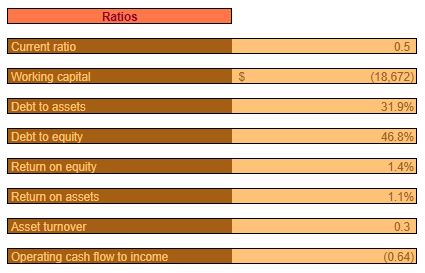
Current ratio
Current ratio = Total current assets ÷ Total current liabilities
This ratio demonstrates the church’s ability to pay its current liabilities
Working capital
Working capital = Total current assets – Total current liabilities
This is the excess or shortfall in current assets compared to current liabilities.
A negative number here implies that the church will have to bring in more current assets over the coming year in order to meet current liabilities.
Debt to assets
Debt to assets = Total liabilities ÷ Total assets
This is the percentage of assets financed by borrowed funds.
Most people think of debt as a bad thing. But, it all depends on how you put that borrowed money to work. Utilizing leverage can provide extraordinary returns – if the money is used wisely.
On the flip side, borrowed money generally leads to fixed expenses. If the necessary return on investment isn’t achieved, a downward spiral can start to develop.
Debt to equity
Debt to equity = Total liabilities ÷ Total equity
This ratio simply compares the two methods of financing – debt and equity.
At 100%, debt and equity would be equal. Less than that means that most of the assets are financed with equity. More than 100% means that most of the assets are financed with debt. As mentioned in the Debt to assets section – that isn’t necessarily bad. It’s all about how debt is employed.
Return on equity
Return on equity = Net profit ÷ Total equity
This is the percentage of profit earned on the equity balance in a given year. The higher profit is, the higher this ratio will be.
Return on assets
Return on assets = Net profit ÷ Total assets
This ratio shows the percentage of profit earned on the church’s entire catalog of assets. The higher net profit is, the better.
Asset turnover
Asset turnover = Total revenue ÷ average Total assets
This ratio demonstrates how effectively assets were used to generate sales. Similar to the Return on assets ratio, except comparing sales rather than Net profit to Total assets. This is just another means of ascertaining how much productivity the church was able to get out of its assets.
Want to look at a financial budget from the perspective of a for-profit business? Read this post:
EXAMPLE + TEMPLATE OF A SMALL BUSINESS FINANCIAL BUDGET
Operating cash flow to income
Operating cash flow to income = Cash from operating activities ÷ Net profit
This ratio demonstrates the difference between Net profit and actual cash received from operations
As discussed in the post on planning cash flow, the distinction must be made between revenue (also profit) and cash received. It is a matter of timing and it is critical for every organization, not just for-profit ones.
The saying “cash is the lifeblood of a business” is a cliche for a reason. Because it’s true. A billion dollars in revenue doesn’t mean anything if you don’t put $1 of that into your organization’s checking account.
While your anticipated Net profit might be good, also pay heed to what you expect your cash balance (particularly from operations – lifeblood) to do over the course of the next year.
Components of the church Cash Collections, Disbursements and Balances chart
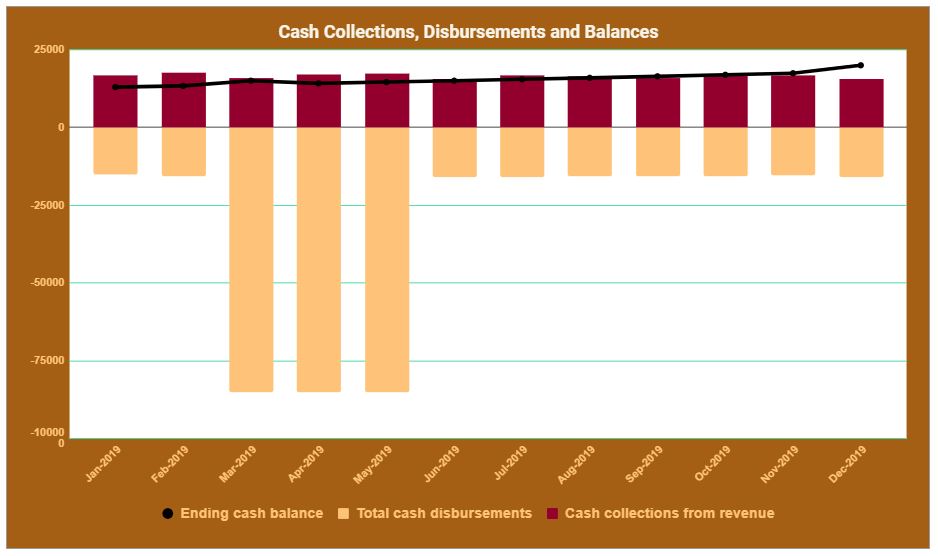
The Cash Collections, Disbursements, and Balances chart illustrates the changing balances every month over the planning period.
Cash collections from revenue can be compared directly to Total cash disbursements. The overall Ending cash balance is also charted.
Keep in mind that the Ending cash balance will also be affected by things such as capital expenses, borrowing, and investments.
Planning for different scenarios
You’re given the opportunity to expand upon your pro forma financial statements (as illustrated in the Executive Summary). This was also done in the church operating budget workbook. In order to be best prepared for what the future might hold, your church can also create scenarios whereby everything goes your way…or everything works against you.
For the Pro Forma Balance Sheet, Pro Forma Cash Flow Statement, and the Pro Forma Income Statement, you’ll have the ability to enter Multipliers and Override Amounts for both the Best-Case and the Worst-Case scenarios.
Why would you do such a thing? Understanding what your Best-Case and Worst-Case scenario might look like allows you to prepare even better for what the future might hold. Granted, you still don’t know whether you’re Best-Case, Worst-Case, or expected plan will come to fruition. It’s plausible that the future will be a combination of all three.
As I’ve said many times before (and will many times again) it’s about being ready for what the future might hold. First of all, if the Worst-Case, God forbid, materializes – you’ll hopefully have a plan for your church to weather the storm.
On the flip side, if the Best-Case, God willing,
The whole point, of all this planning, is that, hopefully, nothing will surprise you. Yes, this planning can be a chore. But if you go through with it, it’s unlikely that anything will be thrown at you that your church isn’t ready for.
How to use the best and worst-case scenario simulator
There are two methods that can be used separately, or together, to create different scenarios.
First of all, the Multiplier can be entered for both scenarios. For the Best-Case scenario, you’ll enter a positive amount. For the Worst-Case scenario, you’ll enter a negative amount.
“But,” you might be wondering, “isn’t the best-case positive for things like revenue and assets, and negative for things like expenses and liabilities?”
Yes, you are correct.
In addition, if you don’t feel that the Multiplier captures the true Best-Case or Worst-Case, you can enter an amount in the Override amount columns. If you enter an amount here, it will disregard the Multiplier, and directly input the amount you entered into the appropriate scenario.
An example
For instance, if you enter a Best-Case Multiplier of 15%, and the Most Likely Amount for Cash in the Balance Sheet is $20,000, then the Best-Case Total for Cash would calculate as $23,000.
However, you might know that a true Best-Case is even more than that, and would actually be $30,000. No problem, just enter $30,000 in the Best-Case Override amount. The Best-Case Total will update automatically. The same principle applies to the Worst-Case Override amount.
Things to consider
Best-cases and worst-cases are straightforward for some accounts. Others aren’t so clear. For example, is it better for the church to have more Property, plant, and equipment, or less?
That’s up for debate, I would imagine. It would make for a stronger balance sheet – in a vacuum. On the other hand, if that PPE isn’t doing them any good, it misrepresents their financial position and might be a drag on church operations.
This is the exact reason that the Override Amounts are included. You know your church best. So, if you don’t feel that the effects of the Best-Case or Worst-Case Multiplier are representative of a true best or worst-case, then you have the opportunity to enter an Override Amount.
Only
Potential logical inconsistencies
What can’t be assured is that the Multiplier and or Override Amounts won’t create illogical scenarios.
Keep this in mind as you play with the Best-Case and Worst-Case
The Balance Sheet, Cash Flow Statement, Income Statement, and Ratios
By now, you should be familiar with each of the Pro Forma financial statements
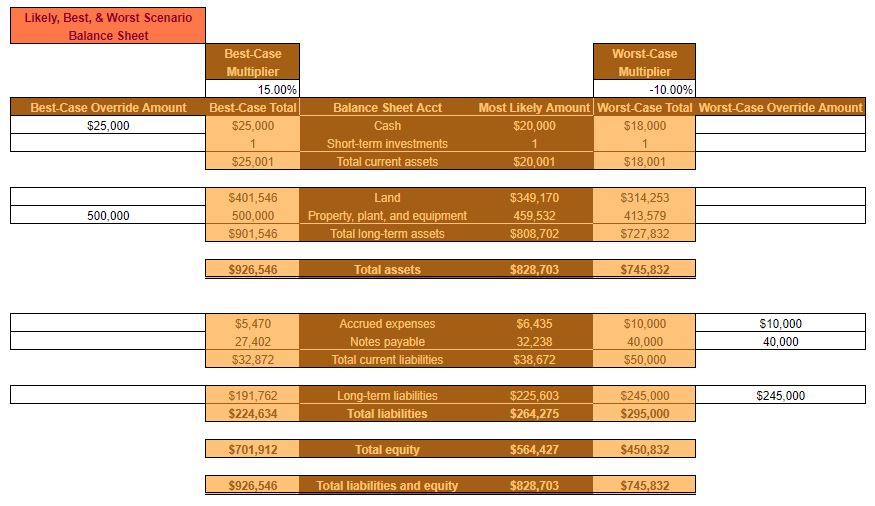
In the Balance Sheet section, you’ll have the opportunity to explore the effects of different scenarios on your church’s assets and liabilities. Total assets, Total liabilities, and Total equity will change accordingly.
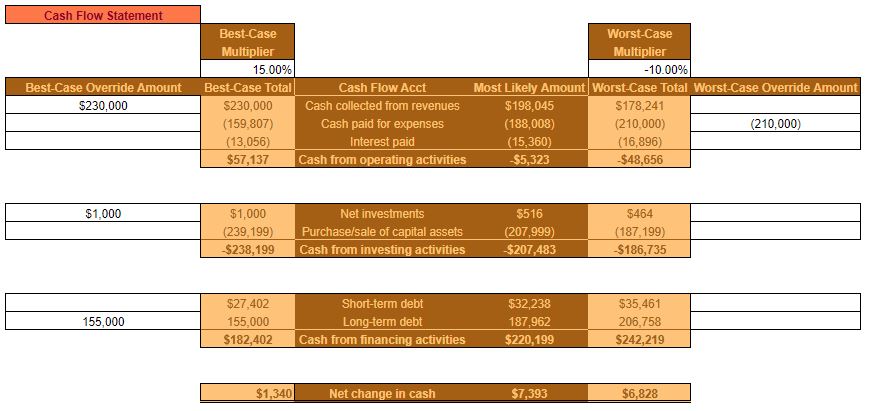
The Cash Flow Statement section will allow you to decide what the Best-Case and Worst-Case scenarios. The Net change in cash field will show you the effects of all these changes.
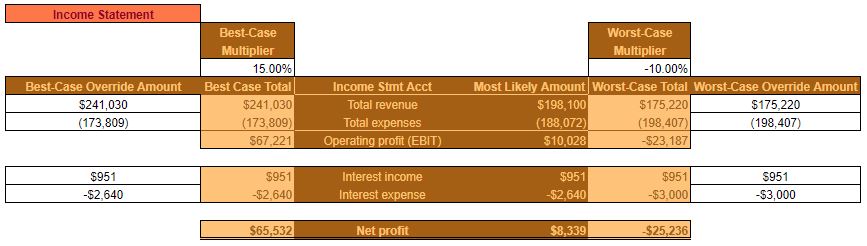
The Income Statement section is where you can tweak revenue and expense amounts. All changes will cause Net profit to be recalculated.
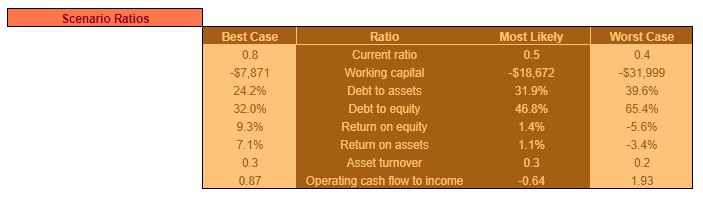
Finally, all of the Ratios from the Executive Summary are recalculated based on the Best-Case and Worst-Case amounts. Because the finances of a church are complex, some of the Ratios might not end up looking like a “Best-Case” or “Worst-Case” scenario. I.e. the Best-Case scenario might be worse than the Most Likely, and the Worst-Case might be better.
Use an Excel, Sheets, or OpenOffice template for your church financial budget
Download your copy of the Church Financial Budget by filling out the form at the beginning of the post.
Well, that finally wraps up the financial budget. It also wraps up strategic planning for the church. Seven posts, tens of thousands of words, and a few videos. In these, I’ve laid out everything I know about strategic planning in the context of churches. If you read and watched most of this – thank you.
All this material, admittedly, is theory. But, I tried to make the examples as tangible it’s possible. When you go through the exercise of strategic planning for your church, you might not be able to follow this “script” exactly. Hopefully, though, it will give you a good jumping-off point. Remember, the most important thing is to think about these topics. So you can be proactive in taking advantage of opportunities and avoiding threats.
What aspects of the financial budget could have been more realistic?
What cash flow challenges does your church face?
Help your fellow church management professionals:
Join the conversation on Twitter!