Using Census Data for Business – Find the Perfect Location

using census data for business featured

The Census Business Builder is an interactive tool that allows small business owners to make educated decisions about the location of their businesses. Of course, the location of a business can be an enormous factor in determining whether it is successful or a failure.

Click here to try the Census Business Builder for yourself.

What is the Census Business Builder?

This is a “wizard,” of sorts, for small businesses to use to find an ideal location. Information is presented in a map or report format.

Go To Map

The map is, as you would expect, very visual. It allows you to view the information by state, county, city, and zip code. Different sections of the map are color-coded depending on the variable selected.

using census data for business census map
Credit: census.gov

Variables include, but aren’t limited to the following:

  • Demographic information
    • Age
    • Income
    • Education
  • Business & workforce information
  • Consumer spending

Beyond that, you can filter any of the variables to reduce the “clutter” on your map. Then you can focus on the information you’re really interested in.
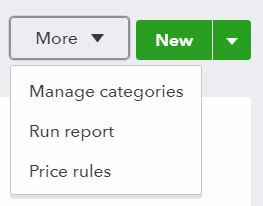
Create Report

Whereas the map allows you to customize what you see, the report gives you a rundown of the information it thinks you want.

There are three main sections of the report. They are listed below along with their sub-sections.

  • My potential customers
    • Demographics
    • Socioeconomic characteristics
    • Housing
  • Businesses like mine (based on the NAICS code)
    • Employer businesses
    • Business revenue
    • Nonemployer businesses
    • International trade
    • Workforce
  • Consumer spending

Not all the Businesses like mine information is always going to populate for a given geography. The more pinpoint the geography (Census tract, ZIP code) the more likely that information will be omitted. I assume this is done to protect privacy.

This resource is a tool for finding information about different industries. Information is available from the neighborhood level up to the national level. The information is presented in a more visual format; whereas a lot of other Census data is in tables.

Why should I use the Census Business Builder?

Because it is map-based, the primary purpose of this tool seems to be to find a good location for your business. Thus, it might prove more beneficial for retail or business-to-consumer (B2C) businesses than other types.

That being said, there are business-related variables and filters too. So, you might find information for business-to-business applications too.

If you have a good grasp on your “customer avatar,” and you are looking for the ideal place to locate your business, then the Census Business Builder could help you avoid costly mistakes and give your retail business the best chance at success.

Gathering and acting on market research takes scarce resources like time and money. You want to know that those resources are well spent.

market research data sources census business builder
Credit: census.gov

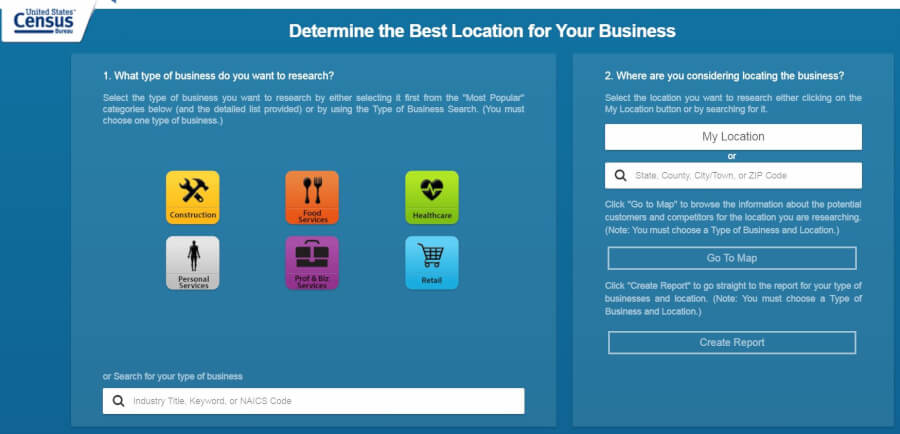
How to use the Census Business Builder

Using the Census Business Builder is relatively easy and surprisingly intuitive for a government website.

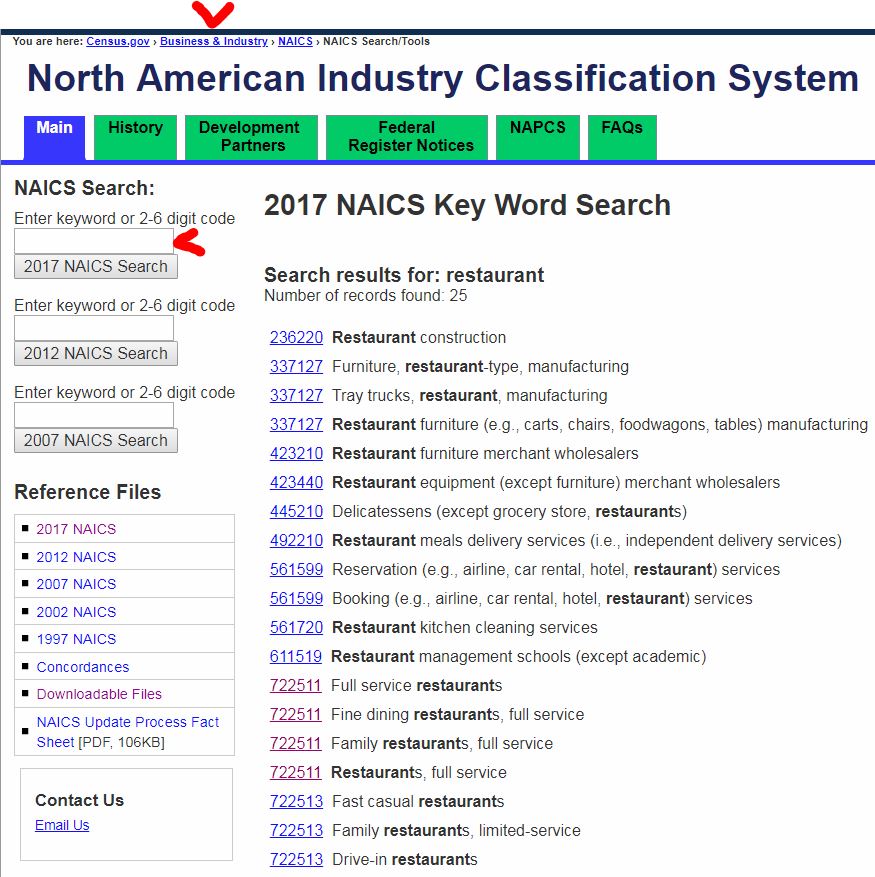
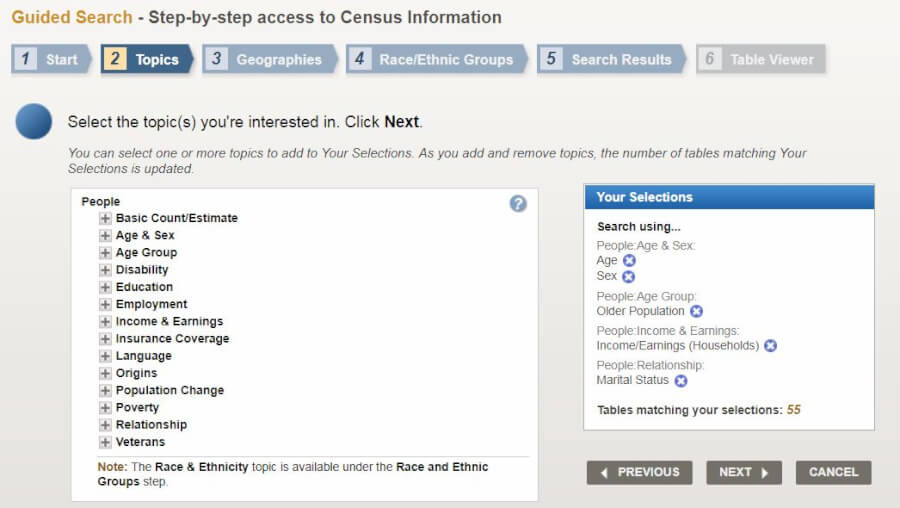
The first step is to select your industry, or manually type it in.

When browsing the map, I couldn’t ascertain what difference it made to select one industry over another. I think this only affects what you will see in the report.

From there you’ll select the location you want to analyze and then Go To Map or Create Report.

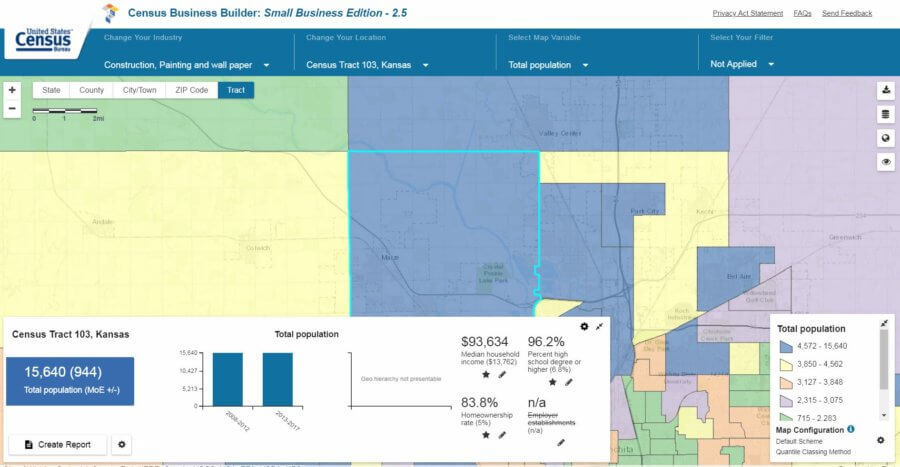
Using census data for business – the Census Business Builder map

The map will allow you to move around and see a visual representation of your location, the selected variable, and the selected filters. If you’re viewing data by city, then each city will be color-coded based on which quartile it’s in. If you Change your location to a ZIP code, state, or something else, the map will change accordingly.

Changing the Map Variable is going to affect what you see on represented on the map. Note that you can scroll down on the Map Variables. So, if you don’t see what you want at first glance, there are more options below that.

Your filter options are the same as the Map Variables. By choosing a filter, you’ll be able to exclude geographic areas from your map that don’t meet certain criteria. You’ll set a minimum and maximum for the filter and then select Apply Filter. Your map will update accordingly.

Remember, that like the Map Variables, you can scroll down to find more options for your filter. Apply up to five filters.

At any time, in the map view, you can create a report based on the industry and location selected. Just click Create Report in the lower-left corner.

Using census data for business – the Census Business Builder report

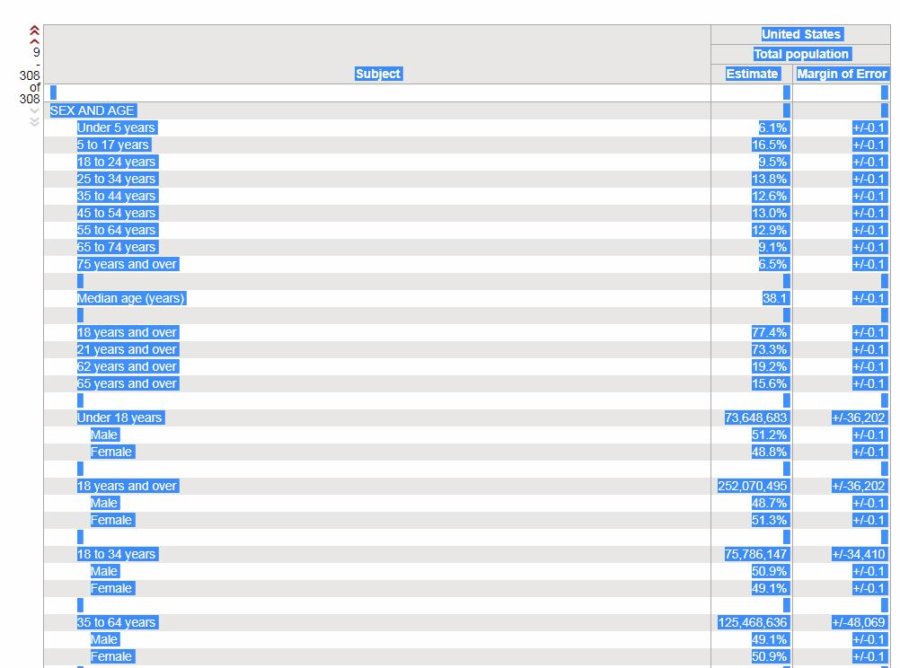
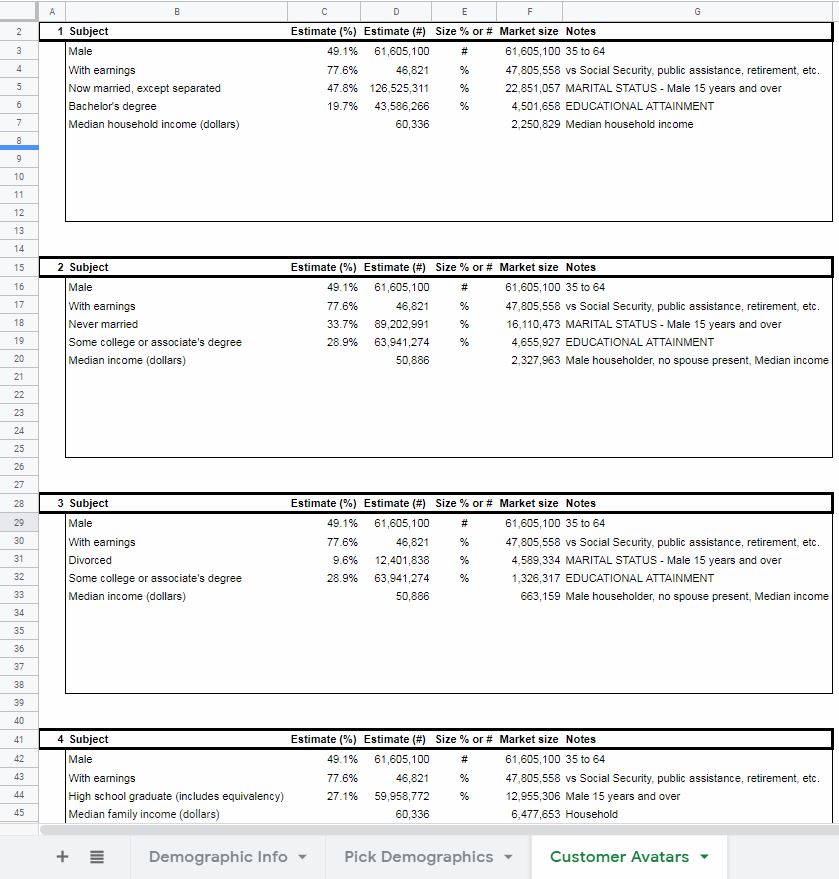
The report will provide a nice summary of the location selected. Included will be every piece of data available in the map, in a presentable format. Ready to be copied and pasted into your business plan, if desired.
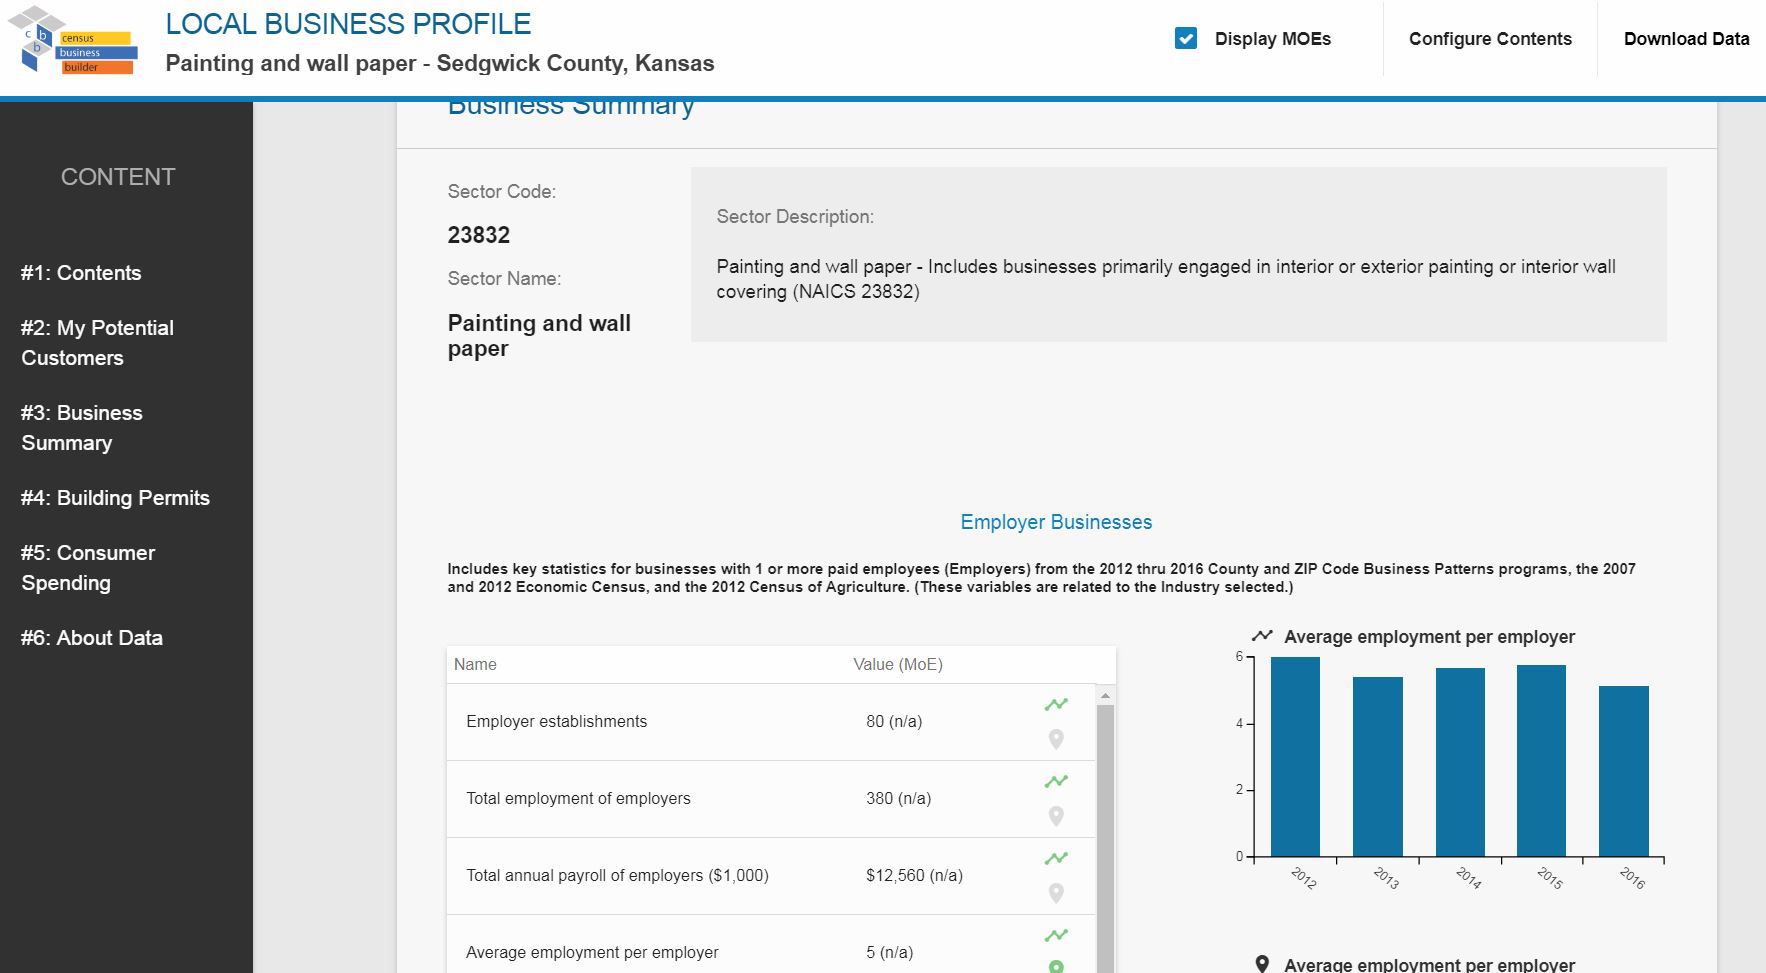
using census data for business census report
Click to enlarge
Credit: census.gov

Obviously, the report is less interactive than the map. There are some adjustments that can be made, though. Along the top, you see the option to Display MOEs (margin of errors), Configure Contents, and Download Data.

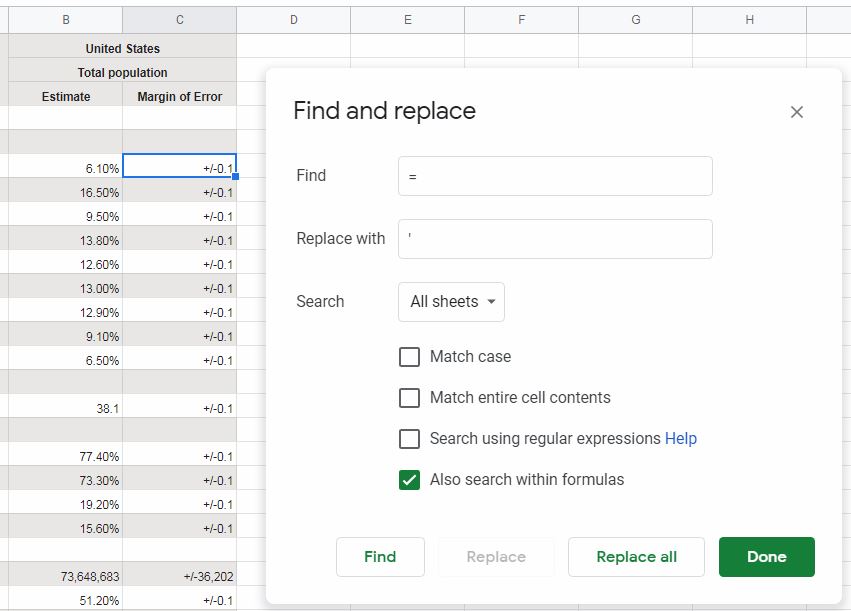
The MOE information probably won’t mean much to the average small business owner. But, if you’re curious, it simply means that the data isn’t exact and could actually be higher or lower by the MOE amount. For instance, let’s say the Percent high school degree or higher is 90% and the MOE is 1%. Then, the actual Percent high school degree or higher is anywhere from 89% to 91%.

The option to Configure Contents allows you to remove sections of the report that might not be relevant.

Finally, the Download Data option allows you to create a spreadsheet or a PDF with the information in the report. From there you can perform your own analysis, copy to a business plan, or whatever else you wish.

Using Census data for business – a valuable tool

What are some “hidden” treasures in the Census Business Builder map that I missed? Is there a combination of variables and filters that provide especially useful information?

Join the conversation on Twitter!

Government Statistics for Market Research via USA.gov

government statistics for market research featured

Links to valuable government statistics for market research can be found in the Data and Statistics section of the USA.gov website (those links can also be found below!). These resources are valuable whether doing market research or drafting a business plan. You’ll appreciate the value of the information and the time saved.

Here is a link to the government statistics for market research at USA.gov.

What is the Data and Statistics section of the USA.gov website?

The Data and Statistics section of the USA.gov website doesn’t really have any original data. It’s more of a gateway to other government websites that have the information you need.

It’s a good place to start if you are wondering if any data even exists about a specific topic. Some of the topics addressed are:

Economics

Information from the Bureau of Economic Analysis. This includes data on industries, trade, other economic data including the GDP.

The justice system

Provided by the Bureau of Justice Statistics. Data on crime, victims, offenders, and the operation of the justice system at all levels – local through national.

Labor

Labor information comes from the Bureau of Labor Statistics. The BLS prides itself on the objective reporting of data. This data is used to support public and private decision making. Things such as price changes and labor market activity are addressed.

Transportation

The Bureau of Transportation Statistics provides information on airline performance, transportation safety, and much more. As part of the DOT, this site is the preeminent source of data on anything with wheels or wings.

Demographics

The Census Bureau is the granddaddy of all demographic information sources for the U.S. Additionally, you can also find a plethora of business data here too.

Energy

All things involving energy are covered on the Energy Information Administration website. They collect data on all sources of energy. Their goal is to provide impartial information and encourage sound policymaking.

Taxes

The Internal Revenue Service isn’t all that popular with the general public – for good reason. But, maybe you can get a little bit of value for your money by utilizing their statistics information. Included, is data on income, foreign companies controlled by U.S. companies, and exports. Plus, investments in the U.S. by foreign entities, among many other things.

Agriculture

The National Agricultural Statistics Service addresses nearly every aspect of U.S. agriculture. Production, prices, labor & wages, chemicals, and demographics are all part of the data they collect.

Additionally, the Economic Research Service, which is also part of the USDA, addresses agriculture issues too. The ERS’s focus is more on the future (trends and emerging issues) than the past.

Education

The National Center for Education Statistics addresses education. As you might have guessed. As part of the U.S. Department of Education, they are the number one aggregator of data on education in the federal government.

Health

The National Center for Health Statistics is part of the CDC. Their data is, of course, health-related. Information on nutrition, vital statistics, and death is also addressed.

Science & engineering

Here’s a data source that you might not have known about – the National Center for Science and Engineering Statistics. They exist to collect data on research & development activities and the STEM workforce. Also U.S. competitiveness in STEM fields, and STEM education.

Government spending

The authoritative site for U.S. government spending is USAspending.gov. As a taxpayer, you might find this a bit depressing. But, if your business revolves around government spending, you’ll appreciate the transparency.

State & local governments

The federal government isn’t the only public entity that has money burning a hole in its pocket. On the USA.gov website, you can find links to your state and local government websites. No guarantee that they’ll report with the same level of detail as the federal government. But, if you need it, you’ll at least have a starting point for research.

Social security

The Office of Research Evaluation and Statistics is part of the Social Security Administration. Their duties include reporting data related to social security payments, benefits, and more.

Maps

In addition, there is a collection of very cool maps from the Census Bureau, USGS, EPA, and other agencies.

market research data sources usa.gov maps
Click to enlarge
Credit: usa.gov

Why should I use the USA.gov Data and Statistics?

No matter what you’re researching, I would suggest at least glancing at the USA.gov website. It will help you make sure you’ve got a complete picture. Most market research will revolve around information about consumers and businesses. However, information from other sources can help paint a complete picture.

You might even come across a resource that you didn’t know existed. This can ensure that you have rounded out your knowledge of your industry. Which, is particularly important if you are in the startup stage.

How to use these government statistics for market research

Since this website is merely a portal to other government resources, there’s not really any technical know-how needed. Obviously, that might change if you follow a link to another government website/tool.

I would suggest if you have the time, to browse all the federal agencies listed and consider how they might apply to your market research. Again, you might already have a comprehensive picture of your industry/market. But, information presented in a different context might compound your understanding of a particular subject.

Analyzing market research from the U.S. government

In addition to the USA.gov website, the Data.gov website also serves as a valuable resource. Here, you’ll find detailed information about the American public. About their workplaces, purchasing habits, and about any other aspect of life you can think of.

Are there any other resources for this type of information (government or private) that deliver the same value as the sites listed above?

What about overseas? It’s a big world out there and marketing to international customers could be very lucrative. Where can similar information be found for other countries?

Join the conversation on Twitter!

NAICS for Market Research – A Classification of Businesses

naics for market research featured

NAICS codes can be used to perform market research on businesses. The information you gather from NAICS market research will help you, as a small business owner, to make confident decisions in targeting customers.

Here’s a link to the NAICS section of the United State Census website.

*By the way, if you’re looking for the actual NAICS code for Marketing Research and Public Opinion Polling – it’s 541910.

What is a NAICS code?

NAICS stands for North American Industry Classification System. NAICS codes consist of between two and six digits. This code is used to classify businesses by activity (what products or services it provides).

Note that the first two letters of NAICS stand for “North American.” This means that NAICS codes are also used by our neighbors to the North and South – Canada and Mexico. The NAICS has, in large part, replaced the Standard Industrial Classification (SIC) system. You might remember SIC codes if you attended business school anytime prior to the year 2000.

The first two digits of a NAICS code represent the sector of the business. The third is for the subsector. The fourth is the industry group. Finally, the fifth and sixth represent the NAICS industry and national industry respectively (Source).

Any business might have more than one NAICS code. In fact, each location is given its own NAICS code.

Why NAICS is important

The NAICS exists to efficiently compile, create, and analyze business data. Data that is collected includes employment, revenue, and inventory; among many other things.

Since this much of this data is made public by the Census Bureau, you have the ability to use the NAICS for market research. Particularly if your business currently does, or plans to market to other businesses.

Beyond market research, NAICS codes can also help your business generate leads. In order to get the contact information, you’ll probably have to purchase it from a 3rd party vendor.

How to use the NAICS for market research

The first step to utilizing NAICS is to know the code you want information on. From the NAICS website, you can search by keyword on the left-hand side of the page. Searches can be performed on current or historical NAICS information.

The search should return codes that will link to a list of example businesses. This helps you be sure that you have precisely the right code.

naics for market research site
Credit: census.gov

Industry Statistics Portal results

Once you know the NAICS code you want to research, click on this link to be taken to the Industry Statistics Portal. After entering your code, you’ll be given links to related data sources.

Most searches will return you to to the same four results: County Business Patterns (CBP), Statistics of U.S. Businesses (SUSB), Economic Census (ECN), and Survey of Business Owners (SBO).

The CBP includes annual reports with information on the subnational level. Employment, number of establishments, and payroll data are included.

The SUSB pulls data from the Census Bureau. Most of which is in Excel format.

The ECN includes data on people, places, and businesses. Most of this data is from the Census Bureau FactFinder. If you’re technologically sophisticated, you can also pull data via an API.

Finally, the SBO can also be accessed via an API. Beyond that many of the links also end up at the Census Bureau FactFinder.

There’s a link in the lower left-hand corner of the page to Selected Visualizations. From what I saw, this was potentially interesting information about the industry in question. Furthermore, it would allow you to drill down to the state level. But, unfortunately, as of this writing, it’s a dead link.

I sent an email to let them know about it and to see when it would be working again. No response as of yet…

Market research with a NAICS code

What are some other circumstances where you would use the NAICS for market research?

Are there other marketing opportunities with NAICS codes besides lead generation?

Join the conversation on Twitter!

Business Plan Demographics – Defining a Target Market

business plan demographics featured

Sorting through demographic information is one of the first steps in doing market research and competitive analysis. This is stuff you’ll need to know in order to prepare an effective business plan. Without this information, you, as a founder, don’t know if there is a sufficient market to support your business. You will also be starting off at a disadvantage when planning other aspects of your business.

**Note: this business plan demographics guide was written just before the Census Bureau changed its primary portal for data from the American FactFinder to Data.Census.Gov.

Download a free copy of the workbook used in this post

Complete the form below and click Submit.
Upon email confirmation, the workbook will open in a new tab.

Keep in mind that this workbook is only designed to work with table S0201, Selected Population Profile in the United States. Any other table might not be in the correct format.

About these posts

This series of posts was written to convey my take on how to write a business plan. My intent is to follow up with several more posts after this one.

I’m using the U.S. Small Business Administration (SBA) Plan your business guide as my outline (link). In true SpreadsheetsForBusiness.com fashion – I plan to include free downloadable spreadsheets where appropriate.

Rather than just recycling the same information you could find elsewhere, I’m going to take this journey with you. I’ll be building my own business plan as I write these posts. This is my first business plan, so you’ll be learning right along with me.

My business plan

My plan is based around a hypothetical business that will manufacture and market a hair regrowth product for men (and women, I suppose). The plan is to manufacture the product with all-natural ingredients.

What are business plan demographics?

Sorting through demographic data for your business’ potential customers is the first step in understanding what type of person (or business) might be interested in your product or service.

It can provide an unofficial ceiling to the number of customers you might expect. It’s from this information you can get into more detail about demand, market saturation, pricing, and so on.

Common demographic information includes:

  • Gender
  • Age
  • Race
  • Income
  • Education
  • Marital status
  • Employment status
  • Geographic area

Why worry about business plan demographics?

Focusing on marketing to specific individuals helps you plan with clarity. The saying goes: “you can’t please all the people all the time.” By not trying to market to everyone a little bit, you can focus your efforts on creating a really good experience for some people.

Understanding your target demographics can help you determine if your target market is saturated. Read this post:
CALCULATING MARKET SATURATION FOR YOUR BUSINESS PLAN

Whatever your business is, it probably is a reflection of yourself. Your interests and talents, that is. Who you market to will also depend on your characteristics and preferences. So, as you choose the demographics of your avatar, consider who you identify with and would be comfortable marketing to.

How to find and analyze business plan demographics

The market for a product or service is quantified by the number of people who make it up and the total amount of money they spend. We can quantify the size of the market by segmenting people based on their demographic characteristics

Of course, since most of this information is numerical, I’ll be using a spreadsheet to keep track of what I found and what changes in variables mean for the market of my aspiring business.

Also, I’ll be using online resources for the sake of time and simplicity. Theoretically, market research could involve things like focus groups and surveys. That’s more involved than I want to get for this idea, so, I’ll stick with the free information.

The SBA has a nice list of resources for market and competitive analysis here.

Demographic information

Here, we’re just looking for basic information about the people who I might be selling to. For instance, how many people are in the age range that I would market to? How much money do they make? Are they single and looking to mingle? Or, are they in committed relationships and proud of their bald head (like a certain “old man” I used to know and miss very much)?

From FactFinder to spreadsheet

First stop is the U.S. Census FactFinder (link).

Here, you can find Census data about your state, city, or even zip code. Not every business is going to be nationwide. Some, like a restaurant, will be very local.

Also, if your business will market to other businesses (B2B), then the information contained here may or may not be pertinent to you. Try another part of the Census website called the Small Business Edition (link) if you’re not finding what you need.

Interested in mining the Census website for more valuable market research? Read this post:
CENSUS DATA MARKET RESEARCH AT THE NEW DATA.CENSUS.GOV

Since, as of now, I envision my business being nationwide (at the very least regional), I chose to use the “Guided Search.” From there, in the “Topics” section, I chose to look at information pertaining to age, sex, age group, income/earnings (households), and marital status.

I can always delve into more detail or retrieve different information at a later time. My hope is that this gets me started.

business plan demographic analysis census search
Click to enlarge.
Credit: factfinder.census.gov

Additionally, on the next screen, I chose to break the information down by region. I included all regions so that I could total them for a view of the entire country.

Finally, on the last screen, I opted to see the one table that outlined this information in 2017, the latest year available.

Don’t bother with the “Download” Action. It will give you your data in a different format than it is displayed.

download format
Click to enlarge

Instead, just highlight everything in the FactFinder table and copy + paste it in a spreadsheet.

business plan demographic analysis copy census table
Click to enlarge
Credit: factfinder.census.gov

Fixing errors

From there, do a Find and replace in your spreadsheet to get rid of the errors that are a result of a “=” being placed in front of the “+/-.01” in the Margin of error column. Replace the “=” with an apostrophe. Be sure to Also search within formulas.

find and replace

Filtering for the demographic information I need

My goal here is to get a range of the number of potential customers based on a set of demographic statistics. I have a lot more information than I need, so let’s see if we can widdle this down into something more useable.

To do this, I added some columns to the Demographic Info worksheet.

First of all, I added a column (Estimate #) that aimed to translate some of the percentage population information into quantities. The format of every download from FactFinder isn’t going to be the same. But, an attempt was made to give you access to both percentage and quantity information for each line item.

Additionally, you’ll find a column named Enter 1-10 to rank demographics. Here, you’ll be able to rank demographic information and narrow down your market on the Pick Demographics worksheet.

Want to nail down the size of your market before you move forward? Read this post:
MARKET SIZE FOR A BUSINESS PLAN – 2 METHODS TO GAUGE IT

Creating customer avatars

Maybe you have a couple of different mixes of demographics in mind. That’s fine. Once you are satisfied with one mix of demographics you can highlight the information on the Pick Demographics worksheet, then copy and paste the values (Ctrl + Shift +V) into one of the boxes on the Customer Avatars worksheet.

This allows you to keep tabs on several different customer profiles as you move forward with your business plan.

Keep in mind, this is just the first step of the business plan. The whole point of a plan such as this is to be proactive. In order to be proactive, you’re going to have to be flexible.

If, as you move along through the steps, you reconsider your target demographic – that’s fine. Just circle back and refine your avatars and make adjustments to other parts of the plan as necessary. Don’t get discouraged if you have to do this. That is the whole point of this exercise.

My avatars

For my avatars, I created four, relatively similar mixes of demographic characteristics.

Gender and income

All include males. Though females can also suffer from hair loss, I am assuming that males would be the primary customer and who the majority of marketing would be geared toward.

Next, every mix of demographics included individuals with earnings as opposed to those with retirement income, with Social Security income, or any other type of public assistance.

Right now, I anticipate that this product would be sold at a premium price due to its uniqueness and all-natural ingredients. This would mean that customers would likely need to earn above-median incomes in order to be in a position to buy a product such as this. Assumptions such as this might change as I progress through this business plan.

In three out of my four avatars, I made assumptions about the relationship status of these men. The demographics included were Now married, except separated, Never married, and Separated. These were my three main avatars.

Education

The fourth included Males, With earnings, and who were High school graduates. This is my “catch-all” avatar. The real total addressable market for my product is probably between this population and the total of the three mentioned above.

The main difference between the three main avatars had to do with education. I assumed that men who were single might be more likely than married men to purchase a product such as this, I lowered the EDUCATION ATTAINMENT to Some college or associate’s degree.

business plan demographics avatars

Defining a target market with business plan demographics

Be sure to download your own copy of the workbook used in this post. Just fill out the form at the top.

What other sources would you use to find demographic information for your business plan?

How about the avatars? How would you have screened them further?

Join the conversation on Twitter!

Periodic Sales Promotions in QuickBooks Online

weekly-monthly-holiday-sales-promotions-featured

  • Periodic sales promotions give small businesses the best chance of boosting sales and profitability when they are carefully planned.
  • Care must be taken to not use periodic sales promotions as a crutch when sales fall short of expectations.
  • QuickBooks Online price rules give small businesses the opportunity to efficiently apply promotional pricing to products and services.
  • Small business owners, who are concerned about what effects sale promotions might have on revenue, can use this information to lower uncertainty

Periodic sales promotions

Weekly/monthly/holiday sales, aka periodic sales promotions, are something we’re all familiar with. The “one day only sale!” The “Memorial Day sale!” The “semi-annual sale!” Or, the most famous, the “Black Friday sale!” are all examples.

Before we get too far into it, let’s split hairs on the terminology a bit. A periodic sales promotion shouldn’t be confused with a discount or a markdown. A discount is a reduction in price for a particular group of customers. A sales promotion, typically, would apply to all customers.

A markdown is a “permanent” lowering of the price of goods in order to incentivize purchase so that they can be removed from inventory. This would be done for items that are slow-moving (or not moving at all).

Periodic sales promotions are a means of reaching periodic sales goals

Periodic sales promotions can help complement the efforts of salespeople and advertising. Whether your business markets to consumers or other businesses, a periodic sale can stimulate buying on the part of your customers.

Periodic sales promotions should compel your customers to purchase immediately. So, the nature of your promotion will have to be such that it bridges your customers’ culture with your sales goals. For example, are you trying to get customers to switch from a competitor? Or, are you trying to penetrate a whole new market?

Don’t launch a periodic sales promotion without a plan. Consider how the promotion will impact your business at different volumes. Decide what products/services should be included. Consider your best-case and worst-case scenarios so that you are mentally prepared for whatever your customers throw at you.

The upside of periodic sales promotions

Dead and slow inventory takes up valuable space. Worse yet, it ties up valuable cash. If you have inventory that is turning over slowly, you might consider how you can work it into a periodic sales promotion in order to make room for inventory that will actually sell. Doing so would be preferable to getting pennies on the dollar by discounting.

I wouldn’t offer a sale that revolved solely around dead and slow inventory, however. That might be a dud. Perhaps you might consider marking down dead and slow inventory extra – beyond the normal terms of the promotion. An example for a car repair business – a 10% off sale on brake replacement for President’s Day, with slow-moving tires offered at 40% off. Take advantage of the increased traffic to get the most that you can for the dead and slow inventory.

A periodic sales promotion might incentivize people who wouldn’t buy otherwise. If the promotion only runs for a few days, the sense of urgency could be increased. People who may only have a vague idea of what your business is about could be compelled to “check you out” while the sale is going on. Furthermore, the first-timers, if they are excited about what they found, might tell others.

Since a periodic sales promotion will hopefully bring in a lot of new faces, it’s an opportunity to collect some basic information. Even just an email address or a like on Facebook. Knowing more about your customers in general and those that were lured by the sales promotion specifically will help you to meet their needs better.

The downside of periodic sales promotions

Even the least savvy business person knows that if you sell something for less, you’ll make less profit on it. Periodic sales promotions will result in lower margins. The hope is – to make up for that with increased volume (quantities).

But, if you are able to pull off a successful periodic sales promotion, be careful not to begin to rely upon them. The siren song of a boost in sales/gross profit might prove irresistible if future sales don’t reach the levels you hoped. If periodic sales promotions are part of your strategic planning, then great. Run with it. Just don’t start using them as a crutch if things aren’t going as well as hoped.

When a customer purchases something at a reduced price, you might not be able to get a read on their future purchasing behavior. That is, beyond the fact that they’ll buy “x” amount of something at “y” price.

We’ve all heard the old adage “price, service, quality…pick two” when it comes to offering a value proposition to customers. If your business aims to excel in service and quality, but begins to succumb to the temptation to lower prices to boost sales, then you might see yourself transformed into a low-price provider – at the expense of service or quality.

It always comes down to…planning

Again, at the risk of being redundant, it all comes down to planning. Give your periodic sales promotions the thought and planning they deserve. Don’t just “knee-jerk.” Working it into a plan will give it the best chance of being successful.

Every industry is different. Every small business within an industry is different. There is no “one size fits all” solution to planning for periodic sales promotions. Nevertheless, since this website is SpreadsheetsForBusiness.com, after all, I took a stab at it.

Download the periodic sales promotion planning tool.

Complete the form below and click Submit.
Upon email confirmation, the workbook will open in a new tab.

weekly-monthly-holiday-sales-promotions-tool-screenshot
Click to enlarge

This is a very high-level workbook since it isn’t specifically made for any particular business/industry. Hopefully, however, it can give you a starting point for thoughtfully planning your own periodic sales promotion. Helping to ensure that it fits in with your strategic plan and helps your business reach its goals.

Periodic discounts in QBO

How to apply this knowledge in your accounting software, though? Well, here’s how you might go about it in QuickBooks Online.

We’ll look at periodic sales three different ways through the eyes of a restaurant:

  • First, an across-the-board 10% discount for everything. We’ll call it an “anniversary sale.”
  • Second, a 20% off of Mexican food and drinks promotion for Cinco de Mayo.
  • Finally, a weekly 15% off promotion for select desserts.

If you haven’t, read my previous post on the particulars of QBO price rules (levels). What follows won’t necessarily go into as much detail.

I’ll be using the sample company within QuickBooks Online Accountant. By default, this sample company is a landscaping business. For the purposes of these examples, I’ll make some changes to make the examples better reflect a restaurant business. But, if you see some odd things related to landscaping pop up in the screenshots or the video – that’s why.

In the previous example, we created a “dummy” price rule that provided no discount. We did this so that the price rule would not be applied by default during a sales transaction. However, in this example, for our restaurant, we want it to be automatically applied so that we don’t forget to give it to our customers. So, in this case, we’ll forego the creation of a “no discount” price rule.

weekly-monthly-holiday-sales-price-rules
Click to enlarge

Anniversary promotion

The across-the-board 10% discount is easy to set up. In the price rules screen, we’ll create a rule called Anniversary Sale. This rule will only be in effect over the weekend of April 27, 2019.

Since it is an across-the-board discount, All customers and All products and services will remain selected by default. A 10% decrease in price will be applied.

Simple.

across-board-discount
Click to enlarge

Cinco de Mayo promotion

Next, we’ll look at the Cinco de Mayo promotion. In this case, it’s only our restaurant’s Mexican fare that’s on sale. Also, the sale only runs over the weekend – May 3, 2019, through May 5, 2019.

In this price rule, we selected the products in our Mexican subcategory. We then chose to decrease the price by 20%.

weekly-monthly-holiday-sales-promotions-cinco-de-mayo-discount
Click to enlarge

Weekly dessert promotion

Finally, we’ll tackle the restaurant’s weekly (Wednesday) discount on desserts, designed to get people in the seats during the slow mid-week time period.

This was approached in much the same manner as the Cinco de Mayo discount. Except, there is no Start date and no End date. This is an ongoing promotion. All products in the Desserts category were selected for inclusion and they were decreased in price by 15%.

dessert-discount
Click to enlarge

Periodic sales promotions

When it comes to pros & cons, advantages & disadvantages, upside & downside posts, I always overlook a few. What are some of the pros and cons I missed for weekly/monthly/holiday sales promotions?

What other considerations need to be taken into account before a small business launches a weekly/monthly/holiday sales promotion?

Join the conversation on Twitter!

QuickBooks Online Pricing – the Full Guide to Levels + Rules

quickbooks-online-price-levels-featured

  • To turn on price levels:
    • Gear (icon) > Accounts and Settings > Sales > Products and Services > Turn on price rules
  • To create price levels:
    • Sales (left menu) >Products and Services > More > Price rules
  • Price levels (levels) in QBO allow users to specify price changes for customers, products, or a combination of the two
    • Promotional pricing can help drive sales and profitability

What are QuickBooks Online price levels?

Price levels (rules) are used in QBO to quickly and easily give special pricing on particular items, and/or to particular clients. You can mix and match customers with products/services when setting up price levels. Also, you can broaden your selection to all products/services that fall within a particular category. For instance, maybe you want to only have a sale on installation and not physical products. Not every pricing rule has to be across the board.

Price levels can be set up to give a percentage discount, a fixed dollar amount discount, or… you can simply enter a custom price for a particular item.

Furthermore, if it makes sense in your pricing strategy, you can even increase prices. Plus, you can round to the nearest dollar, $.49, $.99, and many other amounts.

Finally, for each price rule, you can enter a Start date or End date to control when the rule is applied. Beyond that, QuickBooks Online gives you the ability to easily activate and inactivate a particular price rule after it’s created. Therefore, you can create price levels now, and put them into effect as needed.

Why use price levels in QuickBooks Online?

Promotional pricing is a valuable tool when used wisely. It can help small businesses drive sales and profitability. It might even be a coordinated part of your strategic plan.

Whether it is a periodic/seasonal sale, coupons, a referral program, a customer loyalty program, or a volume discount – there are plenty of reasons that you would want the ability to easily applying special pricing for specific customers and products/services.

Does your small business have sales promotions? Of course it does. Read this post:
PERIODIC SALES PROMOTIONS IN QUICKBOOKS ONLINE

How to implement QuickBooks Online price levels

First things first, in order to use price levels in QBO, you’ve got to turn them on. By default, they’re turned off. The option to create a price rule won’t be available if they aren’t turned on first.

By the way, in my walkthrough here, I’ll be using the QuickBooks Accountant sample company. The sample company is a landscaping business.

Go to the gear in the upper right corner and select Account and Settings.

Once in the Account and Settings menu select Sales. Under the Products and Services section, you’ll see Turn on price rules (beta). Click on that and the checkbox. Then click Save and Done in the bottom right-hand corner of the screen. Price levels are now turned on.

quickbooks-online-price-levels-turn-on-rules

Creating a price rule

Now, that price levels are turned on, you can create one. Go to the Sales section on the left (main) menu and select Products and Services. Alternatively, you can go directly to Products and Services from the gear in the upper right-hand corner.

Once in the Products and Services screen, click on the More drop-down menu in the upper right-hand corner and select Price rules. If this is your first rule, you’ll see the little intro graphic and text. Click the Create a rule button.

more-rules

Each price rule in QuickBooks Online will need a name. A rule name should be succinct, yet detailed enough for you to understand what changes it will make when it’s applied.

quickbooks-online-price-levels-enter-rules

As mentioned, you can make effective dates (Start date and End date), if you’d like to limit the time window in which this price rule will be in effect.

Next, you’ll decide whether you want this rule to affect all customers or just specific customers. And, you’ll decide if you want it to affect all products and services, categories of products and services, or individual products and services.

After that, you’ll specify what degree you want the rule to adjust the price. You can choose to adjust the price by a percentage, a fixed amount, or you can enter a custom price. Beyond that, you can specify if you want the price adjusted up or down. Price levels aren’t just for markdowns!

Do you know who your most profitable customers are? Read this post:
QUICK & EASY TOOL FOR MEASURING CUSTOMER PROFITABILITY

Finally, you’re given the option of having your price rule rounded to a specified amount. $.05, $.50, $.88, and so on…

That’s it! Those are the only variables to enter when making a price rule. You’ll see in the table at the bottom after you click Apply, the original price (Sales price) and the Adjusted price. The Adjusted price reflects the effects of the price rule you just created. Review those changes to make sure there are no surprises. Then click Save and close at the bottom.

quickbooks-online-price-levels-adjusted

Using a price rule in a transaction

In order to use a price rule, you’ll have to apply it to an individual sales transaction. So, for example, if we click on Sales in the left menu. Then, click on All sales on the top menu. Finally, click on the New transaction drop-down and select Sales receipt.

In this example, I’m just using a Sales Receipt for illustrative purposes. Pricing levels can be used in Invoices, Estimates, Sales Receipts, Credit Memos, and Delayed Charges.

sales-receipt

Populate all of the customer information at the top. Select the Product/Service at the bottom. Click the Rate drop-down box and you’ll find the price rule you just created available as an option. Select the rule and you should see the Subtotal on the Sales Receipt change accordingly.

Making a lot of sales doesn’t mean anything if you don’t collect cash. Read this post:
13 TECHNIQUES TO IMPROVE THE MANAGEMENT OF YOUR CASH FLOW

QuickBooks Online does support price levels

In the next post, I’ll explore different types of promotions that small businesses, like yours, can run, and how to create corresponding price levels in QBO.

What other types of variables would you like to see added to QBO price levels, so that they could suit your business better?

Join the conversation on Twitter!