Market Size for a Business Plan – 2 Methods to Gauge It

market size for a business plan featured

In order to estimate how much in sales your startup can hope for, you’re going to have to estimate the market size for your product/service(s). This is critical for your startup because it will give you an idea of your business’ potential. It will also help you plan for capacity-related issues.

2 approaches to estimating the market size for a business plan

I cover this topic more in-depth in a post on market size and growth rate on my sister site, InvestSomeMoney.com.

The context there is focused on investing your money in a publicly-traded company. Though that’s a little different than what we are doing here, the fundamental principles remain the same.

The goal is to determine how many potential customers there are for a business and how much they are willing to spend. In order to do that, we can employ two general methods. These methods are a top-down analysis and a bottom-up approach to understand market size and growth.

One way to think about this is that a bottom-up approach uses multiplication and a top-down analysis uses division to arrive at an estimated market size.

After writing on this subject several times, I’ve come up with another way to think about these methods. I think a bottom-up approach should look internally, at things like unit size and capacity. A top-down analysis should look externally at things like demographics and market research.

Looking at this from these two different perspectives opens the door for further analysis. When you’re done, you should know whether you can expect to be capacity constrained or demand constrained. You’ll also start to flesh out some ideas that will help you further into your business plan.

If you do an analysis with both approaches, you can compare the results. For instance, if your bottom-up approach is higher, you’ll know that you could have excess capacity issues. You need to consider scaling that back or otherwise expanding your product/service offering to drum up additional demand.

Conversely, if your top-down analysis reveals that demand is in excess of capacity, then you are leaving money on the table. Time to start thinking about what you can do to scale up and capture as much of the market as possible.

Let’s start by taking a look at a bottom-up approach to estimating the market size for a business plan.

Bottom-up approach example

On my sister site, InvestSomeMoney.com, I researched three real-life examples of a bottom up market sizing approach. In those examples, you’ll see that they sometimes mix in a little top-down analysis with their bottom-up approach and vice versa. There’s no rule against doing that, but I would rather look at things from two totally different perspectives.

When using a bottom-up approach, try to start with the most simplistic piece of firm information you can get your hands on. Then, start to build on it with other information, or the best guess you can muster.

You can think of a bottom-up approach as one that focuses on how much and how often customers will buy.

This information might be something you have internally. Or, it might be from the information you found by researching online. Start with a single “serving size” of your product/service. Then, think about how often a customer would buy. Work your way up from there.

A bottom-up approach for my business plan

As mentioned in earlier posts about business plans – I’m building one as I write these. My theoretical product is an all-natural topical hair loss treatment.

In the post linked above, I performed something of a top-down analysis of market size for a business plan. I later discovered that I was operating with incomplete information.

There’s still a lot to consider regarding packaging volume and dosage. That will require more thought. But, for the time being, I’m going to estimate the volume of a one month’s supply and the daily dosage to be the same as Rogaine. If that changes as I progress with my business plan, I can easily circle back to this and plug in different numbers.

With Rogaine as my benchmark, I know that a dosage of my product would be 1 mL. The product would be used twice a day. My product would come in 2 oz (60 ml) bottles. Each bottle would be one month’s supply, as I said.

Thinking about capacity

Okay. Now that I have a grasp on the package size – what about blending and packaging? If this idea were to come to fruition, I don’t picture myself blending batches in my bathtub and filling bottles with a ladle and a funnel. I would need access to some sort of industrial equipment.

Fortunately, a quick internet search shows that there is no shortage of contract blenders and packagers out there. Especially for food and supplements. What it costs, remains to be seen. That’s an issue for another time. For now, I just want to get an idea of how much I could manufacture.

This company claims it can blend 1.25 million pounds per workday. We’ll assume, for now, this represents the average contract blender/packager. What does that translate into in terms of 2 oz bottles?

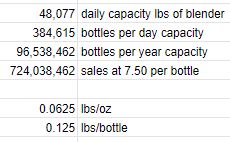
First of all, I wouldn’t need all 26 of their kettles. Only one, tops, especially at startup. So, if we divide the 1.25 million pounds by 26, we get a per kettle capacity of about 48,000 lbs per day.

Pounds are a weight unit of measure (UOM) and ounces are a volume UOM. To make the conversion, we’re going to have to do some more estimating.

Water weighs a little over 8 lbs/gallon. We’ll assume my product has roughly the same density.

8 lbs ÷ 128 oz (per gallon) = .0625 lbs/oz. With each bottle containing 2 oz, we know that it’ll weigh approximately .125 lbs/bottle.

This means that with one of this company’s kettles, I could blend 384,615 bottles worth of product per day. 96.5 million bottles per year. At an approximate sales price of $7.50 per bottle, that translates into nearly $725 million in revenue per year.

Okay, I’ve looked at things from a bottom-up, capacity-focused approach. Let’s now consider a top-down, demographic-focused analysis.

Market Size for a Business Plan capacity

Top-down analysis

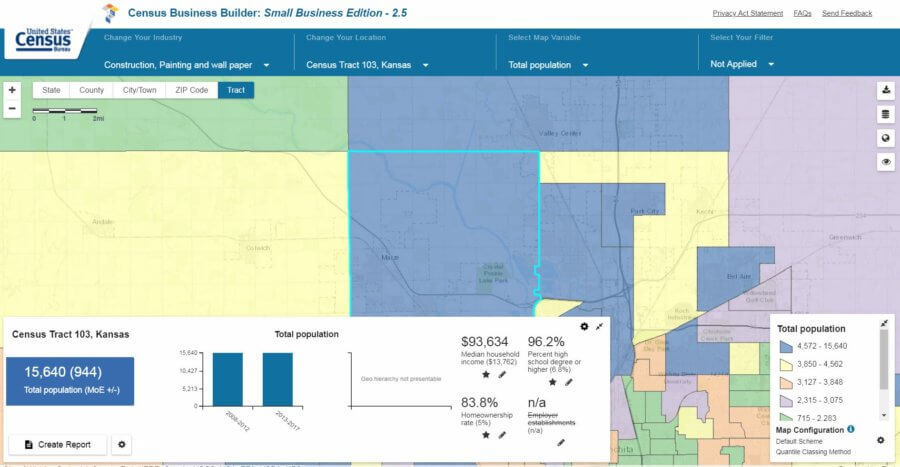
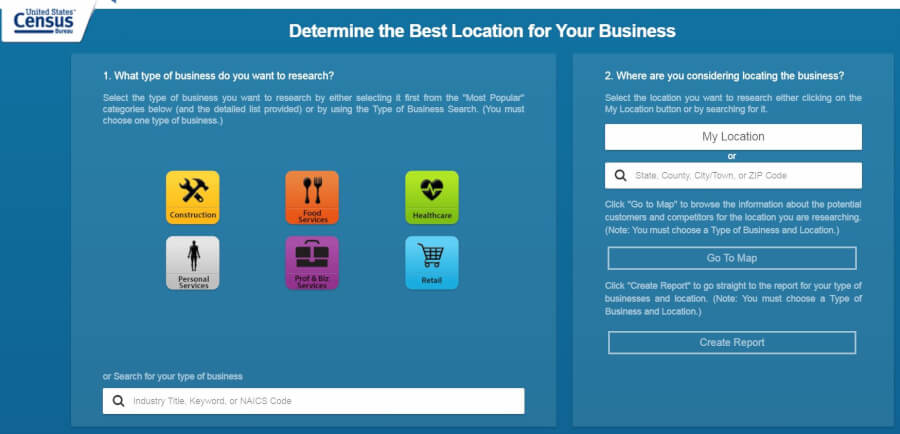
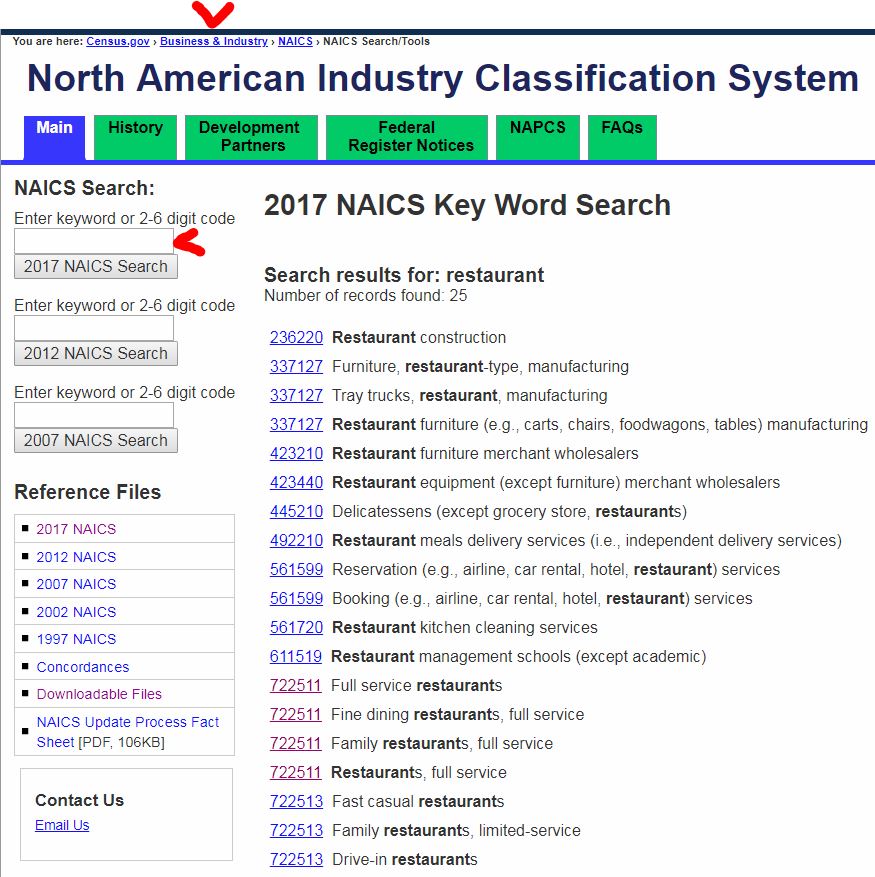
Not surprisingly, I also wrote a post on InvestSomeMoney.com with examples of a top-down analysis to determine market size for a business plan. When you read through it, you might notice that some of the examples use Census data (or something similar). They take big chunks of information and start narrowing down their market from there.

Which brings us to three important terms for performing a top-down analysis. These are:

Total addressable market (TAM)
Serviceable available market (SAM)
and
Serviceable obtainable market (SOM)

A SOM is a fraction of the SAM. In turn, a SAM is part of the TAM.

The TAM can be thought of as every potential customer that you can reach geographically. The SAM is what’s left when you niche down a little into the population that is a good fit for your unique selling proposition. Finally, the SOM represents the percentage of the SAM you can realistically expect to take.

It’s unlikely that you will ever capture 100% of the SAM. Even in a specific niche, you can’t be everything to everyone. That’s alright, though. The goal of this exercise is to make realistic estimates so that you have a sound business plan to work from.

When doing a top-down analysis, start with a large population or an overall industry size. From there, narrow down your customer until you arrive at your SOM. It helps to have a “customer avatar” in mind before starting a top-down analysis so you know where to niche down to.

I would suggest you perform a business plan demand analysis first to get a crystal clear picture of what that avatar is. You might think you know it intuitively. But you might be surprised at what you find – like I was!

A top-down analysis for my business plan

I know that not every person in the U.S. (much less the world) is going to want or need an all-natural topical supplement for hair loss. Who might though???

I’ll refer back to my handy-dandy business plan demand analysis (linked above) to see what I can find.

Here, I’m reminded of the ages that men and women first started experiencing hair loss. I’m reminded of the percentage that has sought any sort of treatment. Finally, I’m given an idea of what types of treatment they have tried.

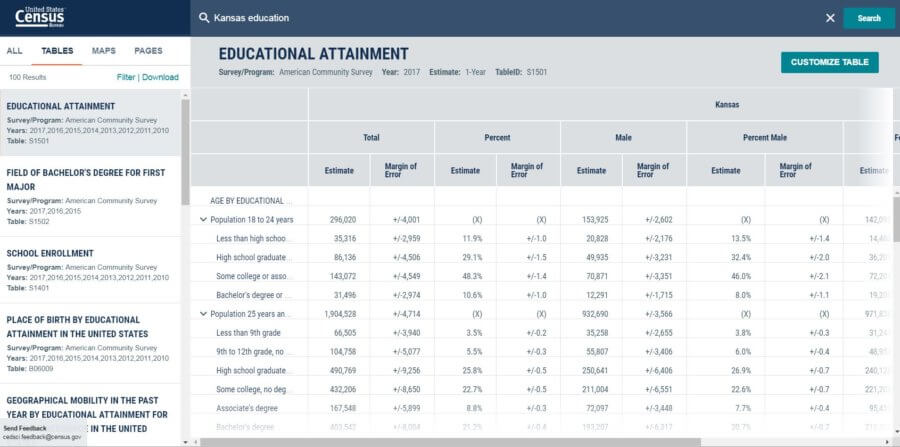
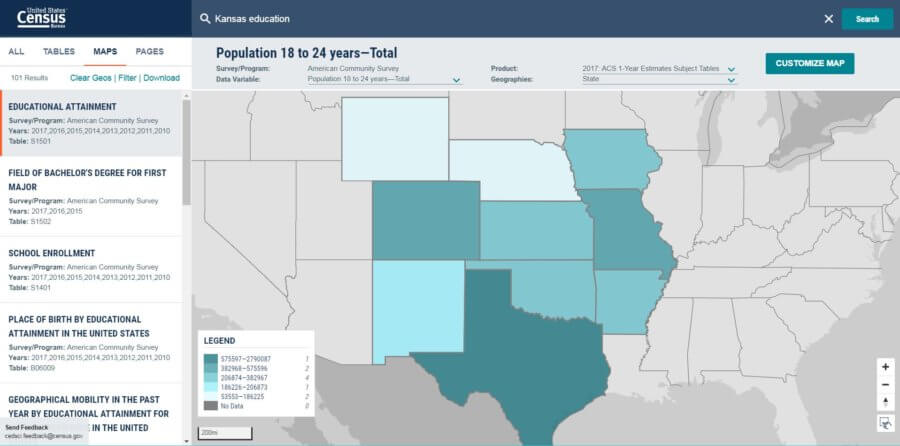
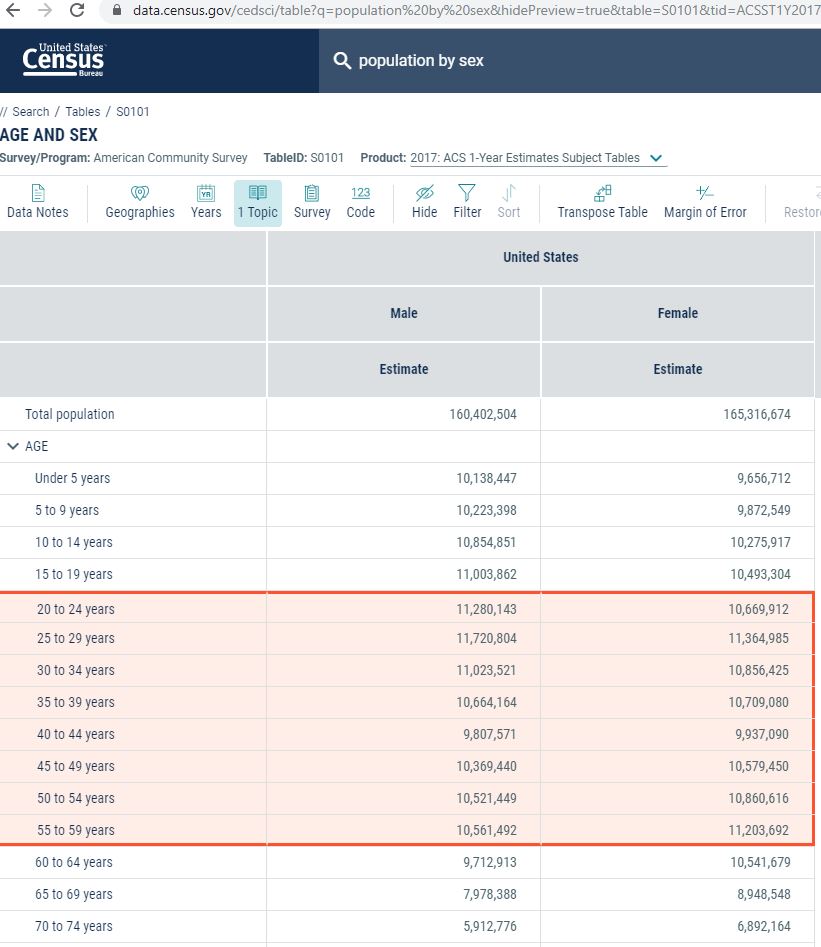
A quick visit to Data.Census.Gov and I find table S0101, which gives me the U.S. population by age and sex. I customize and filter the table real quick. Then, I copy and paste the data I need into my spreadsheet.

Market Size for a Business Plan data census gov

Next step is to narrow these numbers down. I’ll use the “regular” numbers and the pessimistic numbers from sensitivity analysis from my business plan demand workbook.

I want to know the percentage of men who have had hair loss and tried any sort of treatment. Then, I want to go deeper and estimate the number that has found supplements to be effective. I’ll do this for both the most-likely and the worst-case scenarios. On the women’s side, I’ll do, more or less, the same thing.

TAM and SAM

You’ll see that I didn’t use the same age ranges for men and women. I assumed that males would start experiencing hair loss earlier, but would also stop caring about it earlier too.

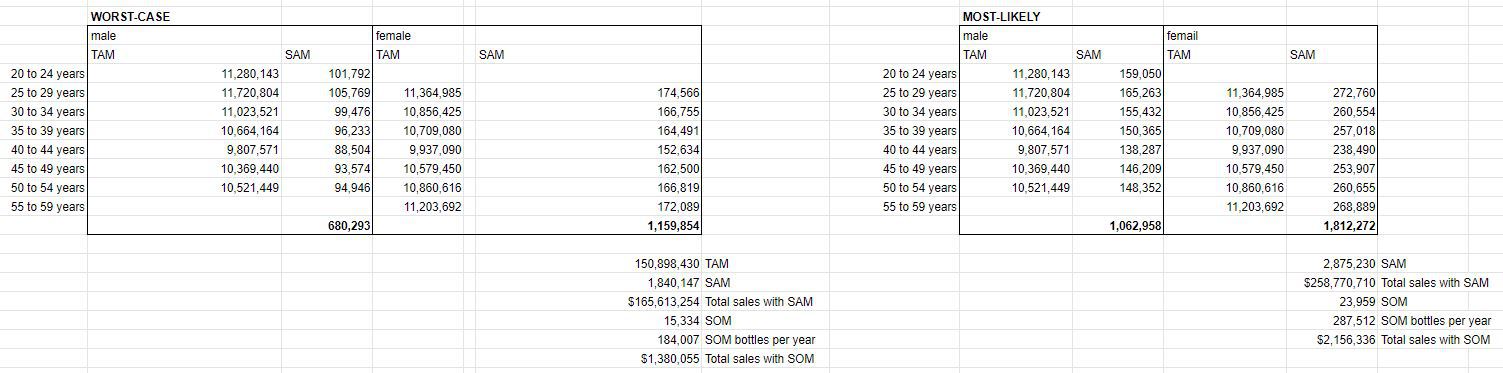
The age range for males in my TAM was 20 – 54. For females, it was 25 – 59. This translates into a TAM of 151 million people in the U.S.

For the SAM, my worst-case scenario estimated that .9% of the male population in the target age ranges would be part of my market. 1.54% of females in the target age ranges were also assumed to be part of my market. This translated into a worst-case SAM of 1.8 million people.

As for my most-likely SAM, I estimated that 1.41% of males and 2.4% of females in the target age ranges were potential customers. This resulted in a SAM of 2.88 million people. Over a million more potential customers.

SOM

SOM is tricky.

Who’s to say what percentage of the SAM my company could capture? Obviously, it would start at 0% and work its way up from there. Where would it stop though?

It will depend, in part, on the number of companies vying for this niche. As I often do, I will refer to the Pareto principle. The Pareto principle states that 20% of the inputs will be responsible for 80% of the outputs. Put another way, 20% of the companies will have roughly 80% of the market share.

I’ll refer back, again, to my post on business plan demand. In it, I found three direct substitutions for my topical hair loss product. I won’t include Minoxidil (Rogaine) in that group, because of its unnatural chemistry.

Again, without getting too mired in math, I estimate that there are approximately thirty companies in the topical hair loss supplement space. This was a quick and dirty estimate based on the results of an internet search.

Six of those thirty companies probably control 80% of the market. That leaves 4.2% (1 ÷ 24) of the remaining 20% as my short-term SOM. Obviously, if my product were to take off, that amount could grow considerably and could approach the SAM.

What that means as far as the market size is 15K people worst-case and 24K people most-likely. At 12 bottles purchased per year, this translates into 184K and 287.5K bottles per year respectively.

Here’s a look at the spreadsheet breaking that all down:

Market Size for a Business Plan top down
Click to enlarge

Comparing a bottom-up and top-down analysis when determining market size for a business plan

Obviously, a couple hundred thousand bottles (top-down) is a far cry from 96.5 million (bottom-up). So, it would appear I will not be capacity constrained in the near future. In fact, as this startup moves forward, I need to make sure I’m not over-buying capacity. Those huge fixed costs could kill my business before it has a chance to get off the ground.

Speaking of fixed costs, the information from this analysis has given me good data to build my pro forma financials – when that time comes.

Now, at some point in the future, selling my product internationally could be an option. However, in this tiny niche, it is unlikely that I’ll ever need that much capacity for this one product.

Market size for a business plan

What were there factors I didn’t consider (but should have) when estimating my potential market size?

How might you have approached this differently?

Join the conversation on Twitter!

Census Data Market Research at the New Data.Census.Gov

census data market research featured

In an effort to modernize, the Census Bureau recently launched its new portal for census data market research. It is located at Data.Census.Gov. Here, you can find information on a bevy of subjects including population, economics, education, business, and many other topics.

Market research is important to know who your customers are and where they are at. No other free resource (that I know of) has the breadth of information that the Census does. It is your ticket, as a small business owner, to better understanding your customers and your environment.

What is Data.Census.Gov?

This tool is part of the Census website. It has an enormous amount of demographic, economic, and geographic data. If you could use only one source of information in your market research, this might very well be it.

The main portal for accessing Census data used to be the American FactFinder. In July of 2019, the Census began using Data.Census.Gov as its primary means of providing Census data.

The user experience is much more polished on Data.Census.Gov than it was on the American FactFinder. It seems to have been built with the general public more in mind the data-centric business users.

Why use Data.Census.Gov?

It’s unlikely there isn’t something here that could help you. A better understanding of your environment will help you make better decisions. Also, avoid potentially disastrous mistakes.

Most people think of the Census of only having data on population and demographics. In fact, the Census has a lot more. You can find data on health, housing, business/trade, employment, and more.

So, whether your business is retail, manufacturing, B2C, or B2B, you’re likely to find insights here that you would not have otherwise known.

How to access census data market research?

With the American FactFinder, there were four ways to conduct a search: Community Facts, Guided Search, Advanced Search, and the Download Center.

At Census.Data.Gov you are presented with two options. A search bar at the top, and “canned “searches at the bottom.

Start your search with whatever’s most important to you. If it’s a geographic area, start with that. If it’s related to employment, population, or some other topic, start with that.

At any time, if you want to start over, click on the United States Census Bureau button in the upper left. That will take you back to the home page to start a new search.

A solely geographic search

A geographic search will bring up a screen full of “quick facts” about that area. To access this information you need to select the geographic area you want from the drop-down menu that appears as you enter your query. Don’t just type it and click Enter.

The “quick facts” include things like People and Population, Race and Ethnicity, Families and Living Arrangements, among other topics. Basically, the same topics outlined in the “canned” searches at the bottom of the home page.

A topic-based search

A search that includes a topic such as health insurance or housing will give you a results page that includes TABLES, MAPS, and PAGES related to your query. By clicking on the corresponding result-type along the top of the page, you’ll be taken to results that are exclusively that type.

Tables

census data market research tables
Credit: data.census.gov

TABLES are the bread and butter of the data-centric user. Upon clicking on the TABLES option, you’ll see a list of tables in the left-hand menu that corresponds with your query.

Once you find the table you’re interested in delving into, click the Customize Table button. It’s in the upper-right.

Now, you can expand and collapse rows so you can only see the data you’re interested in.

When you’re ready to get this information into a spreadsheet, click the chevron (two arrows pointing up) by the title of the table. Select Download/Print/Share. Next, you’ll select the years you want information for and click Download when you’re ready.

Unfortunately, the downloaded data sucks. As I also outlined in the Defining a Target Market… post. It’s difficult to read and can’t easily be put into a format that facilitates understanding. It can’t be copied and pasted into a spreadsheet easily. The American FactFinder site did allow for easy copying and pasting..

Also, if you’d like to add or remove other geographic areas, or the year of the data, click CHANGE GEOGRAPHY or CHANGE YEAR respectively.

Also using the Filter with the tables will allow you to use similar functionality as the Advanced Search option. The Advanced Search will be covered later.

Once you’re satisfied, you can click TABLES in the upper left corner to return to the main tables page.

Maps

census data market research map
Credit: data.census.gov

The map and table are tied together. The changes you make in one will bleed over into the other. For instance, if you choose a different Geography in the map, your table will change accordingly.

Along the top, you can also change the Data Variable. These options correspond with the rows in your table.

Geographies will change color according to the data variable. In the lower-left, you’ll see a legend that shows the amounts and quantity of Geographies in each quintile.

You also have the option to click on surrounding Geographies (states, counties, etc.). When you do, they’ll be added to your analysis.

Filters

In the tables, maps, and the Advanced Search, you can narrow down the results by adding Filters. The Filters are pretty intuitive. Select those that you want to use and the data will be updated accordingly. If a Filter isn’t available, it will be greyed out.

Census data market research

What other tips and tricks do you have for finding the data your business needs with Data.Census.Gov?

Do you know of a better way to get information from the tables into spreadsheets?

Join the conversation on Twitter!

Using Census Data for Business – Find the Perfect Location

using census data for business featured

The Census Business Builder is an interactive tool that allows small business owners to make educated decisions about the location of their businesses. Of course, the location of a business can be an enormous factor in determining whether it is successful or a failure.

Click here to try the Census Business Builder for yourself.

What is the Census Business Builder?

This is a “wizard,” of sorts, for small businesses to use to find an ideal location. Information is presented in a map or report format.

Go To Map

The map is, as you would expect, very visual. It allows you to view the information by state, county, city, and zip code. Different sections of the map are color-coded depending on the variable selected.

using census data for business census map
Credit: census.gov

Variables include, but aren’t limited to the following:

  • Demographic information
    • Age
    • Income
    • Education
  • Business & workforce information
  • Consumer spending

Beyond that, you can filter any of the variables to reduce the “clutter” on your map. Then you can focus on the information you’re really interested in.

Create Report

Whereas the map allows you to customize what you see, the report gives you a rundown of the information it thinks you want.

There are three main sections of the report. They are listed below along with their sub-sections.

  • My potential customers
    • Demographics
    • Socioeconomic characteristics
    • Housing
  • Businesses like mine (based on the NAICS code)
    • Employer businesses
    • Business revenue
    • Nonemployer businesses
    • International trade
    • Workforce
  • Consumer spending

Not all the Businesses like mine information is always going to populate for a given geography. The more pinpoint the geography (Census tract, ZIP code) the more likely that information will be omitted. I assume this is done to protect privacy.

This resource is a tool for finding information about different industries. Information is available from the neighborhood level up to the national level. The information is presented in a more visual format; whereas a lot of other Census data is in tables.

Why should I use the Census Business Builder?

Because it is map-based, the primary purpose of this tool seems to be to find a good location for your business. Thus, it might prove more beneficial for retail or business-to-consumer (B2C) businesses than other types.

That being said, there are business-related variables and filters too. So, you might find information for business-to-business applications too.

If you have a good grasp on your “customer avatar,” and you are looking for the ideal place to locate your business, then the Census Business Builder could help you avoid costly mistakes and give your retail business the best chance at success.

Gathering and acting on market research takes scarce resources like time and money. You want to know that those resources are well spent.

market research data sources census business builder
Credit: census.gov

How to use the Census Business Builder

Using the Census Business Builder is relatively easy and surprisingly intuitive for a government website.

The first step is to select your industry, or manually type it in.

When browsing the map, I couldn’t ascertain what difference it made to select one industry over another. I think this only affects what you will see in the report.

From there you’ll select the location you want to analyze and then Go To Map or Create Report.

Using census data for business – the Census Business Builder map

The map will allow you to move around and see a visual representation of your location, the selected variable, and the selected filters. If you’re viewing data by city, then each city will be color-coded based on which quartile it’s in. If you Change your location to a ZIP code, state, or something else, the map will change accordingly.

Changing the Map Variable is going to affect what you see on represented on the map. Note that you can scroll down on the Map Variables. So, if you don’t see what you want at first glance, there are more options below that.

Your filter options are the same as the Map Variables. By choosing a filter, you’ll be able to exclude geographic areas from your map that don’t meet certain criteria. You’ll set a minimum and maximum for the filter and then select Apply Filter. Your map will update accordingly.

Remember, that like the Map Variables, you can scroll down to find more options for your filter. Apply up to five filters.

At any time, in the map view, you can create a report based on the industry and location selected. Just click Create Report in the lower-left corner.

Using census data for business – the Census Business Builder report

The report will provide a nice summary of the location selected. Included will be every piece of data available in the map, in a presentable format. Ready to be copied and pasted into your business plan, if desired.

using census data for business census report
Click to enlarge
Credit: census.gov

Obviously, the report is less interactive than the map. There are some adjustments that can be made, though. Along the top, you see the option to Display MOEs (margin of errors), Configure Contents, and Download Data.

The MOE information probably won’t mean much to the average small business owner. But, if you’re curious, it simply means that the data isn’t exact and could actually be higher or lower by the MOE amount. For instance, let’s say the Percent high school degree or higher is 90% and the MOE is 1%. Then, the actual Percent high school degree or higher is anywhere from 89% to 91%.

The option to Configure Contents allows you to remove sections of the report that might not be relevant.

Finally, the Download Data option allows you to create a spreadsheet or a PDF with the information in the report. From there you can perform your own analysis, copy to a business plan, or whatever else you wish.

Using Census data for business – a valuable tool

What are some “hidden” treasures in the Census Business Builder map that I missed? Is there a combination of variables and filters that provide especially useful information?

Join the conversation on Twitter!

NAICS for Market Research – A Classification of Businesses

naics for market research featured

NAICS codes can be used to perform market research on businesses. The information you gather from NAICS market research will help you, as a small business owner, to make confident decisions in targeting customers.

Here’s a link to the NAICS section of the United State Census website.

*By the way, if you’re looking for the actual NAICS code for Marketing Research and Public Opinion Polling – it’s 541910.

What is a NAICS code?

NAICS stands for North American Industry Classification System. NAICS codes consist of between two and six digits. This code is used to classify businesses by activity (what products or services it provides).

Note that the first two letters of NAICS stand for “North American.” This means that NAICS codes are also used by our neighbors to the North and South – Canada and Mexico. The NAICS has, in large part, replaced the Standard Industrial Classification (SIC) system. You might remember SIC codes if you attended business school anytime prior to the year 2000.

The first two digits of a NAICS code represent the sector of the business. The third is for the subsector. The fourth is the industry group. Finally, the fifth and sixth represent the NAICS industry and national industry respectively (Source).

Any business might have more than one NAICS code. In fact, each location is given its own NAICS code.

Why NAICS is important

The NAICS exists to efficiently compile, create, and analyze business data. Data that is collected includes employment, revenue, and inventory; among many other things.

Since this much of this data is made public by the Census Bureau, you have the ability to use the NAICS for market research. Particularly if your business currently does, or plans to market to other businesses.

Beyond market research, NAICS codes can also help your business generate leads. In order to get the contact information, you’ll probably have to purchase it from a 3rd party vendor.

How to use the NAICS for market research

The first step to utilizing NAICS is to know the code you want information on. From the NAICS website, you can search by keyword on the left-hand side of the page. Searches can be performed on current or historical NAICS information.

The search should return codes that will link to a list of example businesses. This helps you be sure that you have precisely the right code.

naics for market research site
Credit: census.gov

Industry Statistics Portal results

Once you know the NAICS code you want to research, click on this link to be taken to the Industry Statistics Portal. After entering your code, you’ll be given links to related data sources.

Most searches will return you to to the same four results: County Business Patterns (CBP), Statistics of U.S. Businesses (SUSB), Economic Census (ECN), and Survey of Business Owners (SBO).

The CBP includes annual reports with information on the subnational level. Employment, number of establishments, and payroll data are included.

The SUSB pulls data from the Census Bureau. Most of which is in Excel format.

The ECN includes data on people, places, and businesses. Most of this data is from the Census Bureau FactFinder. If you’re technologically sophisticated, you can also pull data via an API.

Finally, the SBO can also be accessed via an API. Beyond that many of the links also end up at the Census Bureau FactFinder.

There’s a link in the lower left-hand corner of the page to Selected Visualizations. From what I saw, this was potentially interesting information about the industry in question. Furthermore, it would allow you to drill down to the state level. But, unfortunately, as of this writing, it’s a dead link.

I sent an email to let them know about it and to see when it would be working again. No response as of yet…

Market research with a NAICS code

What are some other circumstances where you would use the NAICS for market research?

Are there other marketing opportunities with NAICS codes besides lead generation?

Join the conversation on Twitter!