You know that market research is important. It helps you to better understand your customers and your environment. Are the market research data sources you’re using painting a complete picture?
Do you have unanswered questions? Or, perhaps, you’re missing things that you didn’t even know would affect your small business.
Complete the picture of your market research by checking out the valuable information available for free from these government resources.
1. Statistical Abstract of the United States – A summary of…everything
The Statistical Abstract of the United States was a yearly document published by the Census Bureau. This tool for market research was a summary of the most important statistical information collected by the government. A really great reference that died in 2012.
Credit: census.gov
The entire document, itself, is a beast, at over 900 pages. Alternatively, if you want market research piecemeal, you can browse information by topic and download relevant spreadsheets. 2011 is when the spreadsheets were last updated. To get more timely information, you’ll probably have to reference what agency the data was compiled from.
The Statistical Abstract of the United States is a neat concept. But, as of the time of this writing (2019), the information is pretty dated. Like the USA.gov website, it can serve as a starting point to ultimately find the market research data you need. Like an old-fashioned card catalog.
2. American FactFinder – the (former) granddaddy of all demographic information
This tool is part of the Census website. It has an enormous amount of demographic, economic, and geographic statistics. If you could use only one source of information in your market research, this might very well be it.
In July of 2019, the Census Bureau transitioned to Data.Census.Gov as its main portal for public access to information. The American FactFinder (for now) can still be relied upon to provide valuable, timely info for market research.
Because of the breadth of information available, it’s unlikely that there isn’t something here that could help you with your market research project. A better understanding of your customers and your business environment will help you make better decisions. Not to mention, avoid potentially disastrous mistakes.
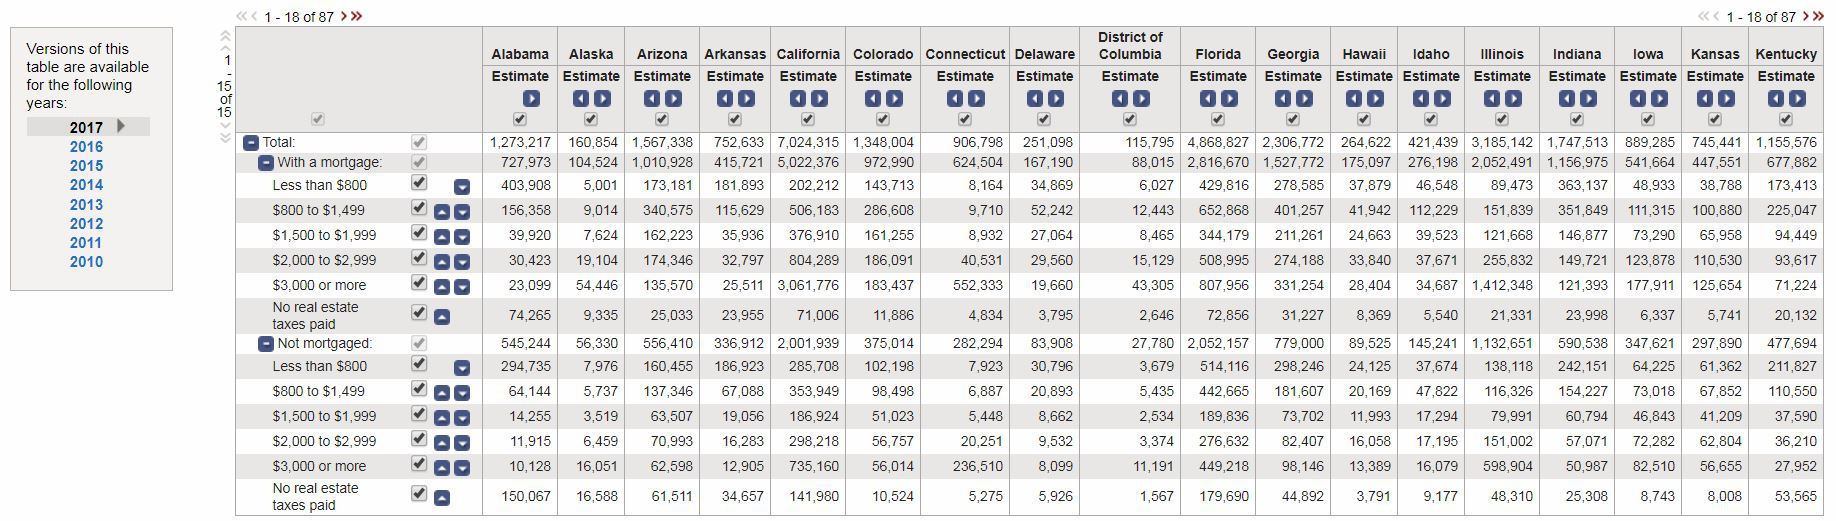
The American FactFinder tool is basically a guide to the relevant Census tables that have the market research you need. You pick topics that are of interest to you. The American FactFinder will return the tables that contain pertinent information. From there, you can view or download the information.
There are three primary ways to find what you need.
First is the Community Facts. Here, you can find some high-level information along with some links to tables related to various topics
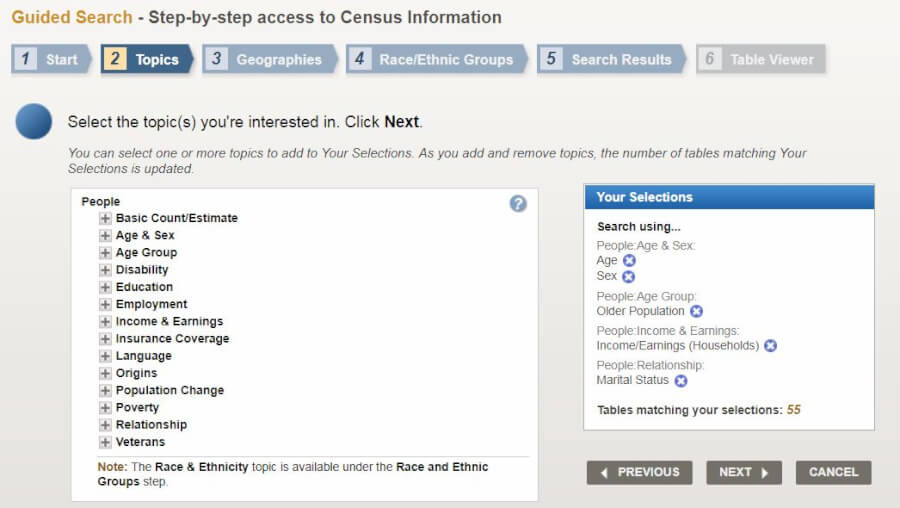
The Guided search walks you through a series of questions and then presents you with tables that match the criteria you set forth.
Finally, my favorite method to use is the Advanced search. Here, you select your Topics individually. The relevant tables are presented as search results.
Click to enlarge
Credit: factfinder.census.gov
No matter what method you choose, all paths lead to the Table viewer. It’s here that you can add and remove information and format it as you see fit. It’s also here that you can download into a spreadsheet for further analysis, if you wish.
3. Federal Reserve Consumer Credit Data – American consumer and student debt
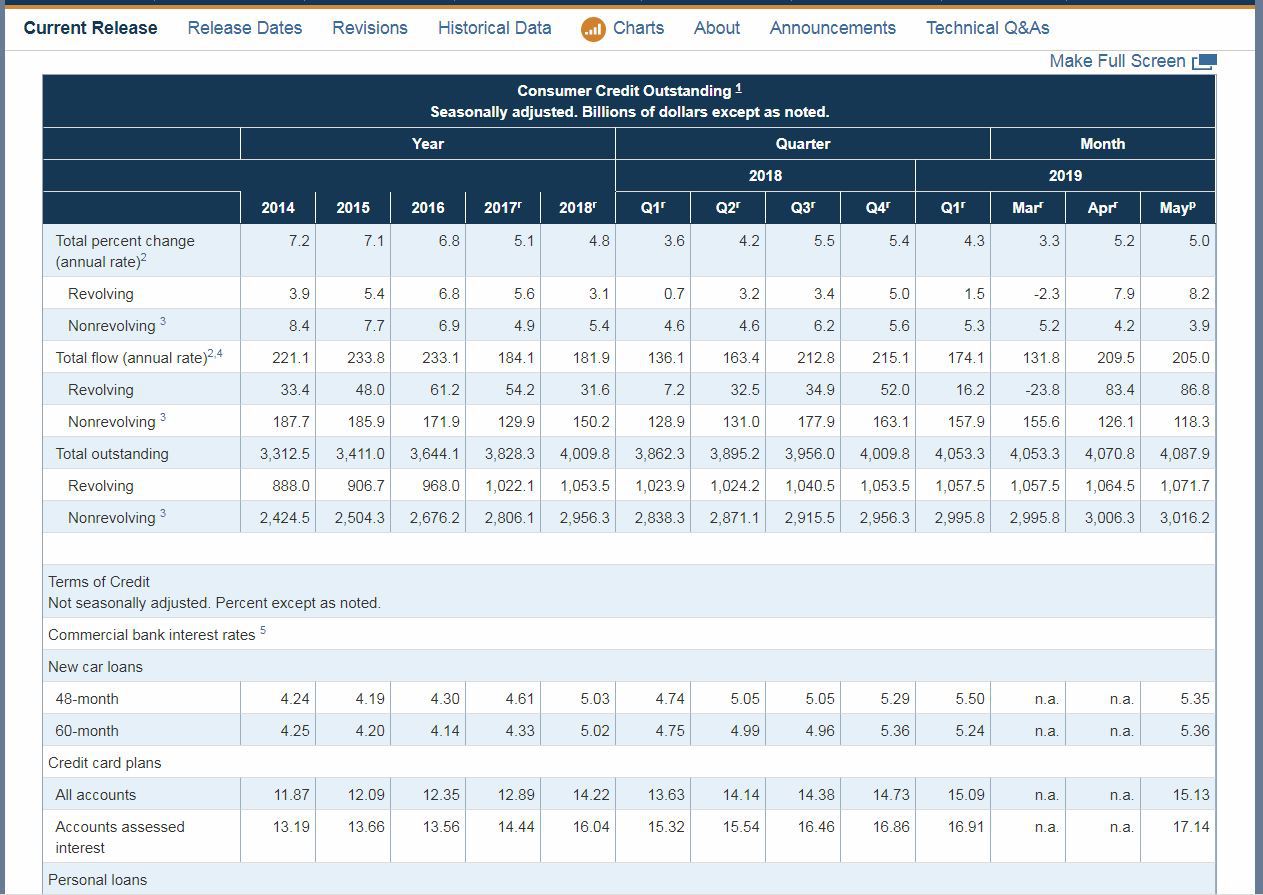
For better or worse, Americans like to borrow money to purchase things. Things that don’t (typically) give them much of a return on investment. The Consumer Credit Data (G.19) report has statistics on the amount of credit extended to the public – real estate excluded.
This report is relatively small. Especially when compared to other government market research sources. Yes, I know the Fed isn’t technically part of the government.
First of all, information is broken up into sections that are Seasonally adjusted and Not seasonally adjusted.
The information about who holds the debt (Depository institutions, Finance companies, etc.) probably won’t interest you much. The levels and flows of revolving (credit card), nonrevolving (student and car loans) might interest you, as a business owner.
It’s a highly technical report. Probably not something you would reference unless you had a business that was sensitive to consumer debt levels.
So, for instance, if you have a business that was very un-recession proof, then this is something you might keep an eye on. Because once debt (fixed costs) start to balloon to unsustainable levels, it could be your businesses such as yours that suffer first.
In cases such as that, you might cross-reference another source of market research. One that would give you corresponding information on disposable income.
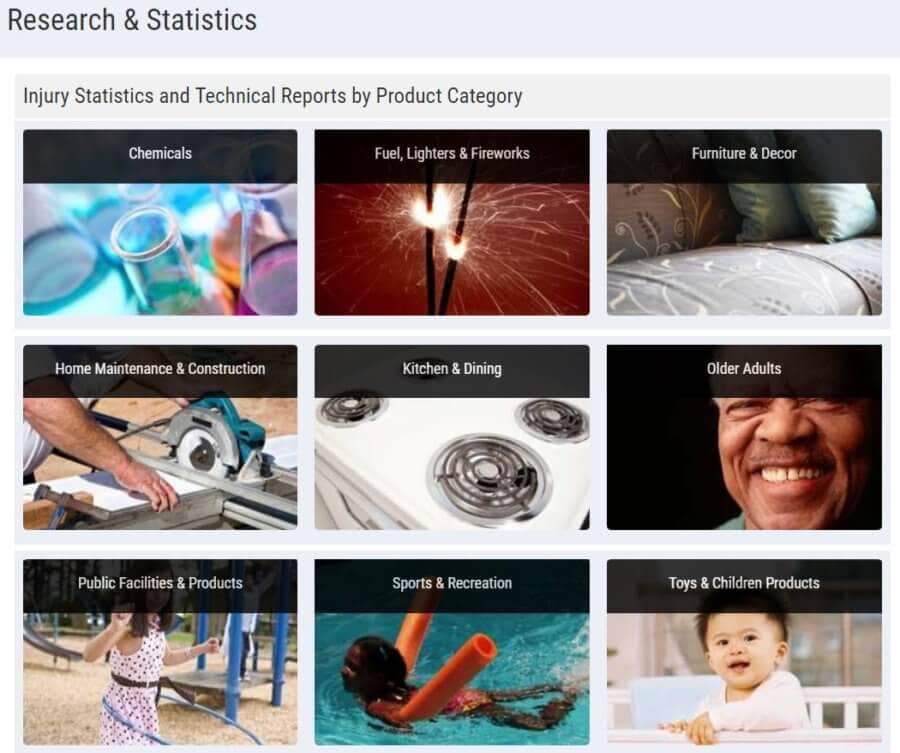
The Consumer Product Safety Commission publishes information aimed at decreasing injuries and death from consumer products. They also have the authority to implement standards regarding public safety.
For small business owners, this information is useful because it lets you know potential sources of liability. Whether it be products you sell or equipment you use in the normal course of business.
From a market research standpoint, this information might be useful if you were designing a brand new product. It might help you avoid some of the safety pitfalls of existing products.
Credit: cpsc.gov
Information is broken into nine categories. Each category has a list of dated reports and injury statistics on related products. It’s also broken out by hazard category. For example – electrocutions, fire, poisonings, etc.
Additionally, the CPSC has a section of their website dedicated issues facing small businesses. Here’s a link to that. I think a quick browse through that page is a good idea for any small business owner.
Of particular interest, for a business designing a brand new product, is the Regulatory Robot. This is a wizard that asks you questions about your new product. It then delivers customized regulatory information that you need to know. A real time-saver for market research and risk management.
5. BLS – market research and help with forecasting/budgeting
As the name implies, the Bureau of Labor Statistics measures labor activity. In addition, it also collects and interprets information on working conditions and price changes.
The Bureau of Labor Statistics prides itself on its objective reporting of the facts. Transparency and accurate data are among its core values.
An entrepreneur could use BLS statistics to forecast revenue. In particular, it would be useful in creating best-case and worst-case scenarios. By knowing how prices changed in different economic conditions – a more informed forecast can be created.
Furthermore, data can be found on wages that would help a startup better estimate labor costs when drafting a business plan.
Beyond that, there is a lot of economic data. Much of this is geographically specific. Which will accentuate information pulled from elsewhere.
Credit: bls.gov/data
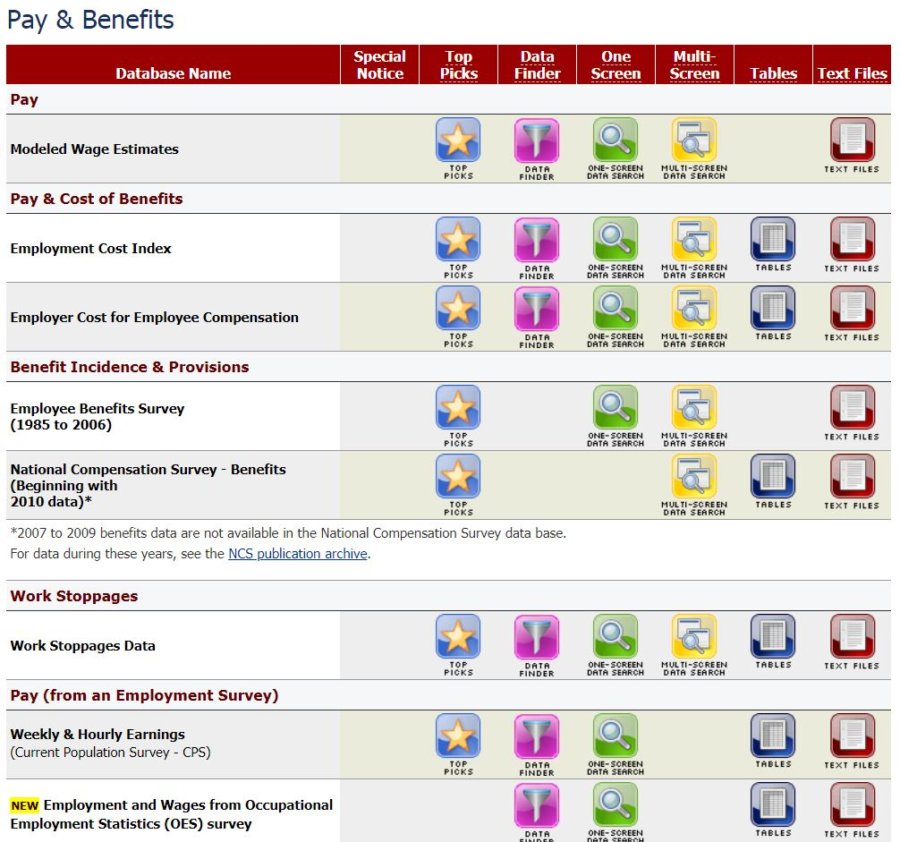
Data from the BLS usually comes in a handy tabular format. Finding what you need isn’t as intuitive as other sites. But, it’s not too complicated. You’ll see that it’s grouped into categories (Inflation & Prices, Employment, Pay & Benefits, etc…) and sub-categories.
For each sub-category, there are several options. These are Top Picks, Data Finder, One Screen, Multi-Screen, Tables, and Text Files. Each is a different means to the same end – the tables that have the statistics you want.
I prefer the Top Picks and One Screen options for finding what I need.
6. Bureau of Economic Analysis – a look at the bigger picture
The Bureau of Economic Analysis focuses on the U.S. economy. This government agency is responsible for calculating the GDP among many other important economic indicators.
As goes the economy so goes business. Some businesses are recession-proof. But, most are not. If you’re a small business planning for the coming year, or an entrepreneur needing market research for a business plan, you’ll want to familiarize yourself with the economic cycle.
You’ll not likely be able to predict when the economy will expand and contract. However, when you compare BEA statistics with those from other sources, you can get an idea of cause and effect. This will give you a better picture of the business environment. In turn, you’ll better understand what it would mean for your small business if ___ happened.
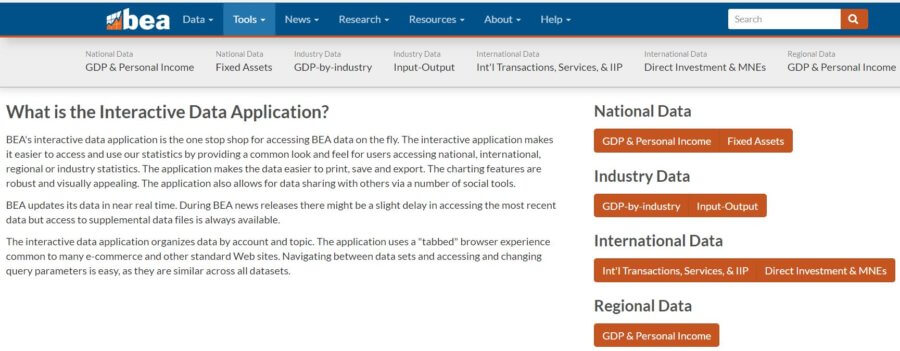
There are three general methods for accessing the Bureau of Economic Analysis’ data. These methods are the Data menu, the Tools menu, and the Interactive Data Application (accessed from the Tools menu).
Credit: apps.bea.gov
Of these three methods, I prefer the Interactive Data Application.
From the main menu of the App, you can browse National Data, Industry Data, International Data, or Regional Data. Each choice will lead you to a sub-menu and some will give you the option to map your information.
From the sub-menu, narrow down what you want to see further. Many of the tables will allow you to specify what state/region you want data for and the year of the results.
Market research data sources
Are there any other market research data sources that fly under-the-radar? What are they?
In an effort to modernize, the Census Bureau recently launched its new portal for census data market research. It is located at Data.Census.Gov. Here, you can find information on a bevy of subjects including population, economics, education, business, and many other topics.
Market research is important to know who your customers are and where they are at. No other free resource (that I know of) has the breadth of information that the Census does. It is your ticket, as a small business owner, to better understanding your customers and your environment.
What is Data.Census.Gov?
This tool is part of the Census website. It has an enormous amount of demographic, economic, and geographic data. If you could use only one source of information in your market research, this might very well be it.
The main portal for accessing Census data used to be the American FactFinder. In July of 2019, the Census began using Data.Census.Gov as its primary means of providing Census data.
The user experience is much more polished on Data.Census.Gov than it was on the American FactFinder. It seems to have been built with the general public more in mind the data-centric business users.
Why use Data.Census.Gov?
It’s unlikely there isn’t something here that could help you. A better understanding of your environment will help you make better decisions. Also, avoid potentially disastrous mistakes.
Most people think of the Census of only having data on population and demographics. In fact, the Census has a lot more. You can find data on health, housing, business/trade, employment, and more.
So, whether your business is retail, manufacturing, B2C, or B2B, you’re likely to find insights here that you would not have otherwise known.
How to access census data market research?
With the American FactFinder, there were four ways to conduct a search: Community Facts, Guided Search, Advanced Search, and the Download Center.
At Census.Data.Gov you are presented with two options. A search bar at the top, and “canned “searches at the bottom.
Start your search with whatever’s most important to you. If it’s a geographic area, start with that. If it’s related to employment, population, or some other topic, start with that.
At any time, if you want to start over, click on the United States Census Bureau button in the upper left. That will take you back to the home page to start a new search.
A solely geographic search
A geographic search will bring up a screen full of “quick facts” about that area. To access this information you need to select the geographic area you want from the drop-down menu that appears as you enter your query. Don’t just type it and click Enter.
The “quick facts” include things like People and Population, Race and Ethnicity, Families and Living Arrangements, among other topics. Basically, the same topics outlined in the “canned” searches at the bottom of the home page.
A topic-based search
A search that includes a topic such as health insurance or housing will give you a results page that includes TABLES, MAPS, and PAGES related to your query. By clicking on the corresponding result-type along the top of the page, you’ll be taken to results that are exclusively that type.
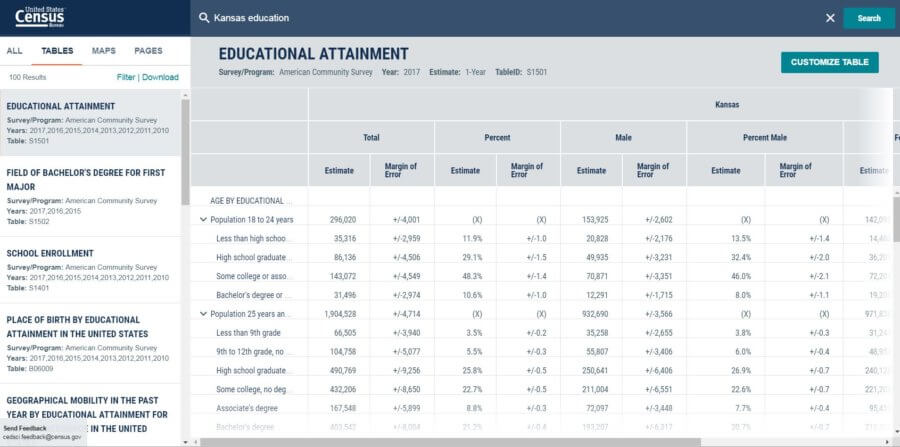
Tables
Credit: data.census.gov
TABLES are the bread and butter of the data-centric user. Upon clicking on the TABLES option, you’ll see a list of tables in the left-hand menu that corresponds with your query.
Once you find the table you’re interested in delving into, click the Customize Table button. It’s in the upper-right.
Now, you can expand and collapse rows so you can only see the data you’re interested in.
When you’re ready to get this information into a spreadsheet, click the chevron (two arrows pointing up) by the title of the table. Select Download/Print/Share. Next, you’ll select the years you want information for and click Download when you’re ready.
Unfortunately, the downloaded data sucks. As I also outlined in the Defining a Target Market… post. It’s difficult to read and can’t easily be put into a format that facilitates understanding. It can’t be copied and pasted into a spreadsheet easily. The American FactFinder site did allow for easy copying and pasting..
Also, if you’d like to add or remove other geographic areas, or the year of the data, click CHANGE GEOGRAPHY or CHANGE YEAR respectively.
Also using the Filter with the tables will allow you to use similar functionality as the Advanced Search option. The Advanced Search will be covered later.
Once you’re satisfied, you can click TABLES in the upper left corner to return to the main tables page.
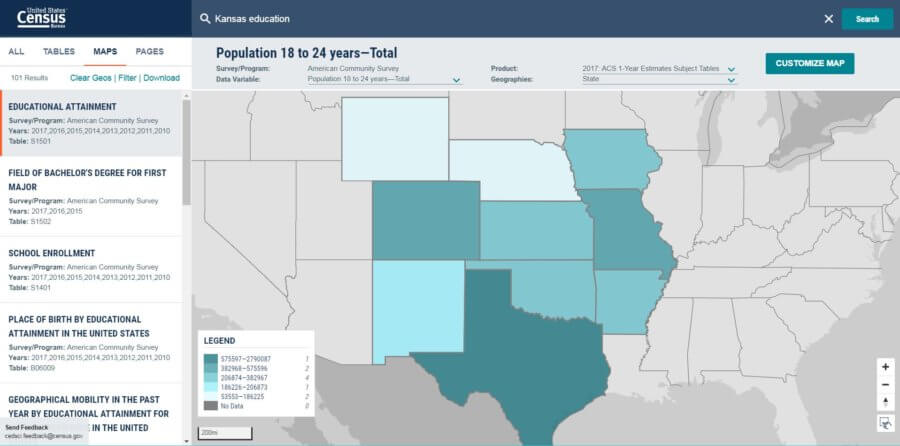
Maps
Credit: data.census.gov
The map and table are tied together. The changes you make in one will bleed over into the other. For instance, if you choose a different Geography in the map, your table will change accordingly.
Along the top, you can also change the Data Variable. These options correspond with the rows in your table.
Geographies will change color according to the data variable. In the lower-left, you’ll see a legend that shows the amounts and quantity of Geographies in each quintile.
You also have the option to click on surrounding Geographies (states, counties, etc.). When you do, they’ll be added to your analysis.
Filters
In the tables, maps, and the Advanced Search, you can narrow down the results by adding Filters. The Filters are pretty intuitive. Select those that you want to use and the data will be updated accordingly. If a Filter isn’t available, it will be greyed out.
Census data market research
What other tips and tricks do you have for finding the data your business needs with Data.Census.Gov?
Do you know of a better way to get information from the tables into spreadsheets?
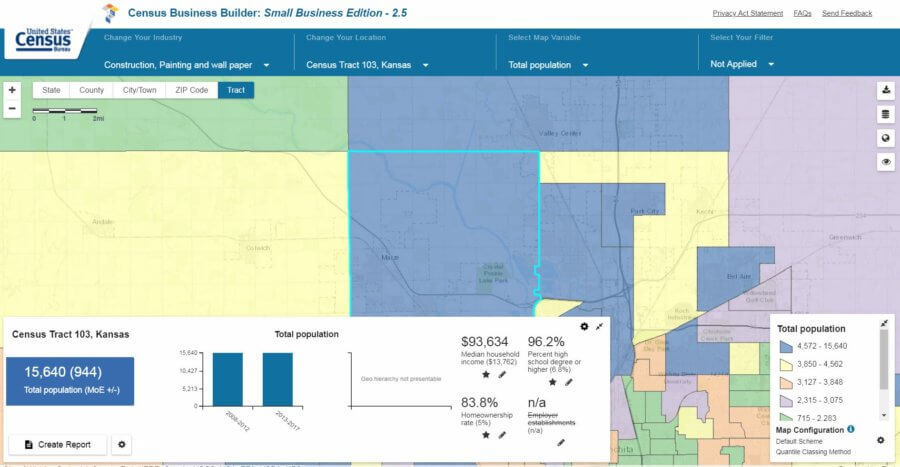
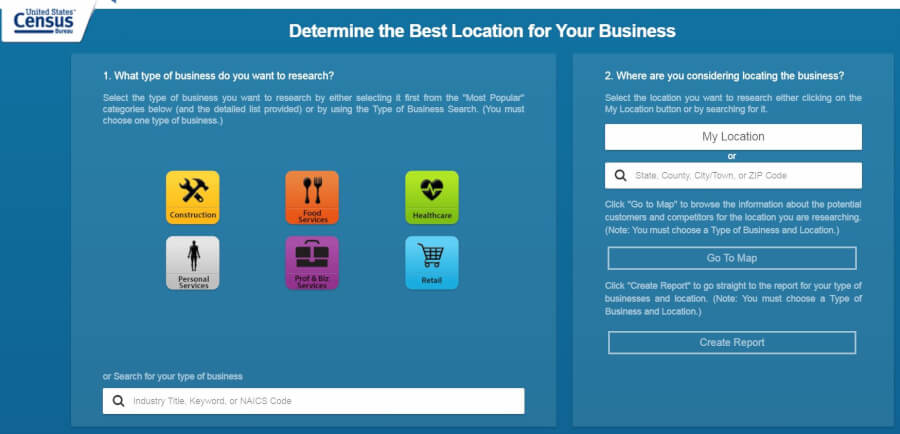
The Census Business Builder is an interactive tool that allows small business owners to make educated decisions about the location of their businesses. Of course, the location of a business can be an enormous factor in determining whether it is successful or a failure.
This is a “wizard,” of sorts, for small businesses to use to find an ideal location. Information is presented in a map or report format.
Go To Map
The map is, as you would expect, very visual. It allows you to view the information by state, county, city, and zip code. Different sections of the map are color-coded depending on the variable selected.
Credit: census.gov
Variables include, but aren’t limited to the following:
Demographic information
Age
Income
Education
Business & workforce information
Consumer spending
Beyond that, you can filter any of the variables to reduce the “clutter” on your map. Then you can focus on the information you’re really interested in.
Create Report
Whereas the map allows you to customize what you see, the report gives you a rundown of the information it thinks you want.
There are three main sections of the report. They are listed below along with their sub-sections.
Not all the Businesses like mine information is always going to populate for a given geography. The more pinpoint the geography (Census tract, ZIP code) the more likely that information will be omitted. I assume this is done to protect privacy.
This resource is a tool for finding information about different industries. Information is available from the neighborhood level up to the national level. The information is presented in a more visual format; whereas a lot of other Census data is in tables.
Why should I use the Census Business Builder?
Because it is map-based, the primary purpose of this tool seems to be to find a good location for your business. Thus, it might prove more beneficial for retail or business-to-consumer (B2C) businesses than other types.
That being said, there are business-related variables and filters too. So, you might find information for business-to-business applications too.
If you have a good grasp on your “customer avatar,” and you are looking for the ideal place to locate your business, then the Census Business Builder could help you avoid costly mistakes and give your retail business the best chance at success.
Gathering and acting on market research takes scarce resources like time and money. You want to know that those resources are well spent.
Credit: census.gov
How to use the Census Business Builder
Using the Census Business Builder is relatively easy and surprisingly intuitive for a government website.
The first step is to select your industry, or manually type it in.
When browsing the map, I couldn’t ascertain what difference it made to select one industry over another. I think this only affects what you will see in the report.
From there you’ll select the location you want to analyze and then Go To Map or Create Report.
Using census data for business – the Census Business Builder map
The map will allow you to move around and see a visual representation of your location, the selected variable, and the selected filters. If you’re viewing data by city, then each city will be color-coded based on which quartile it’s in. If you Change your location to a ZIP code, state, or something else, the map will change accordingly.
Changing the Map Variable is going to affect what you see on represented on the map. Note that you can scroll down on the Map Variables. So, if you don’t see what you want at first glance, there are more options below that.
Your filter options are the same as the Map Variables. By choosing a filter, you’ll be able to exclude geographic areas from your map that don’t meet certain criteria. You’ll set a minimum and maximum for the filter and then select Apply Filter. Your map will update accordingly.
Remember, that like the Map Variables, you can scroll down to find more options for your filter. Apply up to five filters.
At any time, in the map view, you can create a report based on the industry and location selected. Just click Create Report in the lower-left corner.
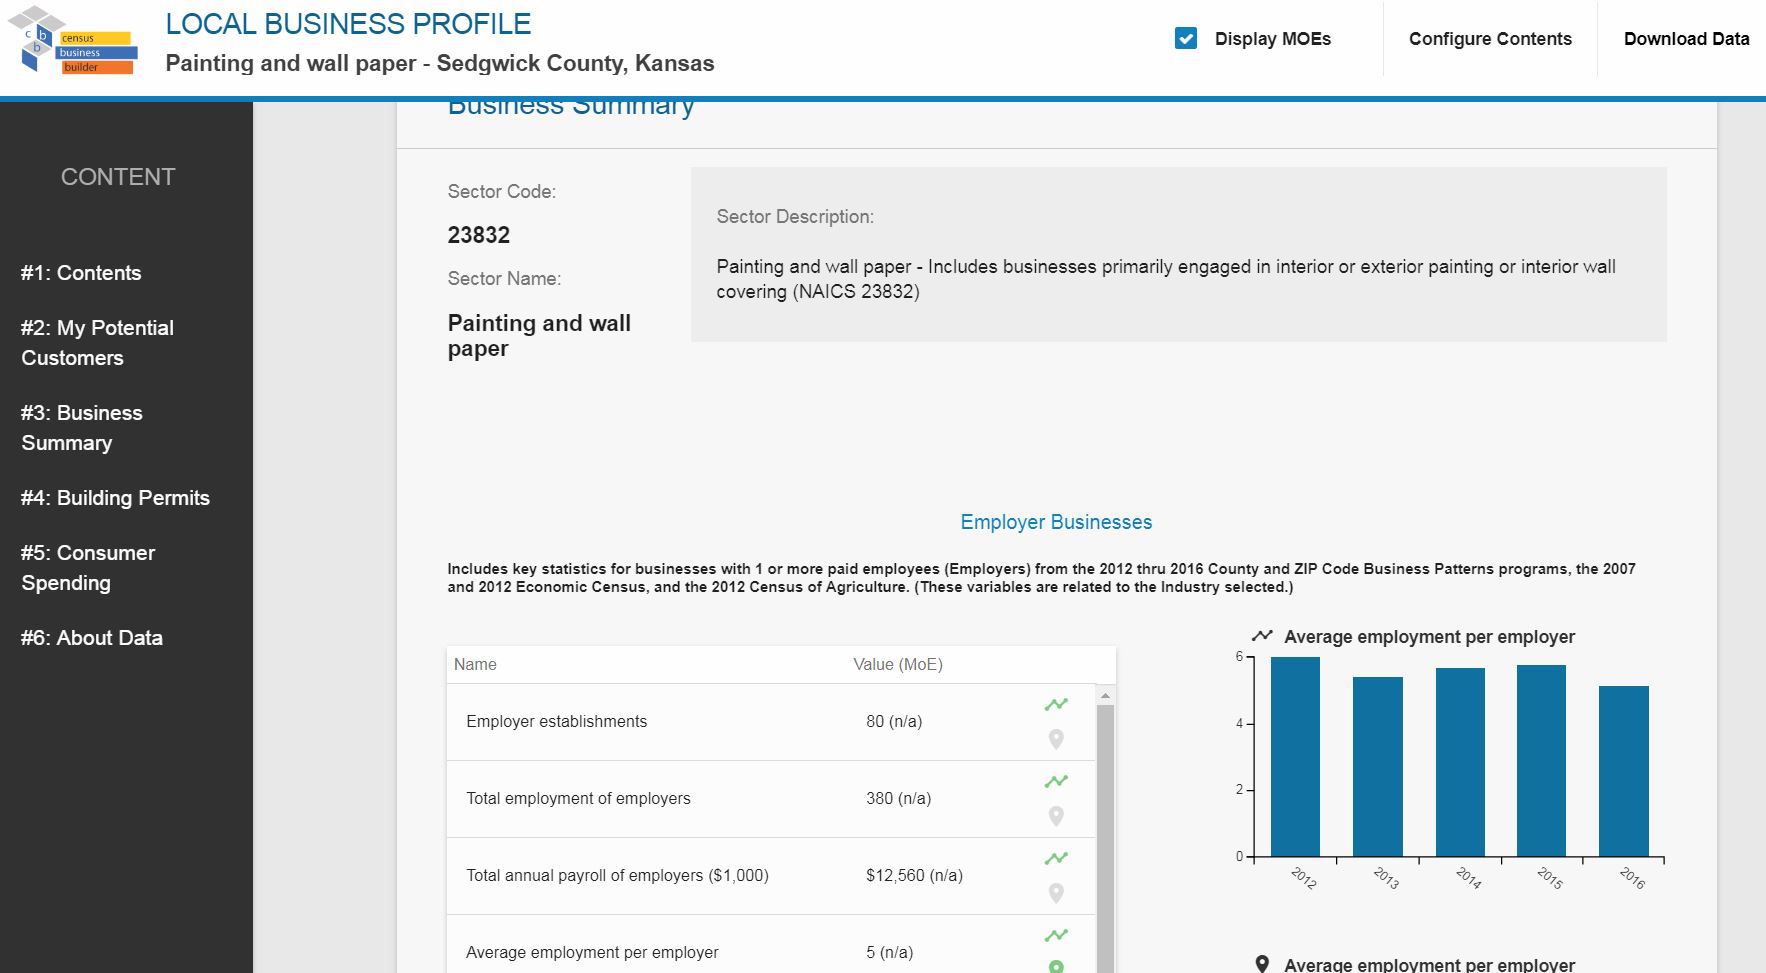
Using census data for business – the Census Business Builder report
The report will provide a nice summary of the location selected. Included will be every piece of data available in the map, in a presentable format. Ready to be copied and pasted into your business plan, if desired.
Click to enlarge Credit: census.gov
Obviously, the report is less interactive than the map. There are some adjustments that can be made, though. Along the top, you see the option to Display MOEs (margin of errors), Configure Contents, and Download Data.
The MOE information probably won’t mean much to the average small business owner. But, if you’re curious, it simply means that the data isn’t exact and could actually be higher or lower by the MOE amount. For instance, let’s say the Percent high school degree or higher is 90% and the MOE is 1%. Then, the actual Percent high school degree or higher is anywhere from 89% to 91%.
The option to Configure Contents allows you to remove sections of the report that might not be relevant.
Finally, the Download Data option allows you to create a spreadsheet or a PDF with the information in the report. From there you can perform your own analysis, copy to a business plan, or whatever else you wish.
Using Census data for business – a valuable tool
What are some “hidden” treasures in the Census Business Builder map that I missed? Is there a combination of variables and filters that provide especially useful information?
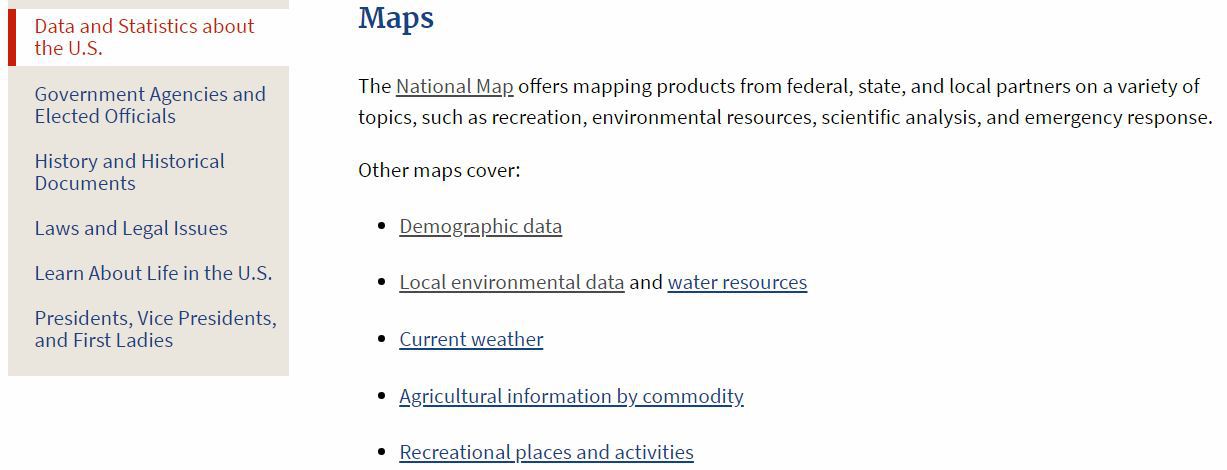
Links to valuable government statistics for market research can be found in the Data and Statistics section of the USA.gov website (those links can also be found below!). These resources are valuable whether doing market research or drafting a business plan. You’ll appreciate the value of the information and the time saved.
What is the Data and Statistics section of the USA.gov website?
The Data and Statistics section of the USA.gov website doesn’t really have any original data. It’s more of a gateway to other government websites that have the information you need.
It’s a good place to start if you are wondering if any data even exists about a specific topic. Some of the topics addressed are:
Economics
Information from the Bureau of Economic Analysis. This includes data on industries, trade, other economic data including the GDP.
The justice system
Provided by the Bureau of Justice Statistics. Data on crime, victims, offenders, and the operation of the justice system at all levels – local through national.
Labor
Labor information comes from the Bureau of Labor Statistics. The BLS prides itself on the objective reporting of data. This data is used to support public and private decision making. Things such as price changes and labor market activity are addressed.
Transportation
The Bureau of Transportation Statistics provides information on airline performance, transportation safety, and much more. As part of the DOT, this site is the preeminent source of data on anything with wheels or wings.
Demographics
The Census Bureau is the granddaddy of all demographic information sources for the U.S. Additionally, you can also find a plethora of business data here too.
Energy
All things involving energy are covered on the Energy Information Administration website. They collect data on all sources of energy. Their goal is to provide impartial information and encourage sound policymaking.
Taxes
The Internal Revenue Service isn’t all that popular with the general public – for good reason. But, maybe you can get a little bit of value for your money by utilizing their statistics information. Included, is data on income, foreign companies controlled by U.S. companies, and exports. Plus, investments in the U.S. by foreign entities, among many other things.
Agriculture
The National Agricultural Statistics Service addresses nearly every aspect of U.S. agriculture. Production, prices, labor & wages, chemicals, and demographics are all part of the data they collect.
Additionally, the Economic Research Service, which is also part of the USDA, addresses agriculture issues too. The ERS’s focus is more on the future (trends and emerging issues) than the past.
Education
The National Center for Education Statistics addresses education. As you might have guessed. As part of the U.S. Department of Education, they are the number one aggregator of data on education in the federal government.
Health
The National Center for Health Statistics is part of the CDC. Their data is, of course, health-related. Information on nutrition, vital statistics, and death is also addressed.
Science & engineering
Here’s a data source that you might not have known about – the National Center for Science and Engineering Statistics. They exist to collect data on research & development activities and the STEM workforce. Also U.S. competitiveness in STEM fields, and STEM education.
Government spending
The authoritative site for U.S. government spending is USAspending.gov. As a taxpayer, you might find this a bit depressing. But, if your business revolves around government spending, you’ll appreciate the transparency.
State & local governments
The federal government isn’t the only public entity that has money burning a hole in its pocket. On the USA.gov website, you can find links to your state and local government websites. No guarantee that they’ll report with the same level of detail as the federal government. But, if you need it, you’ll at least have a starting point for research.
Social security
The Office of Research Evaluation and Statistics is part of the Social Security Administration. Their duties include reporting data related to social security payments, benefits, and more.
No matter what you’re researching, I would suggest at least glancing at the USA.gov website. It will help you make sure you’ve got a complete picture. Most market research will revolve around information about consumers and businesses. However, information from other sources can help paint a complete picture.
You might even come across a resource that you didn’t know existed. This can ensure that you have rounded out your knowledge of your industry. Which, is particularly important if you are in the startup stage.
How to use these government statistics for market research
Since this website is merely a portal to other government resources, there’s not really any technical know-how needed. Obviously, that might change if you follow a link to another government website/tool.
I would suggest if you have the time, to browse all the federal agencies listed and consider how they might apply to your market research. Again, you might already have a comprehensive picture of your industry/market. But, information presented in a different context might compound your understanding of a particular subject.
Analyzing market research from the U.S. government
In addition to the USA.gov website, the Data.gov website also serves as a valuable resource. Here, you’ll find detailed information about the American public. About their workplaces, purchasing habits, and about any other aspect of life you can think of.
Are there any other resources for this type of information (government or private) that deliver the same value as the sites listed above?
What about overseas? It’s a big world out there and marketing to international customers could be very lucrative. Where can similar information be found for other countries?
NAICS codes can be used to perform market research on businesses. The information you gather from NAICS market research will help you, as a small business owner, to make confident decisions in targeting customers.
*By the way, if you’re looking for the actual NAICS code for Marketing Research and Public Opinion Polling – it’s 541910.
What is a NAICS code?
NAICS stands for North American Industry Classification System. NAICS codes consist of between two and six digits. This code is used to classify businesses by activity (what products or services it provides).
Note that the first two letters of NAICS stand for “North American.” This means that NAICS codes are also used by our neighbors to the North and South – Canada and Mexico. The NAICS has, in large part, replaced the Standard Industrial Classification (SIC) system. You might remember SIC codes if you attended business school anytime prior to the year 2000.
The first two digits of a NAICS code represent the sector of the business. The third is for the subsector. The fourth is the industry group. Finally, the fifth and sixth represent the NAICS industry and national industry respectively (Source).
Any business might have more than one NAICS code. In fact, each location is given its own NAICS code.
Why NAICS is important
The NAICS exists to efficiently compile, create, and analyze business data. Data that is collected includes employment, revenue, and inventory; among many other things.
Since this much of this data is made public by the Census Bureau, you have the ability to use the NAICS for market research. Particularly if your business currently does, or plans to market to other businesses.
Beyond market research, NAICS codes can also help your business generate leads. In order to get the contact information, you’ll probably have to purchase it from a 3rd party vendor.
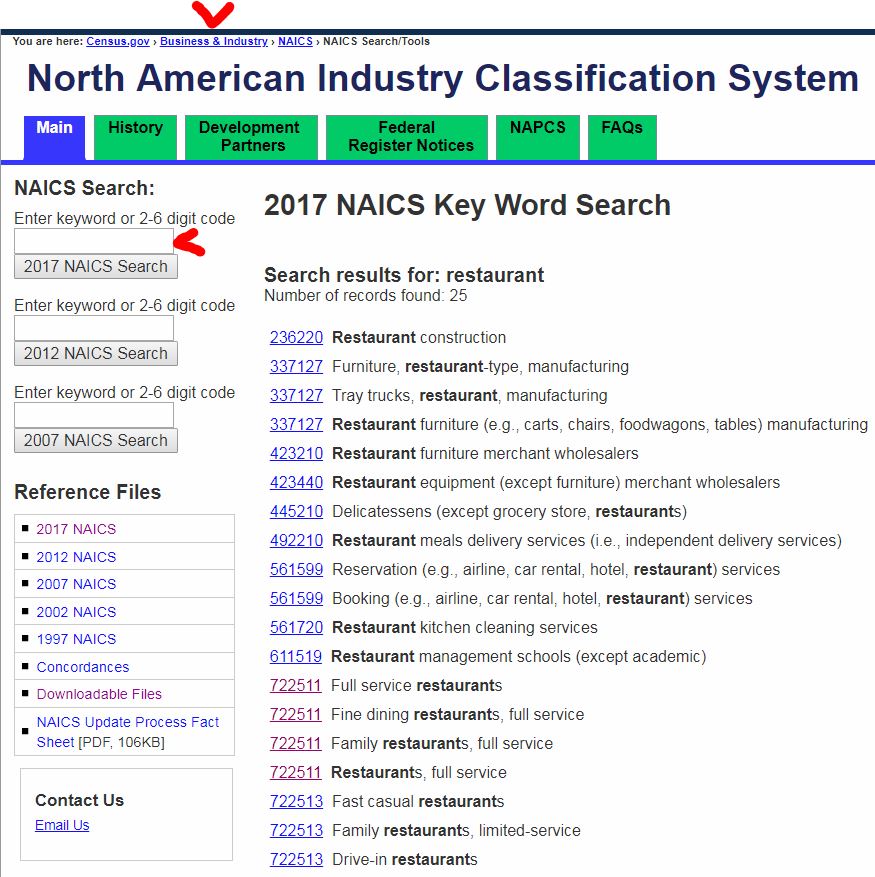
How to use the NAICS for market research
The first step to utilizing NAICS is to know the code you want information on. From the NAICS website, you can search by keyword on the left-hand side of the page. Searches can be performed on current or historical NAICS information.
The search should return codes that will link to a list of example businesses. This helps you be sure that you have precisely the right code.
Credit: census.gov
Industry Statistics Portal results
Once you know the NAICS code you want to research, click on this link to be taken to the Industry Statistics Portal. After entering your code, you’ll be given links to related data sources.
Most searches will return you to to the same four results: County Business Patterns (CBP), Statistics of U.S. Businesses (SUSB), Economic Census (ECN), and Survey of Business Owners (SBO).
The CBP includes annual reports with information on the subnational level. Employment, number of establishments, and payroll data are included.
The SUSB pulls data from the Census Bureau. Most of which is in Excel format.
The ECN includes data on people, places, and businesses. Most of this data is from the Census Bureau FactFinder. If you’re technologically sophisticated, you can also pull data via an API.
Finally, the SBO can also be accessed via an API. Beyond that many of the links also end up at the Census Bureau FactFinder.
There’s a link in the lower left-hand corner of the page to Selected Visualizations. From what I saw, this was potentially interesting information about the industry in question. Furthermore, it would allow you to drill down to the state level. But, unfortunately, as of this writing, it’s a dead link.
I sent an email to let them know about it and to see when it would be working again. No response as of yet…
Market research with a NAICS code
What are some other circumstances where you would use the NAICS for market research?
Are there other marketing opportunities with NAICS codes besides lead generation?
Small businesses and entrepreneurs use demand analysis to:
Consider substitute products and services
Get input from (potential) customers
Determine what “drives” demand
Understand what variables affect demand and to what degree
Demand analysis is about challenging your preconceived notions regarding your product/service. A stress test, if you will. A demand analysis will take your idea and start molding it into something that has even higher potential.
As an entrepreneur, you can’t be too stubborn. You have to be flexible. After going through this process, the hope is that you’ll come out the other end with an even more refined idea and a greater chance at success.
Market research and competitive analysis for a business plan
This is the second post on drafting a business plan for your startup. These posts are modeled after the SBA Business Guide.
When first thinking about the market for your product/service, don’t define it too narrowly. Try to think of substitutions that you might not have otherwise considered. No, you might not compete directly with these substitute products, but the presence of substitute products will have an impact on your pricing and demand.
Pricing too high could push customers to these substitute products. Even if that pricing seems in line with your value proposition when compared to direct competitors. But, theoretically, the amount demanded changes (inversely) with the price. A higher price will push customers to consider alternatives. A lower price should result in a higher volume sold.
Further defining the market for my product
As I mentioned in my first business plan post on the topic of demographics, I am working alongside you. I have a prospective product that I would like to explore the viability of, and I am creating a business plan for this product as I write these posts. As a reminder, my potential product is an all-natural hair-thickening topical supplement.
Anyhow, in the previous post, I used “customer avatars” to roughly ascertain the size of my market. I think I was fairly liberal in that estimation. The three of my avatars that were the most detailed totaled approximately 5.2 million people. The avatar that was broader included 6.5 million people.
As mentioned above, I have to keep in mind that not all of these people will pursue hair loss treatment. Many, will just accept it as a normal part of aging. Others will choose to address the problem but will pursue an alternative treatment method to topical supplements. Some of these alternative treatment methods include:
Obviously, there’s no shortage of alternatives to my prospective product. However, many of these treatments are ongoing and the potential exists for customers to combine them.
After listing these potential substitutions, it dawned on me that there are a couple of different classes of hair loss. I would probably target individuals that are in the early stages and are merely looking for help to slow down and, hopefully, somewhat reverse the initial effects of hair loss.
Another thing that dawned on me when researching substitutions is that it might be a mistake to only consider men when ascertaining the market for this product. Most of the results I found when searching “hair loss treatments” were articles targeted at women.
As I said, I’m taking this journey right along with you. So, I’m refining my idea and picking things up as I go along.
Gathering survey information for your business plan demand analysis
The next steps are mostly statistical. That might give you pause if numbers aren’t your thing.
I really do wish I could provide you with the handiest spreadsheet imaginable to manage the information you find. There are just too many variables, though. Different surveys asking different questions. Not to mention, every industry is going to address unrelated topics. I just couldn’t figure out how to make a one-size-fits-all tool.
What we’re going to do is compile whatever relevant statistical information we can get our hands-on, and interpret what we find. You can input this information into your own spreadsheet if you like
Statistical information, hopefully, can be obtained from a simple internet search. “[your topic/industry] survey results”, or something similar should yield some useful information. If you can’t find relevant info, then you might have to reach out to industry trade magazines or organizations.
As far as how much survey information to collect – there’s no clear answer. It depends, first and foremost, on the abundance of such information. If there is plenty available, then I guess I’d recommend collecting it until you’re tired of doing so. You can always circle back around and search for more specific results if you need to in the future.
What to focus on
Right now, focus on demographics information, substitute product information, and information about motivation (drivers).
This is where having it in a spreadsheet will come in handy. With the numbers in a spreadsheet, you can combine survey information and break it down as needed. Check out my example below to see what I mean.
Click to enlarge
Survey information about my product
There was no shortage of survey results regarding hair loss. In fact, I grew tired of collecting information well before I was able to read it all.
I must admit, I learned something on this step. I learned that it probably makes more sense to do this research before creating customer avatars rather than after.
This research showed me that hair loss in women is a considerably more prevalent problem than I knew. So, I should definitely not exclude women when trying to calculate the size of my target market. Additionally, I learned a lot more about the age that hair loss starts to affect men and women. Not to mention, a lot of other interesting tidbits related to marketing and substitute products.
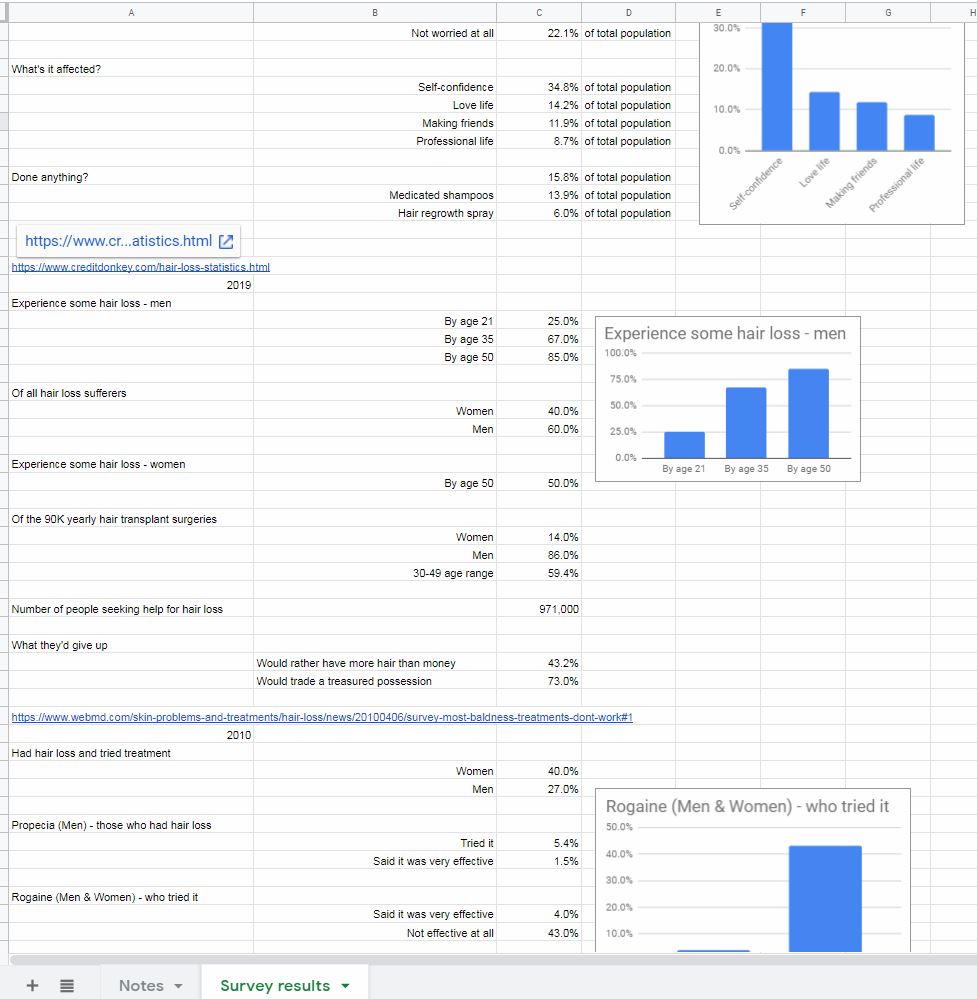
I simply typed the figures I found into the cells and tried to organize it in a somewhat easy-to-read format.
To make this information as useful as possible, I also included a link to the survey – in case I wanted to reference it again. Also, I thought it would be useful to make note of the year the survey was conducted. That way, I could note trends, if any existed.
Finally, to top it all off, I put in some charts. Charts can help to illustrate ideas in a way that numbers can’t, sometimes.
Now, I have a nice little foundation of data to build my business plan off of. I also know that there is plenty of other information out there if I want to delve further on a specific topic.
Divide total industry demand into its main components.
Now, you want to start to organize the information you found in a logical manner.
First, isolate the information related to demographics or that which otherwise describes your potential customers to you. You want to break this information up so that you can get an idea of what your potential customers might look like. You should, hopefully, begin to see customer “avatars” take shape.
Yes, I asked you to create avatars in the previous post. As I said above, that was probably premature. It would make more sense to create the avatars with this survey information, then use the census/demographic information to estimate the size of the market based on what you found.
Live and learn…
After you have the demographic information in good order, move on to the “solution” information – if available. This is information that specifies how customers are solving their problem(s) now.
If you’re lucky, this information will join seamlessly with the demographic information you organized above.
Start with the simplest questions (those with the fewest variables) and expound from there.
What if my survey data is inconsistent?
You might run into a situation where you have conflicting information. Or you might find yourself in the fortunate situation where different surveys seem to corroborate the same statistics.
If your information sources don’t jive, you have a couple of options. First, you can move forward with the information you deem to be the most trustworthy. Or, alternatively, you can average what you found. This works well if the differing results are relatively close together. Finally, you can choose to use the data source that is most recent – particularly if your industry is especially dynamic.
All of your numbers aren’t going to jive up perfectly. However, at this point, you are armed with a lot better information than when you started. Better information will ultimately lead to better decisions.
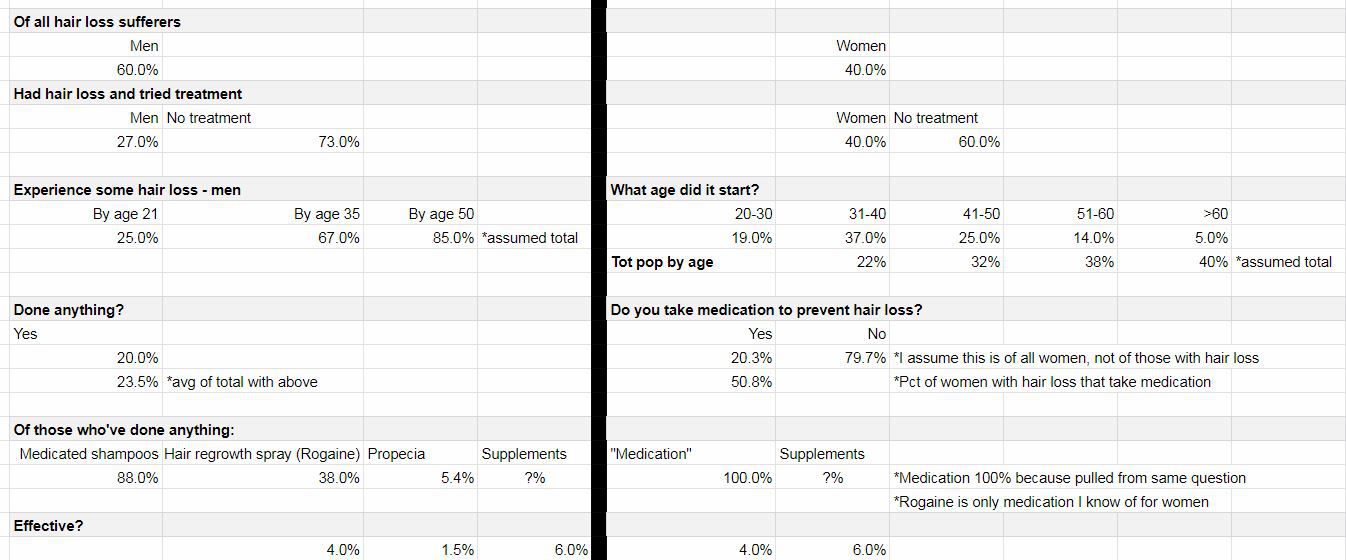
Industry components for my product
Demographics
For my part, I like to start simple and divide my demographics based on the variable with the fewest options. In this case, the simplest variable only has two choices – men and women.
From there, I used information that I found regarding the percentage of men and women that have had hair loss and have tried treatments.
Next, I break things down further based on the age that men and women started experiencing hair loss. I was fortunate to find information for both genders.
That’s the extent of demographic information I was able to obtain. I would have liked to have found some information regarding income or socioeconomic status. If that information proves to be critical as I move forward with my business plan, I’ll have to circle back around to see if I can track it down.
Once I felt good about my (revised) customer avatars, I moved on to “solution” information.
Again, thanks to the abundance of information I was able to find, I found similar questions for both genders. The first question was the simplest. It asked if the person with hair loss had done anything to address the problem.
From there, I had a couple of survey questions that explored the alternatives that hair loss sufferers had tried in the past. Additionally, I found results that gave insight into how effective these alternatives were.
When all was said and done, I had the groundwork laid for the ability to know how many potential customers I might have, their demographics, what they have tried so far, and how well those alternatives had addressed the issue at hand.
Here’s what my worksheet looks like after sorting my information into industry components:
Click to enlarge
Business plan demand analysis of drivers
Hopefully, in your search for survey results, you came across some information that provided insight into the “why people buy” question.
In particular, we’re looking for drivers of sales here. Specifically, what circumstances compel a customer to buy your product/service (or a substitute)? Hint: people usually buy to solve a problem. To avoid pain, not seek pleasure. Or, so I’ve been told…
Insight into what compels your customers to buy will not only be valuable in the drafting of the remainder of the business plan but in all your marketing efforts once you are up and running.
The information about who your customers are (from the previous step), why they buy, and what steps they are currently taking to solve their problems (also from the previous step) will hopefully paint a clear picture for you. A picture that will guide you to a point where you can position your strengths in a manner that will help other people’s weaknesses.
Understanding the drivers of demand for my product
Again, I was fortunate to have an abundance of survey information to draw from. A couple of my surveys not only touched on how hair loss made people feel but also on specific actions that they had taken before the hair loss started.
This information tells me an angle I can take when marketing my product, plus where a lot of my potential customers are going before they start to experience this problem. That place…the hairdresser.
Of course, that’s for women. Though there’s no rock-solid proof that it’s hairstyling that is contributing to hair loss in women, there is enough correlation to make a compelling case. For men, on the other hand, hair loss just seems to be the hand that most are dealt.
But, before we get into that, let’s look at some of the emotional drivers that might compel customers to purchase a topical hair loss supplement…
Drivers for men
On the “men” side I got information about how “worried” men were about hair loss. This told me that most men were, at least, “somewhat” worried about hair loss.
Beyond that, there was valuable information about how hair loss had affected them negatively.
Finally, the most valuable information, to me, was a question of what they would give up to solve this problem (men & women). The answers were encouraging for someone who was hoping to build a business in this industry. Almost half would rather have more hair than more money. Three quarters would give up a prized possession for more hair.
While I acknowledge that I’m not marketing a guaranteed cure to hair loss, that tells me that people are willing to try anything to fix this problem. As I know from my market segmentation analysis, supplementation works for about 1 in 17 people. Not great odds, by any means. But good enough, I hope, to at least try a new product. Especially when the ingredients are all-natural and offer no downside.
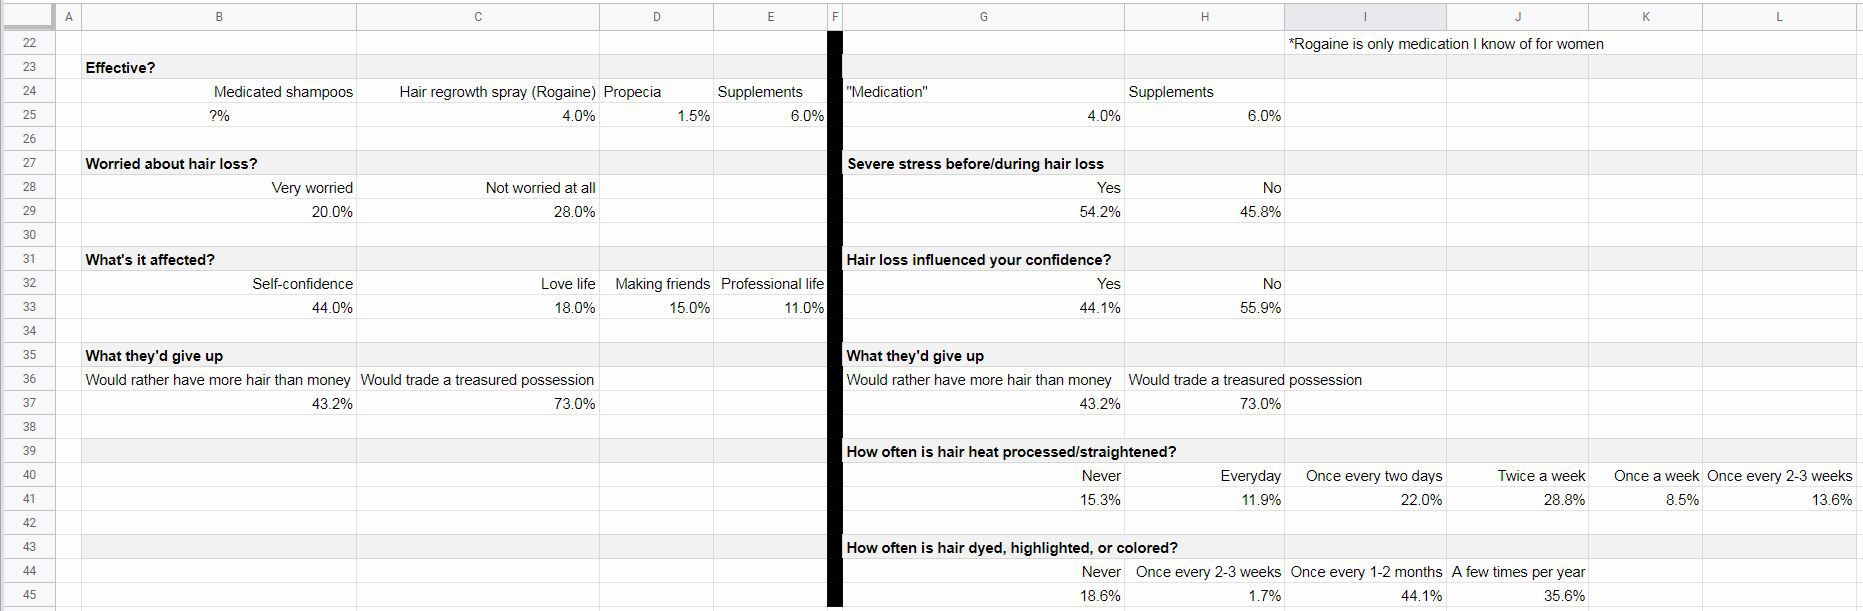
Drivers for women
About half had stress prior to experiencing hair loss. That’s a coin flip. It doesn’t mean that the hair loss was caused by the stress (though it surely didn’t help). But it provides insight into what women are feeling prior to and while they are experiencing this problem.
I also included the “What they’d give up” question on the women’s side of the analysis because my source for that information didn’t specify either gender. Plus, it seems feasible that women would feel the same or even stronger. It’s my opinion that society values female attractiveness above male attractiveness.
Finally, we get down to the brass tacks. A potential cause-and-effect situation for the problem I’m attempting to address. The number of women that are currently experiencing hair loss are also (possibly) straightening/heat processing or getting their hair colored on a semi-frequent basis.
This tells me that hairstyling might play a part in a lot of women’s hair loss (this goes back to the pressure to be attractive thing). Therefore, I should consider marketing my product in salons and other establishments that focus on women’s hair.
There’s still a lot of analysis to be done. But, two steps into the process of drafting my business plan, I feel a lot more confident about my understanding of the environment.
Here’s a look at my spreadsheet with the driver information included:
Click to enlarge
Business plan demand analysis of sensitivity
To this point, the goal has been to make assumptions and get answers. We want to have a better understanding of the environment in which our business will operate. Hopefully, you feel that you’ve accomplished that.
But, we don’t do ourselves any favors by lying to ourselves.
Lying?
Well, yes. But probably not willingly.
You start off excited about your business idea. So excited that you decide to take the first step (something that the vast majority of people won’t do). You begin to write a business plan. You can feel your idea taking shape. You’ve already refined your idea a bit and feel that by the time this whole exercise is over, there’s no way you can fail. You’ve got momentum and your confidence keeps increasing.
That is all very good. Confidence is key. But, if everything looks rosy, you might be blind to a risk that could put your baby in jeopardy.
So, I don’t want to be a killjoy. But, for the sake of our businesses, let’s take a step back and play devil’s advocate. We need to ask ourselves some tough questions and challenge our assumptions. If we can rise to these challenges, and address them with confidence, our chances of success are that much greater.
Go back through your segmentation and demand drivers and think critically about this information. Some statistics might be a given, without much wiggle room. Others might be misrepresentative of reality. In these instances, tap into your inner cynic.
Make notes of what the worst-case scenario might look like. If you’re using a spreadsheet, like me, maybe use a different colored text. Address things like survey questions that might have been misinterpreted or alternative explanations for results.
Don’t get too down-and-out here and don’t dwell on this step too long. You don’t have to necessarily plan what you would do if these worst-case scenarios came to be. You just need to imagine them so that when the time comes for serious planning, you can take these risks into consideration.
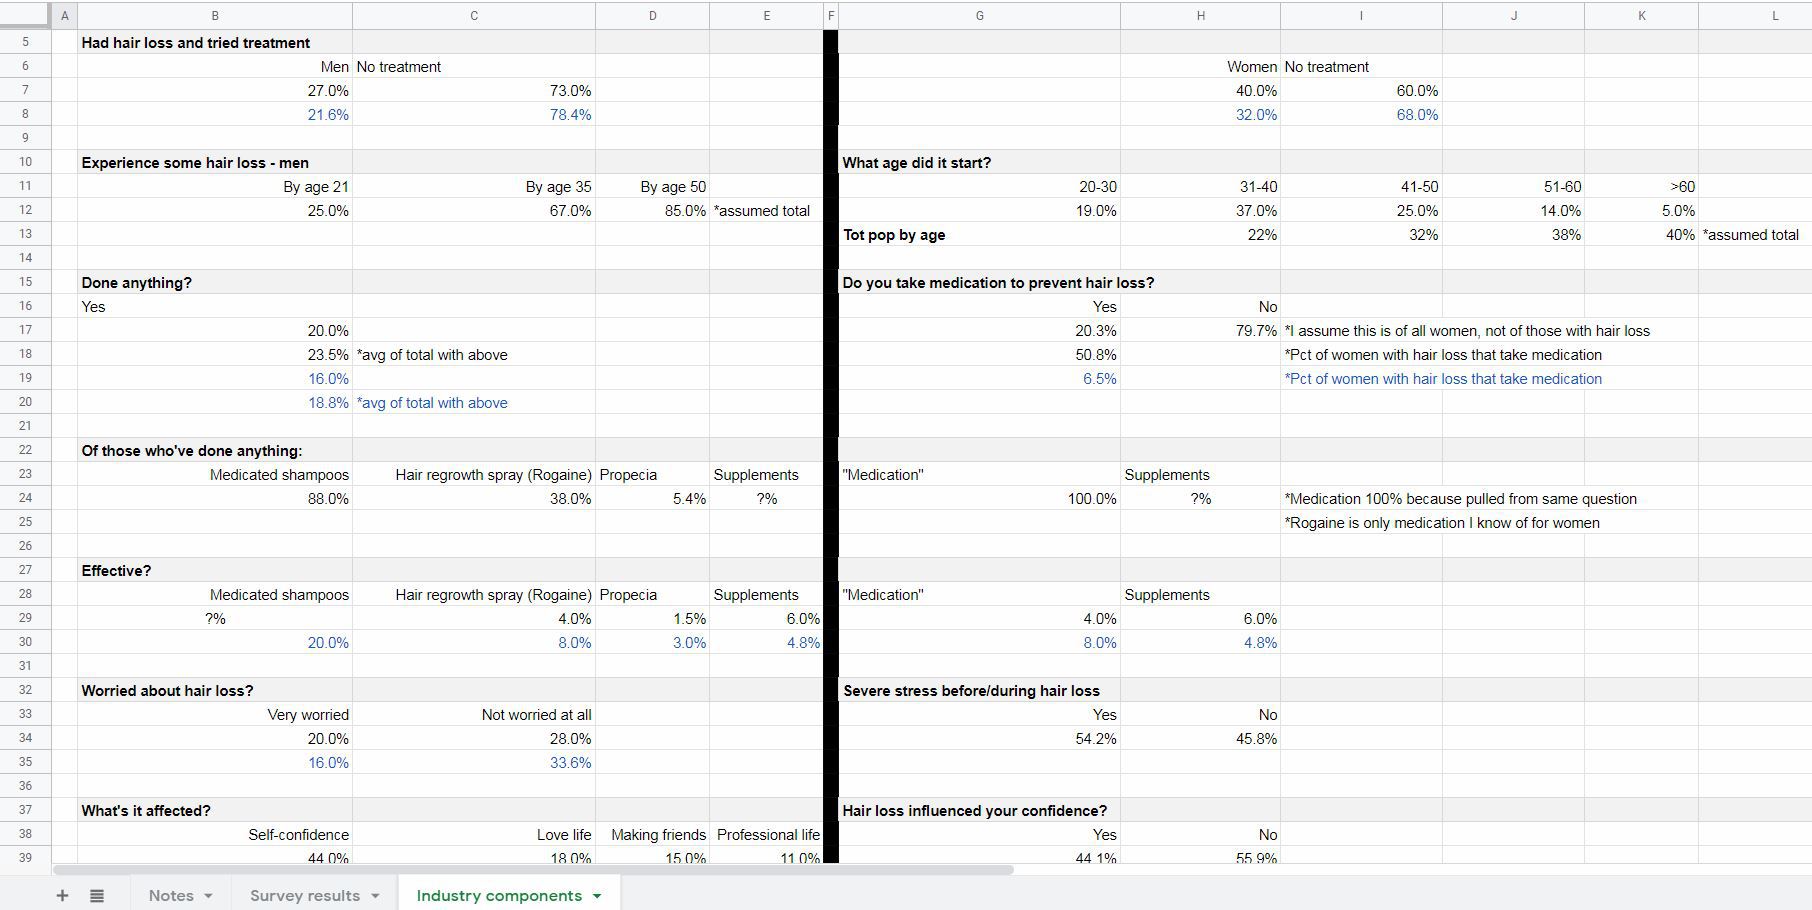
Demand sensitivity for my product
Demographics
I think my categorization by demographics is pretty safe. It’s rather well established how many men and women experience hair loss. The only thing that I might tweak is the number of men and women who have had hair loss and tried treatment. I lowered those estimates by 20%. It could be that the respondents’ interpretation of “treatment” is to comb their hair a different way or to shave their heads rather than to buy a product to battle hair loss.
Furthermore, what if the number of people that have “done anything” is lower? What if I misinterpreted the question for women that asked: “Do you take medication to prevent hair loss?” Maybe it was 20% of women who actually had hair loss rather than all women? The effect of that would be dramatic.
Substitute products
What if the alternative treatments were more effective than I’ve been led to believe? It could be that the respondents only consider “effective” to be a restoration to a full, thick head of hair? Also, just because they consider them ineffective, it doesn’t mean that they’ll stop using them. They might think that all of their hair will fall out if they stop (which could work in my favor, though). Perhaps they were overly optimistic when it came to supplements? It could be that supplements gave them other benefits, but didn’t make their hair loss any worse – so they considered them “effective.”
Drivers
Could it be that fewer men are really “(very) worried about hair loss” than I’m led to believe? Are more are “Not worried at all?” Plus, it might be that those who are only “somewhat worried” aren’t motivated to do anything about it.
As far as confidence (love life, making friends, professional life) goes, it might be that that hair loss is a contributor to low confidence, but not the primary driver. Maybe they’re overweight or socially awkward and that’s why they lack the confidence they desire?
As far as “what they’d give up” it could be that the respondents were primed by the hair loss questionnaire to be more self-conscious than they usually are. If it came down to it, perhaps not so many would be willing to part with valuables to solve this problem.
Finally, as far as hair styling being a cause of hair loss in women, it could be that I am wrong. Maybe hair styling has no effect on hair loss. Or, maybe women overestimate how often they heat process or color their hair. It only feels like every day/once every 2-3 weeks. When, in fact, they do it a lot less often.
Okay, that’s enough pessimism. It seems unlikely that every worst-case scenario would be true. But, there’s probably a mix in there between my initial interpretations and the not-so-great ones.
This exercise should help me going forward to make realistic forecasts and assumptions. Which, in turn, should help me be proactive to some of the challenges I might face.
Here’s a final look at my spreadsheet with my worst-case notes in blue:
Click to enlarge
Business plan demand analysis
This step takes a little bit of thought and a decent amount of research. This is done to give you a deeper understanding of the market you hope to compete in and the customers you hope to sell to.
What other steps would you have taken to refine estimates of demand?
Do you think my demand sensitivity was rational? Or, was I taking it too easy on myself?
Sorting through demographic information is one of the first steps in doing market research and competitive analysis. This is stuff you’ll need to know in order to prepare an effective business plan. Without this information, you, as a founder, don’t know if there is a sufficient market to support your business. You will also be starting off at a disadvantage when planning other aspects of your business.
**Note: this business plan demographics guide was written just before the Census Bureau changed its primary portal for data from the American FactFinder to Data.Census.Gov.
Download a free copy of the workbook used in this post
Complete the form below and click Submit. Upon email confirmation, the workbook will open in a new tab.
Keep in mind that this workbook is only designed to work with table S0201, Selected Population Profile in the United States. Any other table might not be in the correct format.
About these posts
This series of posts was written to convey my take on how to write a business plan. My intent is to follow up with several more posts after this one.
I’m using the U.S. Small Business Administration (SBA) Plan your business guide as my outline (link). In true SpreadsheetsForBusiness.com fashion – I plan to include free downloadable spreadsheets where appropriate.
Rather than just recycling the same information you could find elsewhere, I’m going to take this journey with you. I’ll be building my own business plan as I write these posts. This is my first business plan, so you’ll be learning right along with me.
My business plan
My plan is based around a hypothetical business that will manufacture and market a hair regrowth product for men (and women, I suppose). The plan is to manufacture the product with all-natural ingredients.
What are business plan demographics?
Sorting through demographic data for your business’ potential customers is the first step in understanding what type of person (or business) might be interested in your product or service.
It can provide an unofficial ceiling to the number of customers you might expect. It’s from this information you can get into more detail about demand, market saturation, pricing, and so on.
Common demographic information includes:
Gender
Age
Race
Income
Education
Marital status
Employment status
Geographic area
Why worry about business plan demographics?
Focusing on marketing to specific individuals helps you plan with clarity. The saying goes: “you can’t please all the people all the time.” By not trying to market to everyone a little bit, you can focus your efforts on creating a really good experience for some people.
Whatever your business is, it probably is a reflection of yourself. Your interests and talents, that is. Who you market to will also depend on your characteristics and preferences. So, as you choose the demographics of your avatar, consider who you identify with and would be comfortable marketing to.
How to find and analyze business plan demographics
The market for a product or service is quantified by the number of people who make it up and the total amount of money they spend. We can quantify the size of the market by segmenting people based on their demographic characteristics
Of course, since most of this information is numerical, I’ll be using a spreadsheet to keep track of what I found and what changes in variables mean for the market of my aspiring business.
Also, I’ll be using online resources for the sake of time and simplicity. Theoretically, market research could involve things like focus groups and surveys. That’s more involved than I want to get for this idea, so, I’ll stick with the free information.
The SBA has a nice list of resources for market and competitive analysis here.
Demographic information
Here, we’re just looking for basic information about the people who I might be selling to. For instance, how many people are in the age range that I would market to? How much money do they make? Are they single and looking to mingle? Or, are they in committed relationships and proud of their bald head (like a certain “old man” I used to know and miss very much)?
Here, you can find Census data about your state, city, or even zip code. Not every business is going to be nationwide. Some, like a restaurant, will be very local.
Also, if your business will market to other businesses (B2B), then the information contained here may or may not be pertinent to you. Try another part of the Census website called the Small Business Edition (link) if you’re not finding what you need.
Since, as of now, I envision my business being nationwide (at the very least regional), I chose to use the “Guided Search.” From there, in the “Topics” section, I chose to look at information pertaining to age, sex, age group, income/earnings (households), and marital status.
I can always delve into more detail or retrieve different information at a later time. My hope is that this gets me started.
Click to enlarge. Credit: factfinder.census.gov
Additionally, on the next screen, I chose to break the information down by region. I included all regions so that I could total them for a view of the entire country.
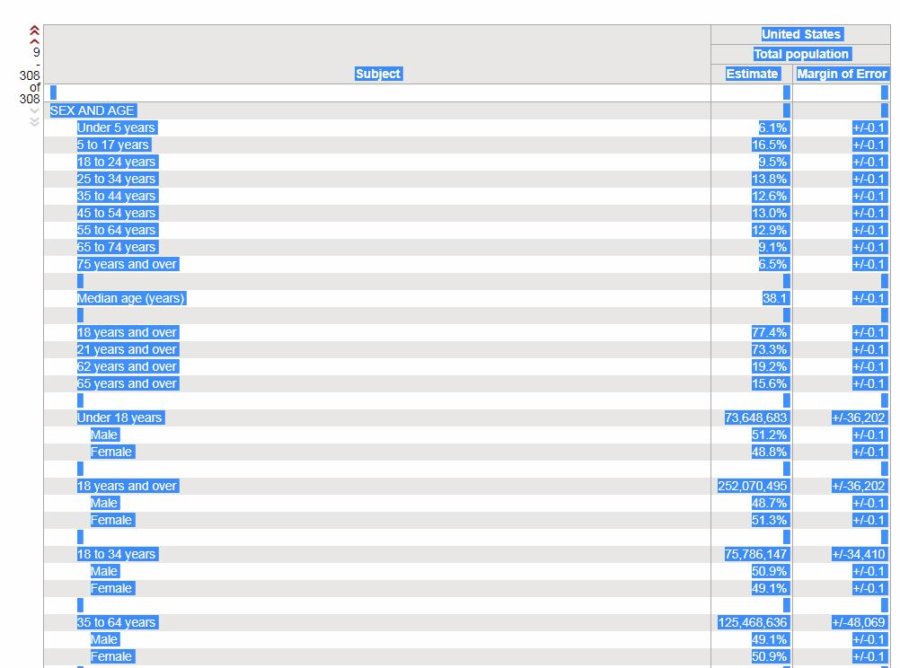
Finally, on the last screen, I opted to see the one table that outlined this information in 2017, the latest year available.
Don’t bother with the “Download” Action. It will give you your data in a different format than it is displayed.
Click to enlarge
Instead, just highlight everything in the FactFinder table and copy + paste it in a spreadsheet.
Click to enlarge Credit: factfinder.census.gov
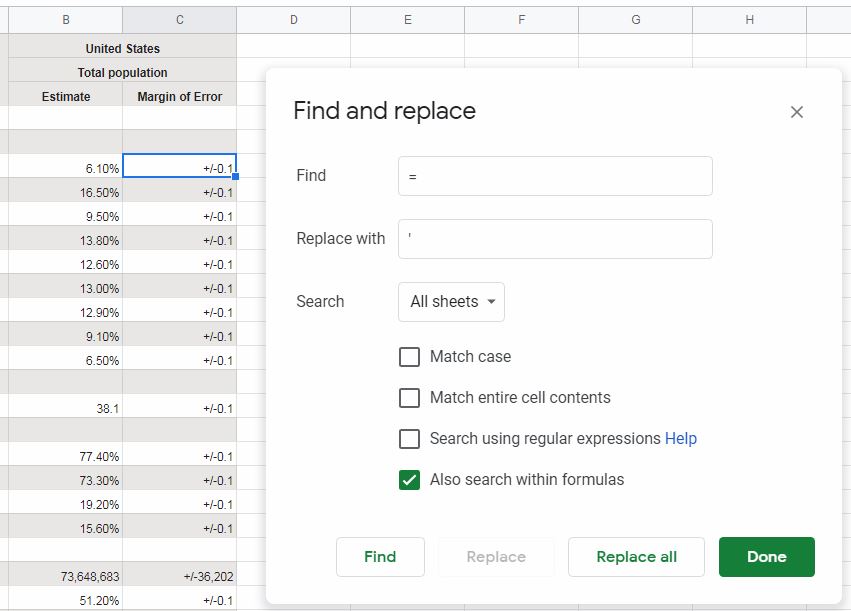
Fixing errors
From there, do a Find and replace in your spreadsheet to get rid of the errors that are a result of a “=” being placed in front of the “+/-.01” in the Margin of error column. Replace the “=” with an apostrophe. Be sure to Also search within formulas.
Filtering for the demographic information I need
My goal here is to get a range of the number of potential customers based on a set of demographic statistics. I have a lot more information than I need, so let’s see if we can widdle this down into something more useable.
To do this, I added some columns to the Demographic Info worksheet.
First of all, I added a column (Estimate #) that aimed to translate some of the percentage population information into quantities. The format of every download from FactFinder isn’t going to be the same. But, an attempt was made to give you access to both percentage and quantity information for each line item.
Additionally, you’ll find a column named Enter 1-10 to rank demographics. Here, you’ll be able to rank demographic information and narrow down your market on the Pick Demographics worksheet.
Maybe you have a couple of different mixes of demographics in mind. That’s fine. Once you are satisfied with one mix of demographics you can highlight the information on the Pick Demographics worksheet, then copy and paste the values (Ctrl + Shift +V) into one of the boxes on the Customer Avatars worksheet.
This allows you to keep tabs on several different customer profiles as you move forward with your business plan.
Keep in mind, this is just the first step of the business plan. The whole point of a plan such as this is to be proactive. In order to be proactive, you’re going to have to be flexible.
If, as you move along through the steps, you reconsider your target demographic – that’s fine. Just circle back and refine your avatars and make adjustments to other parts of the plan as necessary. Don’t get discouraged if you have to do this. That isthe whole point of this exercise.
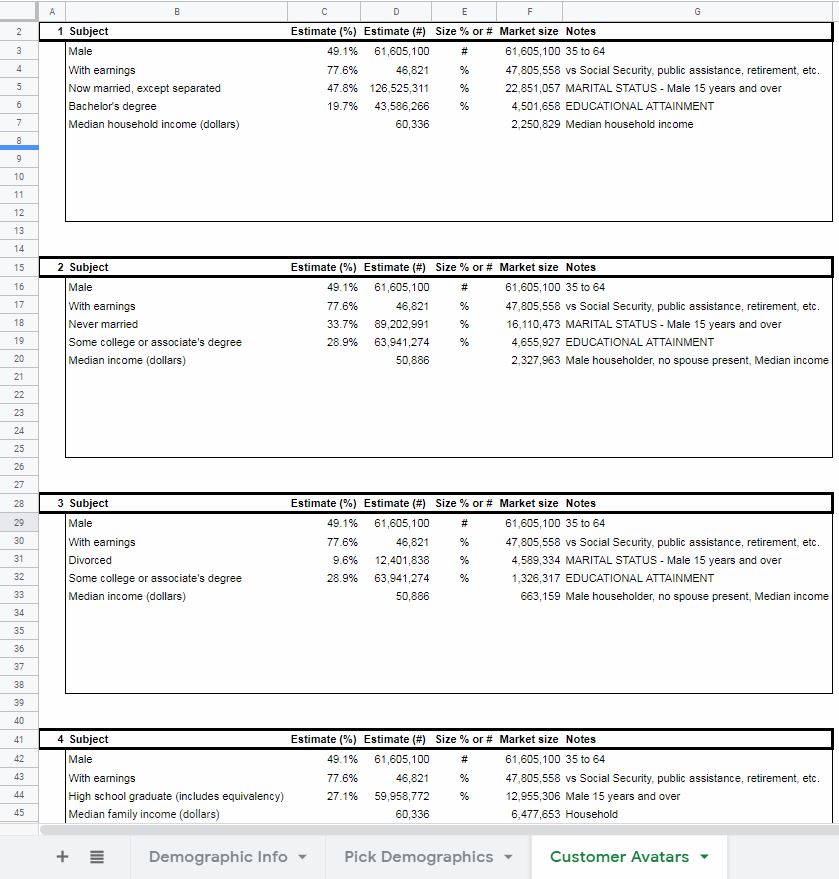
My avatars
For my avatars, I created four, relatively similar mixes of demographic characteristics.
Gender and income
All include males. Though females can also suffer from hair loss, I am assuming that males would be the primary customer and who the majority of marketing would be geared toward.
Next, every mix of demographics included individuals with earnings as opposed to those with retirement income, with Social Security income, or any other type of public assistance.
Right now, I anticipate that this product would be sold at a premium price due to its uniqueness and all-natural ingredients. This would mean that customers would likely need to earn above-median incomes in order to be in a position to buy a product such as this. Assumptions such as this might change as I progress through this business plan.
In three out of my four avatars, I made assumptions about the relationship status of these men. The demographics included were Now married, except separated, Never married, and Separated. These were my three main avatars.
Education
The fourth included Males, With earnings, and who were High school graduates. This is my “catch-all” avatar. The real total addressable market for my product is probably between this population and the total of the three mentioned above.
The main difference between the three main avatars had to do with education. I assumed that men who were single might be more likely than married men to purchase a product such as this, I lowered the EDUCATION ATTAINMENT to Some college or associate’s degree.
Defining a target market with business plan demographics
Be sure to download your own copy of the workbook used in this post. Just fill out the form at the top.
What other sources would you use to find demographic information for your business plan?
How about the avatars? How would you have screened them further?