Customer profitability is measured by subtracting allocated costs from customer revenue.
The trick is to logically allocate costs – specifically Selling, General, and Administrative expenses. Understanding your customer profitability will help you make better decisions. For instance, what new customers to target and which of your current customers to part ways with. Having more good (and less not-so-good) customers will make your life as a small business owner more enjoyable.
Download a copy of the Customer Profitability workbook
Complete the form below and click Submit. Upon email confirmation, the workbook will open in a new tab.
Why is it important to analyze customer profitability?
You’re probably wondering if some of your small business’ customers are unprofitable.
In the back of your mind, you know that some customers are better than others. Some customers are a huge headache and don’t bring in that much revenue. Others are a pleasure to do business with and drive the majority of your revenue.
It’s more than just revenue
Sure, you have an inkling of which customers are good and which are… not-so-good. But until you run the numbers, you’ll never know.
What you find might surprise you. Maybe the customer who’s a huge headache is worth it? Or, maybe the customer who seems ideal is actually unprofitable?
Revenue is the starting point. But customer profitability has as much to do with costs as it does revenue.
Build a better business with a customer profitability analysis
By understanding which of your customers are the most profitable, you can make better decisions in the future.
You will have a measurement to decide if you need to dedicate more time and resources to certain customers. Or, if you need to fire them.
Your “ideal customer” will become clearer. This will allow you to focus your marketing toward other “ideal customers.”
Also, by getting rid of not-so-good customers, you’ll likely save a huge emotional toll on yourself and your employees. Work will become more pleasurable. Which, in turn, can only help you achieve your vision for your small business.
How does a business measure customer profitability?
You know that profit = revenue – expenses. So, customer profit must equal customer revenue – customer expenses.
Customer revenue is easy enough. Your accounting software should be able to provide you with a report that tells you what you sold to who. If not, that’s Job #1 – to piece together this information or start measuring it going forward. You can’t measure customer profitability without it.
If you’re following along in the Customer Profitability workbook, you can enter customer names in row 5 of the Customer Profitability worksheet. Additionally, enter Customer revenue in row 7.
Also, for the sake of consistency, I would advise you to enter a Start and FinishTime period. This goes in cells C3 & D3 respectively. These dates won’t affect any formulas. They will, however, help ensure that your revenue and costs are compared consistently.
Costs of Goods Sold/Cost of Sales
Cost of goods sold (COGS), also known as Cost of sales (COS), are the costs your business (more or less) directly incurred to deliver that product/service to the customer.
Again, your accounting software probably captures this for you in a report somewhere.
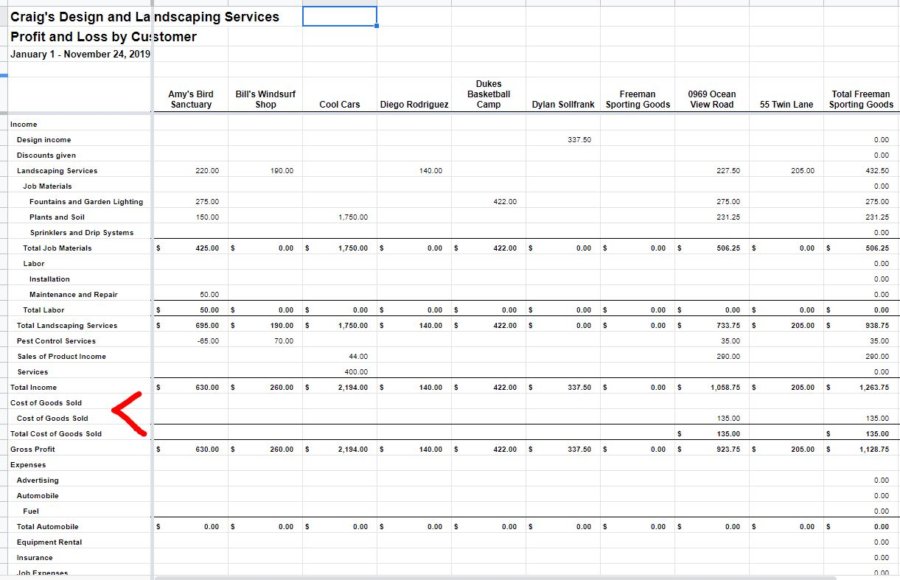
QuickBooks Online captures this information in a report called Profit and Loss by Customer. It can be found by navigating to Reports (left menu) > Standard (tab) > Business overview (section).
Here’s what that report looks like when downloaded into a spreadsheet:
Credit: qbo.intuit.com Click to enlarge
Based on how you set up your customers and products/services in QBO, your COGS will automatically be recorded in this report. That’s a big chunk of costs right there! Customer Gross Profit is taken care of.
What if you don’t have a report that totals customer revenue and COGS?
You can estimate these totals with the Customer Rev/COGS (Optional) worksheet. It will just take a little more legwork.
First, list all your Products/Services in column B. Then for each Product/Service list the average Price you sell it for. Also, the average Cost.
Again, I’ll try not to get too technical. “Cost” in this case, includes material, labor, and overhead. The total costs incurred to produce one Product/Service. If you’re unsure whether to include a particular expense, leave it off. It can always be allocated on the Customer SGA Allocation worksheet.
After you’ve listed Products/Services, Price, and Cost, then you’ll want to enter the QUANTITY PURCHASED by each customer.
At the bottom, you’ll see Revenue and COGS by customer summed. These amounts can then be entered on the Customer Profitability Worksheet. They won’t carry over automatically because this worksheet is optional.
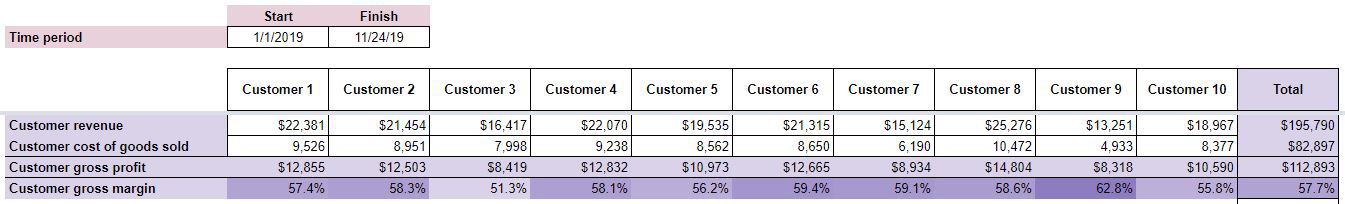
With Customer revenue and Customer cost of goods sold entered, Customer gross profit and gross margin will be calculated. Your Customer Profitability worksheet should look something like this:
Click to enlarge
The shading of the Customer gross margin cells will change slightly to highlight those customers with the highest gross margins.
What about Selling, General, and Administrative expenses?
Everything up until this point has been fairly intuitive. This is where the good customers get separated from the not-so-good, though.
Selling, General, and Administrative (SGA) are those expenses that are not directly tied to any individual Product/Service. This is why you don’t see these expenses included in the QBO Profit and Loss by Customer report.
But, these expenses are very real. They are (or, at least, should be) necessary to serve your customers. So, they should be accounted for any time you speak of “profitability.”
How do you allocate these expenses to individual customers though?
You can think of each type of Expense as a pie. It’s up to you to decide on the most appropriate way to slice that pie for each customer. There are no wrong ways to slice that pie. Some are just better than others.
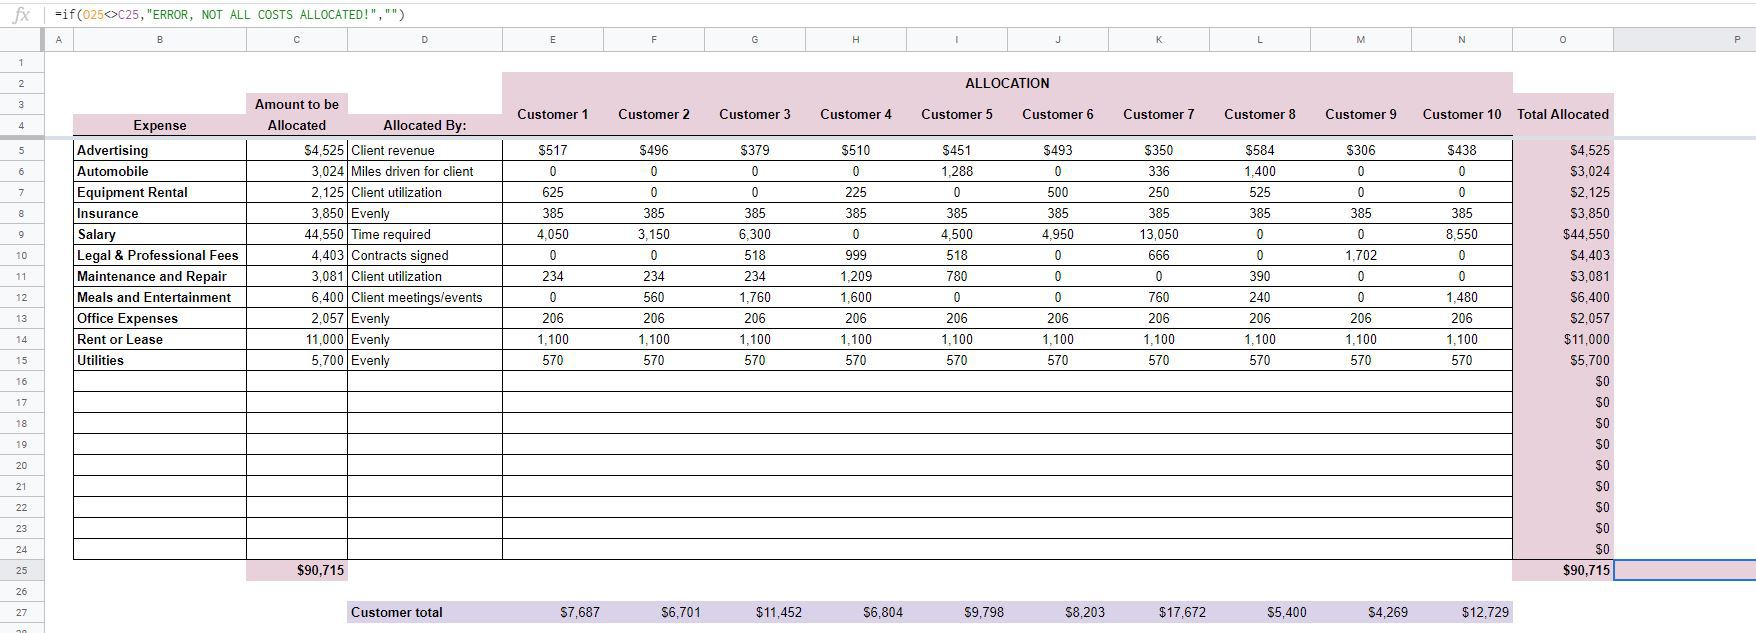
Start by listing Expenses in column B on the Customer SGA Allocation worksheet. Break them down into as much detail as you’re comfortable with.
For each Expense, enter an Amount to be Allocated in column C. Remember to stick to the Time period specified on the Customer Profitability Worksheet. You don’t want to allocate too much or too little.
Drivers – slicing the pie
Now, comes the creative part…
Think about what drives that Expense. Specifically, what the customer does that makes that Expense increase.
For example, Automobile expenses could be allocated by the number of miles driven for a client. Meals and Entertainment could be allocated by the number of meetings and events you took part in with the client.
Again, there are no wrong answers here because there are (usually) no perfect ways to slice the pie. Use your best judgment. If you completely draw a blank, you can always allocate that Expense evenly across all customers.
Try not to do that if at all possible, though. It’s the allocation of these costs that really separates the profitable customers from the unprofitable ones.
Back to the Customer SGA Allocation worksheet.
Enter the method of allocation in column D. Then, for each customer, break the Amount to be Allocated down in that manner. The Total of that breakdown (column O) needs to equal the Amount to be Allocated.
If all of the Totals don’t match, you’ll see an error message in cell P25.
Customer SGA expenses are totaled at the bottom and carried over to the Customer Profitability Worksheet.
Your completed Customer SGA Allocation worksheet should look something like this when you’re done:
Click to enlarge
The final product
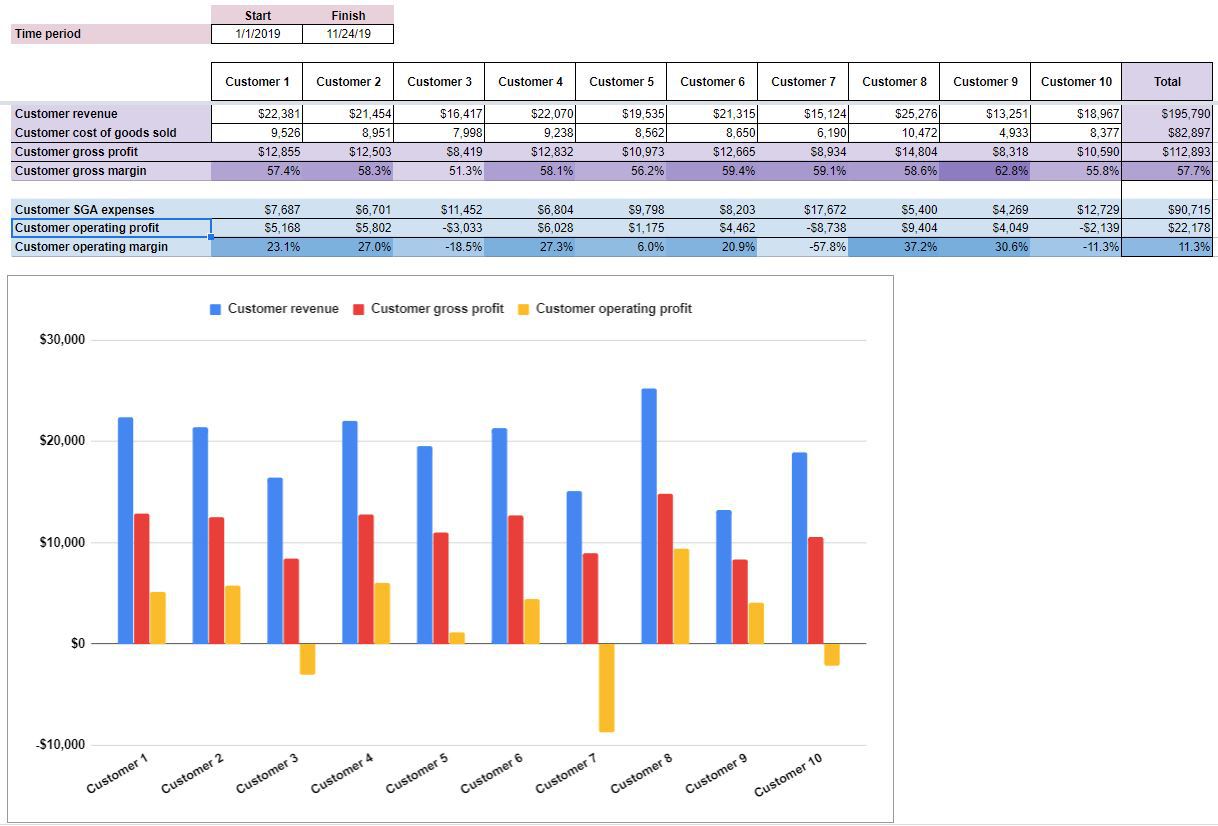
If you look back at the Customer Profitability Worksheet, you’ll see that Customer SGA expenses are subtracted from Customer gross profit to give you Customer operating profit. Aside from taxes, this is essentially your bottom line for customer profitability.
Customer operating margin is also displayed. Again, the shading in these cells will change to highlight those customers with the highest operating margin.
A chart, comparing your customers is also included to help with understanding.
Your final product should look something like this:
Click to enlarge
How to improve
Good news! The first step to improving customer profitability is to understand it. After using this workbook, you should have a better understanding of customer profitability.
Next, look for common themes among your best (most profitable) customers. Is there anything they have in common?
How did you acquire these customers? Can you replicate it?
Can you do more business with these customers? You don’t want to grind on your best customers too hard. But, are there any more of their problems you can fix with your solutions?
Don’t just look at your customers either. Look into the mirror a little bit too. Is your company making some customers not-so-good? This might not be comfortable. But, some introspection could help you convert some of those not-so-good customers to the light side.
If some of the not-so-good customers are hopeless though, you might have to fire them. This can be a delicate situation. However, sinking money into customers that you don’t even enjoy dealing with is destructive. Do your homework on the best way to do so and let them be someone else’s problem.
Download the free template by filling out the form below
Categorize and list detailed expenses
Forecast revenue needed to cover expenses
Review the pro forma income statement and ratios
Plan for the best and worst-case scenarios
Download the church operating budget template
Complete the form below and click Submit. Upon email confirmation, the workbook will open in a new tab.
Operating budget example for small churches, big churches, and every church in between
This is the second post on church budgeting and the fifth overall on church strategic planning.
Previously, the capital budget for the church was covered in depth. This post will focus on the operating budget. The capital budget, if you’ll remember, is the budget that the church completes for every potential project it plans to take on in the coming year. The operating budget consists of a forecast of revenue and expenses for the coming year. The culmination of the operating budget is a pro forma (or expected) income statement.
After completion of the capital budget and the operating budget, the church will be ready to tackle the financial budget. The financial budget will be covered in the next post.
What is an operating budget for a church?
An operating budget allows a church to be proactive regarding its revenues and expenses for the coming year. It allows the church to plan accordingly and to be ready for any scenario that might come its way. Doing so will allow the church to better meet its mission.
Information gleaned from the mission statement, SWOT analysis, strategy formulation, and capital budgeting will all play a part in preparing the Operating Budget for the coming year.
Creating an operating budget can be as simplistic as writing down a guess about how much revenue the church will make in the coming year and the number of expenses it will incur. This is better than nothing.
Dedicating some thought to each revenue source and each type of expense, plus estimating how they might rise or fall over the course of the year helps to paint a more accurate picture of the church’s financial position. Additionally, using the Spreadsheets for Business church operating budget template will give you the ability to not only estimate what the most likely scenario to play out next year will be, but will also help you to plan around a best case scenario and a worst case scenario.
Download the template by filling out the form at the top of the post.
How much time and effort should be dedicated to a church operating budget?
Any amount of planning is better than no planning. There is, however, such a thing as over-planning – AKA, paralysis by analysis. The sweet spot is somewhere in the middle – enough planning for you to feel confident that your church is in a position to thrive in the coming year.
The amount of thought you dedicate to each item in this church operating budget example is up to you. I urge you not to overthink it. However, after going through the following steps, I think you’ll find yourself rather confident about your church’s future going into the new year. With some of the worry off your plate, you can focus on other areas that will help your church achieve its mission.
How might an operating budget for a church differ from a for-profit business?
Fortunately, creating an operating budget for a church is much less complicated than for, say, a manufacturing company.
When creating an operating budget for a manufacturing company, you start with revenue and work your way through budgets for materials, labor, overhead, production, and a lot of other inputs.
When creating an operating budget for a church (which is essentially a service) some of that complication can be avoided.
Should you start with budgeting for revenue or expenses?
Personally (and maybe this is due to my background in budgeting for manufacturing organizations), I still think it’s smart to start budgeting with revenue. That way, you know how much you expect to make in the coming year and can plan your expenses around that information.
However, there’s also a school of thought, particularly by Aubrey Malphurs and his organization, that claims you should plan your expenses first. Then, you know how much you need to bring in to cover those expenses. Aubrey is much more of an expert on church operations than I am, admittedly. I can see the rationale behind this school of thought.
You should start with whichever you’re more comfortable with – expenses or revenue. I imagine as you get deeper into the process of forecasting, that you’ll be bouncing back and forth between the two anyway. So, ultimately, what you start with won’t matter. Unlike a manufacturing company, the levels of your revenue and expenses won’t necessarily affect each other. All that matters is what you end up with.
Look, your budgets are never going to be exactly right. That’s fine. What’s not fine is going into the coming year with a church that is at risk because you haven’t dedicated adequate thought to what the coming year may bring.
An operating budget won’t guarantee that your church will be successful. That’s why you shouldn’t spend every waking second working on it. It’s just a matter of giving appropriate thought to the matters of revenue and expenses.
The Pareto Principle states that 80% of outputs come from 20% of inputs. If you buy into this – 80% (or so) of the benefits of creating an operating budget for your church will probably come from the first 20% of the time that you spend on it. What this means, of course, is that by merely dedicating a tiny bit of thought to these matters, your church will reap big benefits.
How to create an operating budget for your church
Operating budgets look complicated, but at their core, they’re fairly simple. All you’re going to be doing is estimating your expenses, estimating revenues, and then filling in a couple of other details. There are no wrong answers. As a steward for your church, you’re in a better position to answer these questions than anybody else on Earth.
Let’s get started!
Your church’s expenses
Obviously, your church has costs that it incurs to provide needed support to its membership. Again, I have to give credit to Aubrey Malphurs for the framework of how expenses are grouped together.
Expenses are grouped into four broad categories: evangelism/missions, personnel, ministries, and facilities.
Within each broad category, each Expense is broken down into more specific categories and beyond that, into greater Detail.
So, depending on how organized your accounting is, you should be able to (hopefully) begin by breaking your existing expenses down into these four broad categories. Once you’ve done that, then you can begin to group similar expenses by subcategories. Then eventually, of course, you want to budget for every detailed expense.
Classifying expenses as fixed or variable
Along with every Expense in a subcategory, you’re going to classify it as fixed or variable. This sounds like a pain in the rear, but it’s good to understand the nature of each cost.
Fixed expenses, as the name implies, don’t change with revenue. They’re going to be the same whether you have a very busy year or a year where you just sit around twiddling your thumbs. For example, salaries are fixed and insurance is fixed. Any other expense which will be the same month after month, over the course of the year, is fixed.
Variable expenses, on the other hand, change. They typically change based on the level of revenue. If revenue goes up, variable expenses also go up. If revenue goes down, variable expenses would probably go down. For example, expenses related to outreach and local mission work might depend, in large part, on the amount of revenue received. So they can probably safely be classified as variable.
There’s no right or wrong answer when it comes to classifying your costs as Fixed/Variable. Some will be obvious, while others…not so much. Again, don’t dwell too much on this classification. Give it a little thought and select what you think is appropriate. The only real effect is on some of the ratios that are calculated once the budget is completed. You can always go back and change your classification.
Use the past to plan for the future
You can refer back to historical amounts, of course, to help with the forecasting of future expenses. In fact, that’s probably a very smart thing to do. Looking back at historical amounts paid will also help you to determine if an expense is fixed or variable.
If this is your first time completing an operating budget such as this, then I would suggest that you still break each expense down into broad categories (evangelism/missions, personnel, etc.). But, maybe don’t break them down into too many subcategories (district & synod support, convention assessment, etc.). And, definitely don’t overdo it breaking expenses down into detailed categories (detail expense 1, detail expense 2, etc.). You can always go into more detail next year.
On each of the broad category budget worksheets, you’re going to start at the top and list each Expense subcategory. Also, pick either Fixed or Variable from the drop-down menu.
In the bottom section – this is where you’ll break the subcategories down into detailed expenses. All of the detailed expenses will sum for the month and that amount will be carried back to the top
Let’s look a little deeper into each broad category.
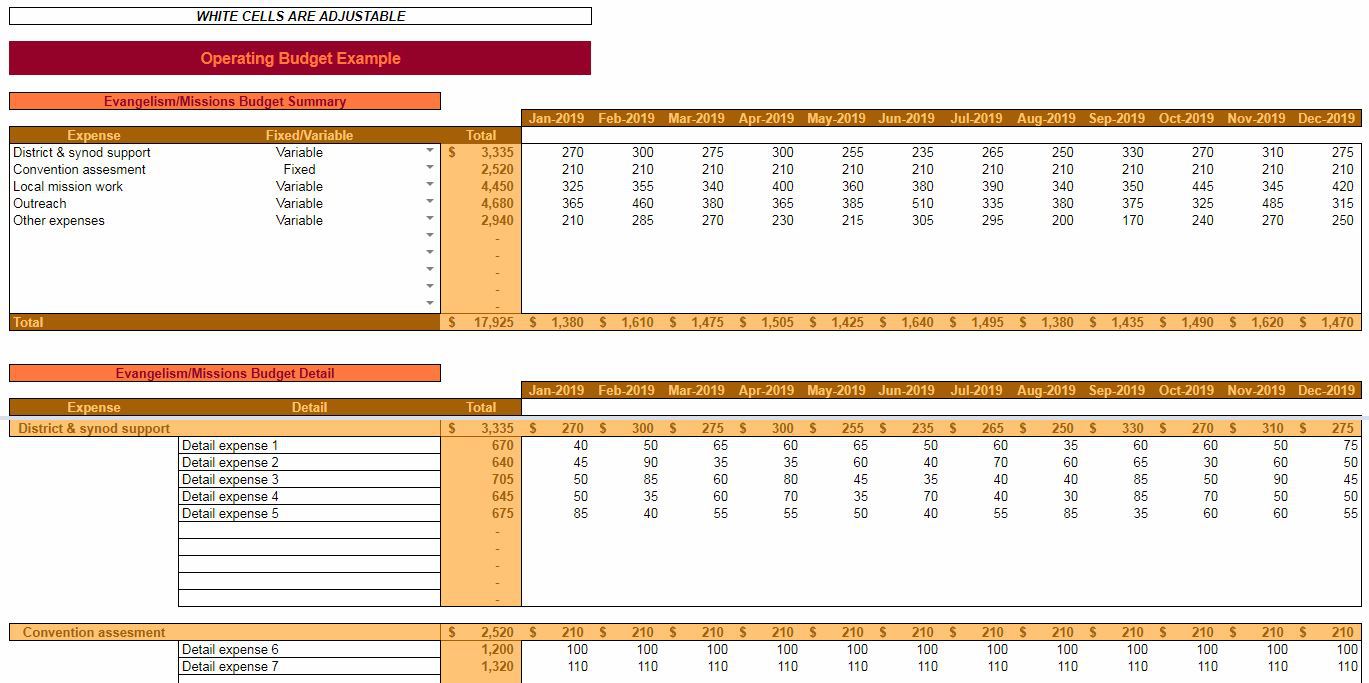
Evangelism/Missions Budget
Click on image to see a full-size version in a new tab.
The Evangelism/Missions Budget is where you’ll classify expenses related to efforts directed externally from the church to reach individuals who likely aren’t members.
Next, go to the detail section and itemize the subcategory expenses. Additionally, start forecasting month by month for the whole year. Each subcategory will automatically add all the detailed expenses.
You’ll see that a Total for each month and for whole the year is calculated. These amounts will carry over into other worksheets.
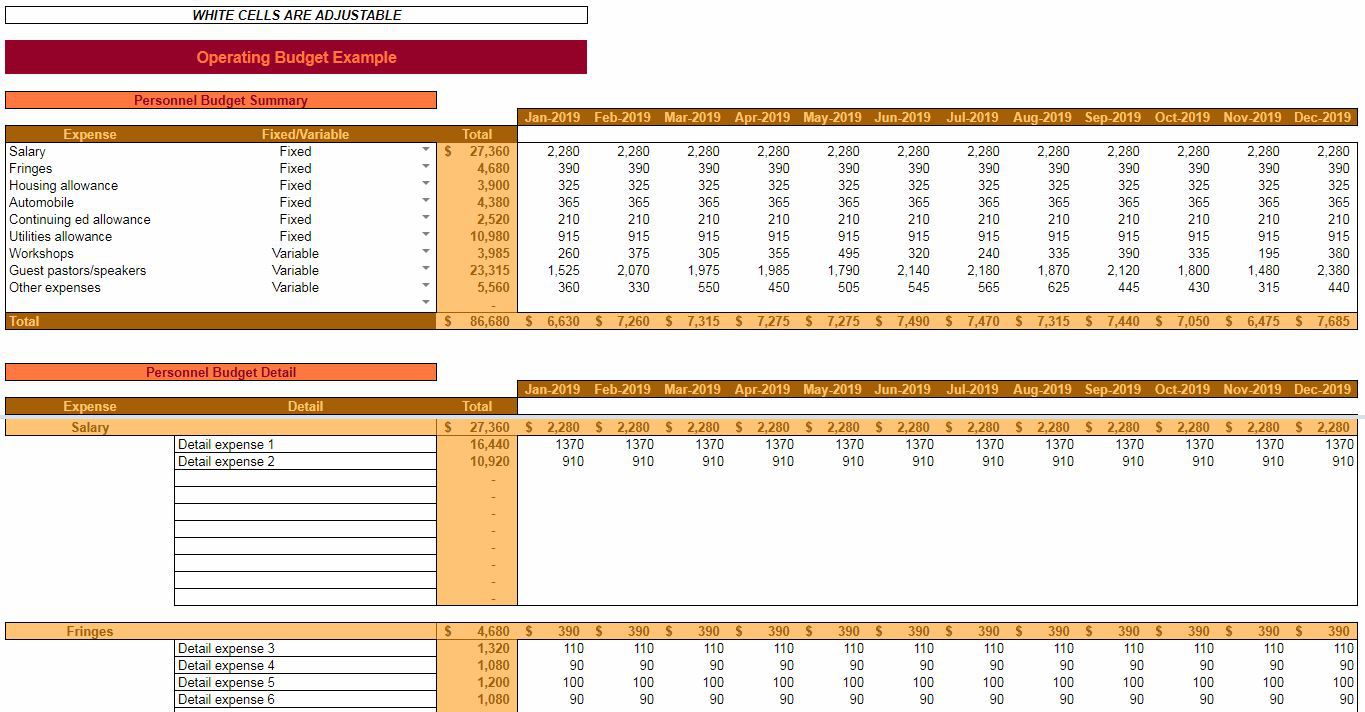
Personnel Budget
Click on image to see a full-size version in a new tab.
The Personnel Budget is pretty self-explanatory. This is the money planned to be spent on the individuals who help run your church.
Expenses such as salaries, fringes, utilities for housing, and guest pastors/speakers would be entered here.
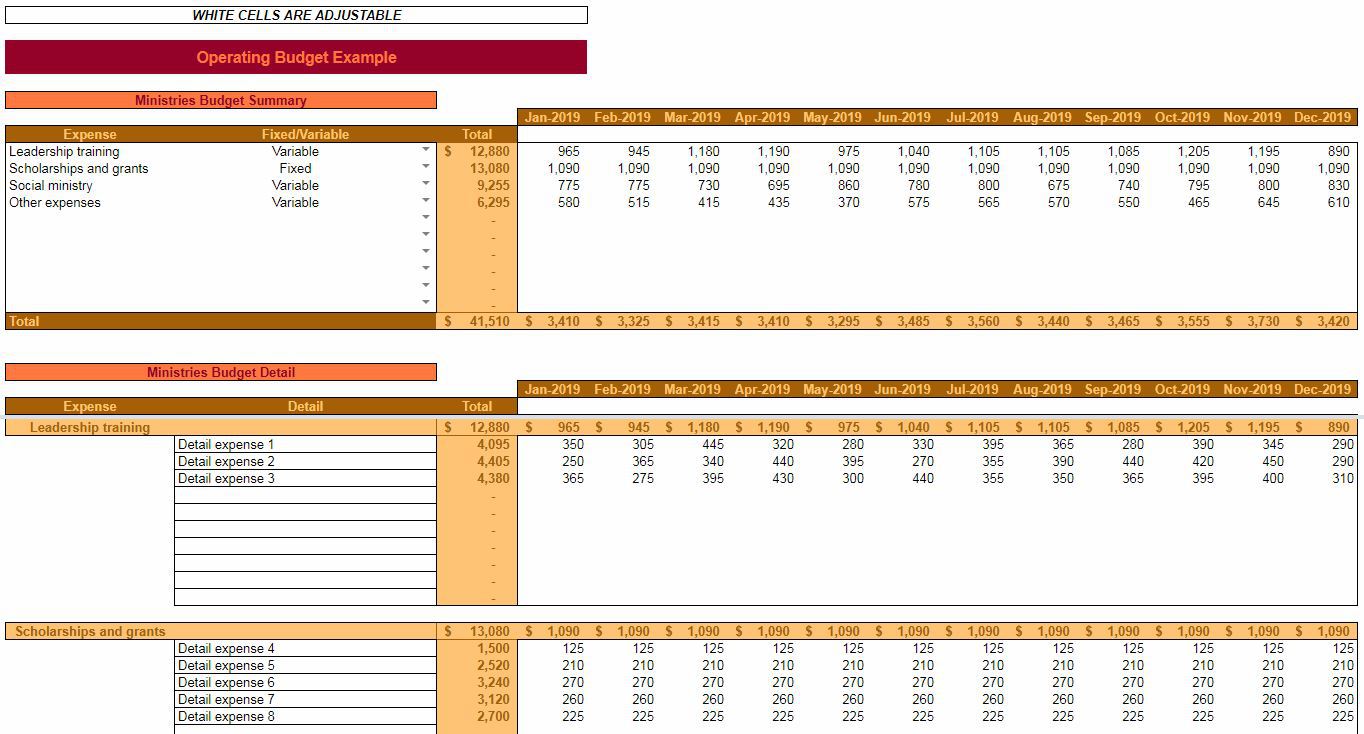
Ministries Budget
Click on image to see a full-size version in a new tab.
The Ministries Budget is where you will enter expenses directed toward the individuals that are already a member of your church.
You know the drill by now – enter the appropriate subcategories and then the names and amounts for the detailed expenses.
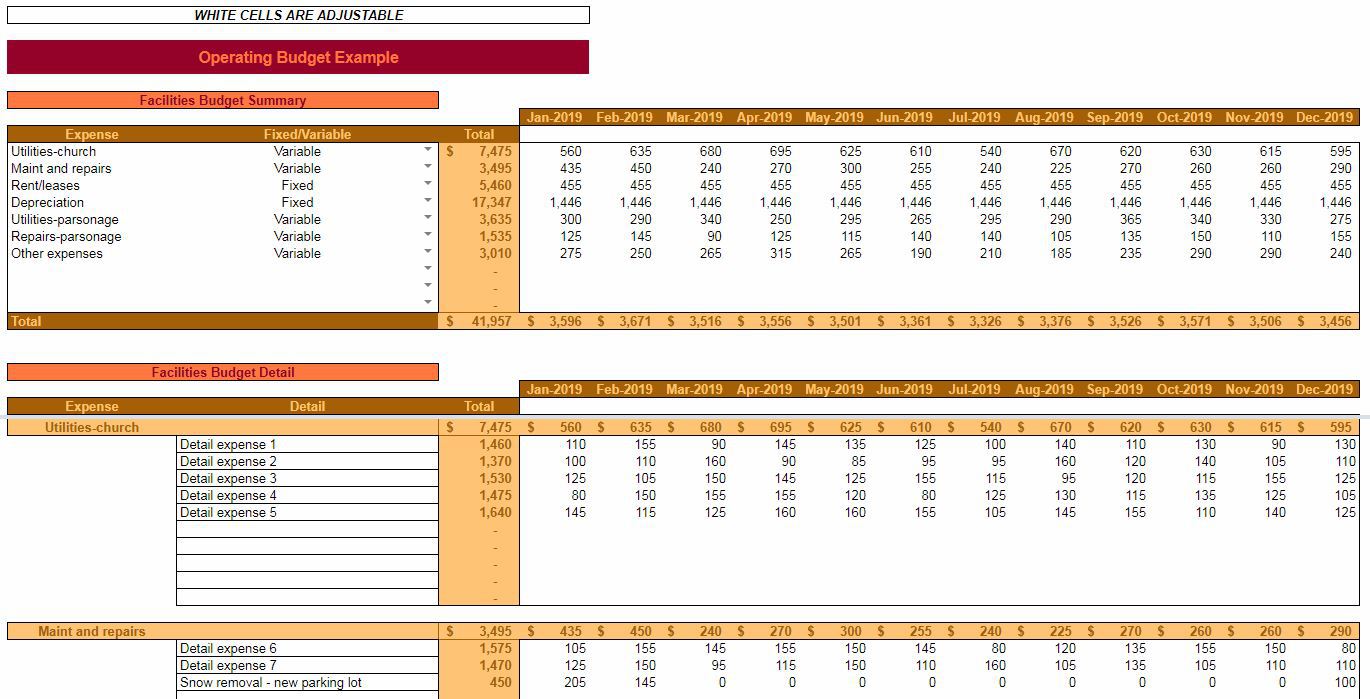
Facilities Budget
Click on image to see a full-size version in a new tab.
The last category of expenses is also pretty self-explanatory. A Facilities Budget includes those expenses that are required for your church, as a whole, to function.
How do you differentiate if expenses are for personnel or facilities? Easy, if the expense is, more or less, for one employees’ benefit then it’s probably a personnel expense. Conversely, if an expense is for everybody’s benefit then it’s probably a facilities expense.
As mentioned before, this is all somewhat subjective. There are no right or wrong answers, per se. Trust your gut, trust your experience, and classify expenses in whatever way makes the most sense to you.
If you’ve been following along closely, you’ll notice a special expense listed under the maint and repairs subcategory.
In the capital budget, we examined the feasibility of adding on to the church’s parking lot. Ultimately, based on the expected cash inflows and cash outflows, it was determined that making an addition to the parking lot was in the church’s best interest. So, in our hypothetical church, that project will be undertaken and will need to be included in the coming years’ operating budget. You’ll see detailed expenses related to the parking lot under the maint and repairs subcategory and the depreciation subcategory.
Don’t solely rely on what you spent in the past to create a feasible budget going forward into the future. Make a note of anything that might change and of any new expenses that might be incurred in the coming year due to projects approved in the capital budgeting phase.
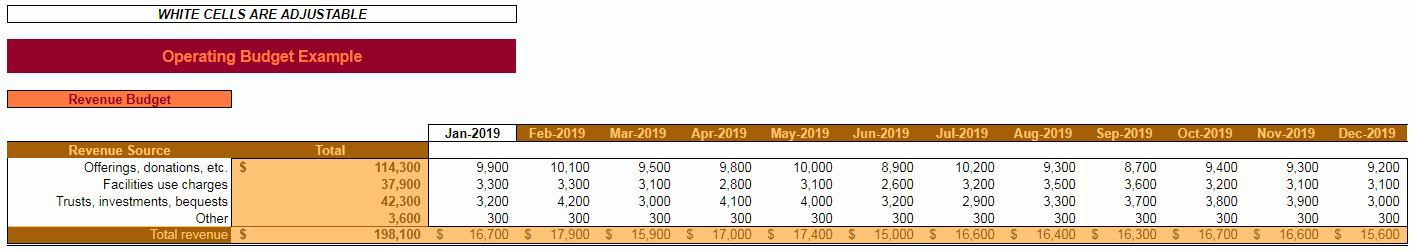
How much revenue will you need to cover those expenses?
Click on image to see a full-size version in a new tab.
Estimating expenses is a bit depressing. But now we get to tackle the fun part, and that is estimating revenue.
Revenue also has subcategories, but they are not broken down into detail.
By now, you know the routine. In the Revenue Budget, enter the start date for your budget in the cell D9.
You’ll see that the Revenue Source column is already populated but you’re welcome to change the descriptions as you see fit.
For each month and each Revenue Source, enter the forecasted amount of revenue. A Total for the months and for each Revenue Source will automatically be calculated.
Maybe you’re baffled as to how to forecast revenue. Offerings and donations are probably at least somewhat consistent. But, other sources of revenue like facilities use charges and trusts, investments and bequests are difficult, if not nearly impossible, to accurately predict.
First of all, I’ll say the same thing I did when it came to forecasting expenses, and that’s to just come to terms with being wrong in the first place. The value in this, again, is to dedicate a little bit of thought to it.
Spreadsheets for Business has a free tool that can help you forecast revenue (or expenses, or anything really…) accurately and it can also help you gain insights into what drives revenue.
Once the information is entered into the Revenue Budget, then you are very nearly done with the operating budget.
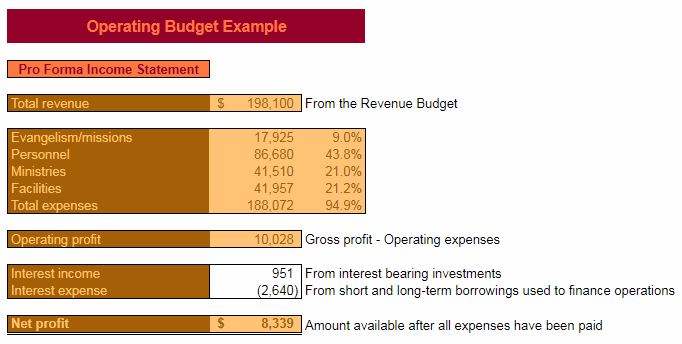
The church’s Pro Forma (expected) income statement
After completing all of the expense budgets and the Revenue Budget, you should see a nearly completed Pro Forma Income Statement. All that’s left to enter is information about interest.
If your church keeps funds in an account that pays a reasonable amount of interest, enter what you might expect to earn this year in the Interest Income field.
On the other side of the coin, if your church borrows money, then you will likely have Interest Expense over the course of the year. That amount in the Interest Expense field should be added as a negative amount.
Now you should have a pretty reasonable idea of what the coming year will look like from a revenue and expense standpoint. Notice that each of your expense categories has the amount as a percentage of Total revenue listed next to it. This gives you an idea of how your expenses are weighted.
For reference, Aubrey Malphurs recommends the following weightings:
Evangelism/Missions 10%
Personnel 40%
Ministries 25%
Facilities 25%
Obviously, your church doesn’t have to have this exact percentage for each expense category. But it simply gives you a benchmark to measure your church against.
All the calculations in the Pro Forma Income Statement are pretty straightforward. Operating Profit is Total Revenue –Total Expenses.Net Profit is what’s left after Interest Income and InterestExpense are accounted for.
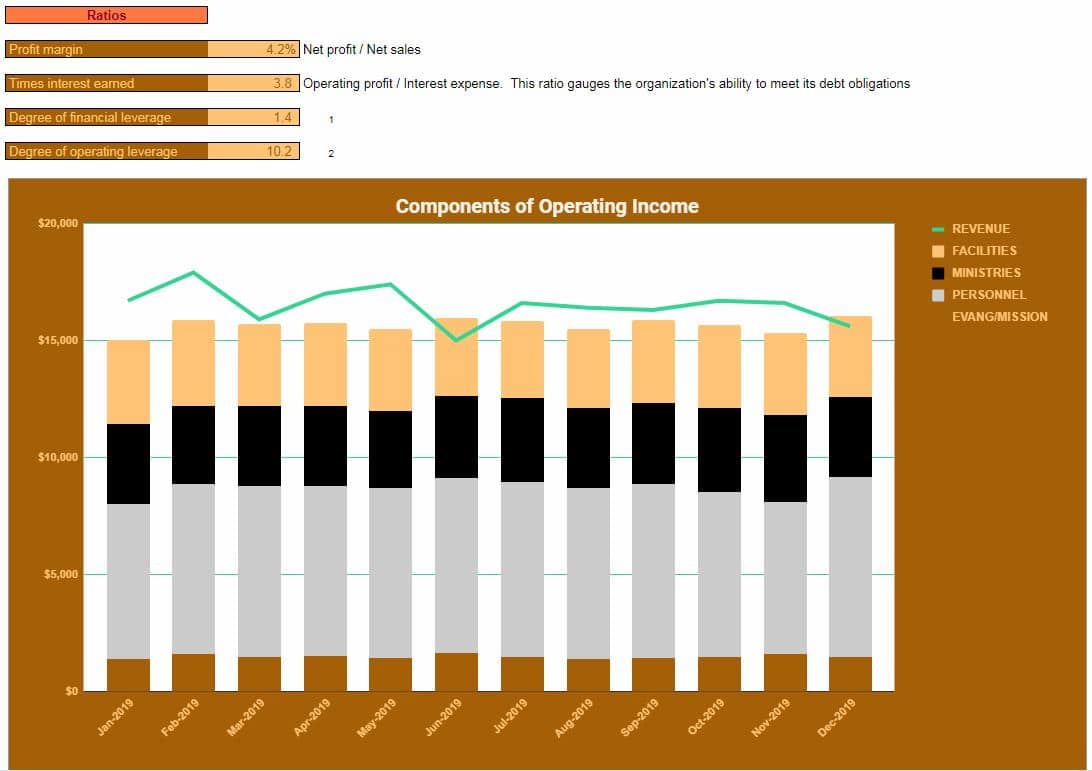
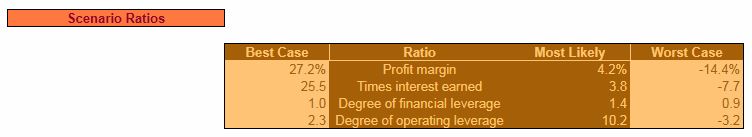
Ratios and chart
Click on image to see a full-size version in a new tab.
Now we’ll look at some very basic ratios to put the Operating Budget into perspective. These ratios were designed for, and are primarily used by, for-profit businesses. But even though a church operates differently than a for-profit business – especially a manufacturing company – they still might provide a little insight and perspective for the church leaders to use in decision making.
Profit margin
Profit Margin is pretty straightforward. It’s just Net Profit ÷ Total revenue. It shows you, in percentage terms, how much revenue you bring down to the bottom line.
Times interest earned
Times Interest Earned is a ratio that focuses on your ability to cover your interest payments.
Obviously, if an organization borrows money it needs to be able to meet the additional obligations placed upon them. So Times Interest Earned shows you, by taking Operating Profit ÷ Interest Expense, how many times over your church can cover its Interest Expense.
Degree of financial leverage
The Degree of Financial Leverage shows the amplification that borrowing money can provide to profits and losses. So, for instance, in the example operating budget, the Degree of Financial Leverage is 1.4. This means, at this level of borrowing, that for every 10% change in Operating Profit, Net profit would increase by 14% (10% × 1.4).
That sounds great, but the opposite is also true. If Operating Profit declined by 10%, then this level of borrowing would cause Net profit to decrease by 14%. That’s the nature of leverage. It amplifies gains and losses.
Most people can pretty easily grasp the nature of financial leverage.
If you borrow money and get to keep the gains from the borrowed money, then financial leverage is great. If you borrow money and your investment loses value, then you not only have the loss to deal with but you also still owe for the money you borrowed.
Degree of operating leverage
What’s not so easy to grasp is the benefits and detriments of other fixed costs, besides interest payments. The Degree of Operating Leverage quantifies the benefits and detriments of incurring fixed costs.
Why are fixed costs so important? Well for lack of a better answer – because they’re fixed. You are going to pay them anyway. So, if fixed costs really help you ramp up your operating profit, then that’s great. Because fixed costs aren’t going to increase on you.
The inverse is also true. Since fixed costs don’t change, you still have to pay them even if they are dragging operating profit down.
The Degree of Operating Leverage tells the same story as the Degree of Financial Leverage in the sense that it tells you how much greater Operating profit (not Net profit per se) would have been in the absence of fixed costs. This ratio really starts to get into detailed management accounting. That amount of detail is probably beyond the scope of this post, but since it’s included in the Executive Summary, I wanted to touch on it briefly.
In the example workbook, the Degree of Operating Leverage Is 10.2. This means then that a 10% increase in Total revenue, everything else being equal, would translate to a 102% increase in Operating Profit. Obviously, you know what that means if Total revenue went the other direction. It means that a 10.2% decrease would put Operating Profit in the red.
More about degrees of leverage
There is no good or bad Degree of Financial Leverage or Degree of Operating Leverage. It’s simply a reflection of the way your costs and borrowing affect your income statement. Leverage is great if Total revenue and Operating Profit are increasing. Leverage is bad if the outlook for the coming year is bad. So if your leverage is high and you’ve got concerns about your ability to bring in revenue for the coming year – then you’d better start looking to reduce fixed expenses and Interest Expenses.
Finally, at the bottom of the Executive Summary, you’ll see a handy chart that will illustrate the level of revenue and expenses (broken down by broad category) for every month in the upcoming year. This allows you to visualize how all these factors, which affect the financial health of your church, are expected to fluctuate throughout the year.
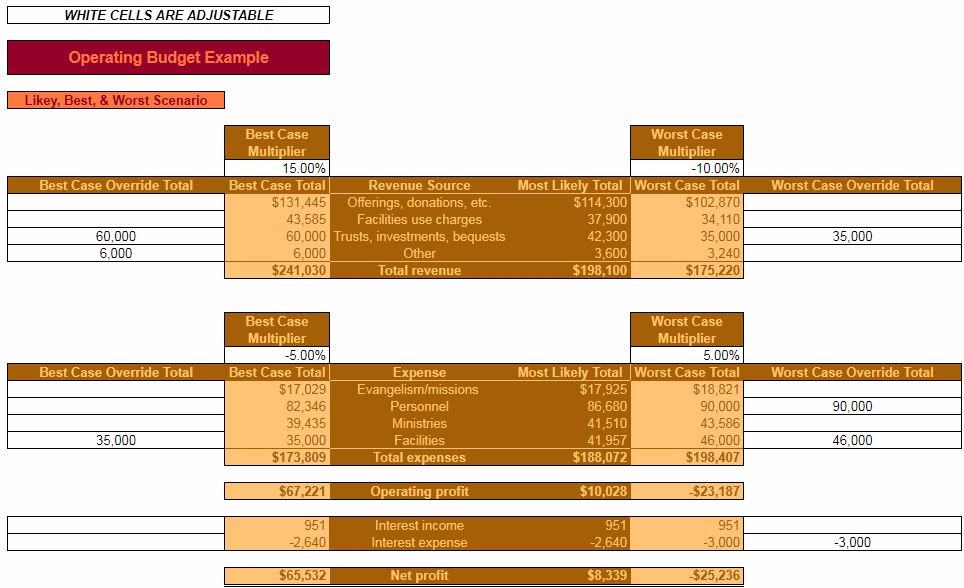
Plan for every scenario your church might face
Say that creating a simplistic operating budget is working at level 1 out of 10. Completing the Spreadsheets for Business operating budget template takes you up to 7 out of 10. This next section is what will push your church up to a 10 out of 10.
On the Likely-Best-Worst Scenario worksheet, you’ll see all the information pulled in from your Pro Forma Income Statement and the subsequent ratios under the Most Likely Amount column. But, what you will have the opportunity to do here, is to imagine multiple scenarios – some good, some bad. You’ll get to picture what your Pro Forma Income Statement will look like in the best-case scenario and the worst-case scenario.
Better or worse than expected revenue and expenses
Click on image to see a full-size version in a new tab.
To use this valuable worksheet, all you need to do is start with a multiplier for the best case and worst case. Obviously, the best case for revenue is going to be a positive percentage, and for expenses, a negative percentage.
On the other hand, of course, the worst case for revenues is going to be a negative percentage, and for expenses, a positive percentage. Here, you are going to have the opportunity to play around with positive and negative future outcomes, and see what feels right in terms of multipliers for revenue and expenses.
But beyond simply entering a Best Case Multiplier and a Worst Case Multiplier for revenue and expenses, you can also refine the scenarios even further. You do this by entering specific amounts in the Best Case Override Amount and Worst Case Override Amount.
What are override amounts?
It means that you can tweak the dollar amounts for revenue and expenses even further. For instance, maybe you hope that your church might be blessed with an extraordinarily high amount of revenue from trusts, investments or bequests. You can thus enter a specific amount in the Best Case Override Amount for whatever would constitute the “best case” for your church.
On the flip side, say you know that, potentially, the worst case scenario for facilities expenses is that you need to replace the church HVAC system. So, you enter an adjusted amount in the Worst Case Override Amount for facilities that reflects this added expense.
You can also tweak the override amounts for Interest Income and Interest Expense.
At the very bottom, you’ll see the effect on the ratios from the Executive Summary based on what you entered for the Best Case and Worst Case Multipliers and Override Amounts.
There’s an old saying that goes, “hope for the best, but plan for the worst”. With this scenario planner, you’re able to do just that. You’re able to protect your church from contingencies while being prepared to act accordingly if the coming year is full of blessings.
Church operating budget
Maybe all of this seems overwhelming. That’s understandable if you’re not accustomed to planning with this level of detail. Again, I urge you (as the creator of this “overwhelming” budgeting template) to not overthink it.
What I do urge you to do however is to download the template at the top of the post – and to boldly use it.
Go over it once, quickly filling in the information you have handy, then walk away from it. After that, come back to it, look at it, reflect on what you’ve already entered and make any changes you feel are necessary. Then walk away from it again.
This is (for lack of a less cliched term) “a living document”. It is designed to take the relatively simplistic information of your forecasted revenue and expenses and to do the hard work of providing valuable output. That will allow you to be proactive for the coming year and give you confidence as a leader of the church. It can help your church not only stay financially solvent but also fulfill its mission and achieve its goals.
What other (sub) categories of revenue and expenses would you include?
What percentages and amounts would your church enter to prepare for worst and best-case scenarios?