How do I make an inventory list and other spreadsheets for my restaurant?
Spreadsheets serve as a great complement to, or replacement for, the other software a restaurant might rely upon. Spreadsheets can handle nearly any task you require of them. They are very versatile. Small restaurants, with a limited software budget, might find them particularly useful.
The author states that a computer is “Second only to a good set of knives”. And spreadsheets are “the cat’s meow.” They can help a restaurant with organization.
Spreadsheets can intimidate some people. But, they are only as complicated as you make them. It is suggested that you take a course if you must. Particularly if you want to take advantage of the power of formulas.
Spreadsheets will make your life as a restaurant manager easier. Once you take a little bit of time to climb the learning curve.
Spreadsheets can fill in gaps in functionality for pieces of software. Many POS systems and most accounting software will export to .csv format – which can then be imported into a spreadsheet.
Some of the things a restaurant can use spreadsheets for
Staff scheduling
Drop in pre-made shifts for each employee
Order sheets
Purchase orders for ingredients
Automatically calculate tax and totals
Vendor lists
A master list of all vendors with name, address, phone, and email
Keeping good documentation will help with financing. Good documentation provides detail about how and why your startup restaurant will be successful. Spreadsheets are an excellent tool for providing documentation.
The Funding Requirements section of your business plan is where you outline:
How much money your startup is going to need to begin operations and reach self-sufficiency
Whether you are seeking debt financing, equity financing, or both
Any other details regarding how the money will be used, how much will be returned to the financier(s), and when it will be returned
Unless you have a really big chunk of money saved up, you’re probably going to have to do what most other startups do – ask for money. Ultimately, the goal is, of course, to make the business self-sufficient. But, early on, if you want to scale up quickly, you’re probably going to have to leverage someone else’s money.
What would you want to know if you were giving someone money to start a business? Would you want to know how they’re going to use it? How they’re going to preserve it? How about how they’re going to build upon it?
Maybe you’re a lone wolf? You want to keep this operation as lean as possible. Particularly when it comes to people.
I can appreciate that!
Nevertheless, if you’re going to be funding this thing on your own, you still want to hold yourself accountable. You want a plan regarding where your money will be spent, and how you’re going to earn a return on it.
1) Capital, operating, and financial budgets
Starting a business from scratch is not so different from a decades-old business starting a new year. The required tasks are nearly the same.
Writing posts on, and making templates for, strategic planning topics is the foundation of this website. Capital, operating, and financial budgeting is critical to small business success.
The capital budget will specify any projects and/or large-scale assets you intend to buy. Plus, what kind of return you expect on that investment.
The operating budget is where you forecast your first one, three, or five years of operation. Your revenue, your cost of revenue, and your sales/administrative costs. An operating budget leads to the creation of a pro forma income statement.
Finally, your financial budget. This is your cash budget. It specifies when you think you’ll actually put money in your bank account from all those sales you’ll be making. It also specifies how you plan to stay solvent. This budget leads to the creation of a pro forma balance sheet and cash flow statement.
2) Determine funding need
All of the preceding budgets, particularly the financial (cash) budget, show where the money is going to be used. Once you compare the business’ cash needs to the cash you’re contributing, you’ll know how much is required from outside sources.
Budgeting will also show when and how the business is expected to make enough to support itself. Furthermore, other important milestones will be reflected. Milestones such as your first sale, your first $10,000 in revenue, your first $1 million in revenue(?), and so forth.
Can you see how these budgets will serve as a good measuring stick for your business’s launch and growth?
3) Funding details
Now that you know how much outside funding you’ll need to get off the ground, it’s time to really get into the nitty-gritty details.
Step one is to specify how much of the funding will be debt and how much will be equity. If you’re seeking equity investment, you’ll want to outline a proposal dictating what their investment will buy them. Also, how much power that equity investment will wield.
Another important point to clarify is the timeframe. For instance, things such as debt/balloon payments. If you’re really aggressive, there might come a point where you expect to cash out of the business and pay your equity holders
Whatever the case may be, you’re going to be clear about the status of the business at the end of the five-year forecast. Plans can change, of course, but you’ll want to include an exit strategy for those who are investing in you.
Finally, you should consider building on step one (budgeting) and clarify how the debt/equity funds will be used. Will it be for fixed assets, marketing, other operating expenses, or something else?
What are business funds?
Business funds are used by the business for their financial requirements. A business needs money to run. It is the oxygen that fuels its operations.
Starting a business is not cheap. To fund your new company, you’ll need some money upfront and this can be one of the first financial choices made by entrepreneurs when they start their own enterprise. But it’s also an important decision that could have lasting impacts on how your structure and run your business over time.
There are a variety of sources to turn to if you’re looking for small business funding. Capital may come in various forms like loans, grants, or crowdfunding.
Before you seek out funds, make sure to have a solid business plan and a clear outline of how the money will be used. Investors want assurance that their investments are being well managed so they can invest with confidence in the company’s future success!
What are funding requirements in a business plan?
This is what your entire business plan has been building up towards.
If you follow these steps for calculating funding requirements, don’t you think you’ll have an enormous amount of insight as you launch your startup?
This is the culmination of all the hard work you’ve put into your business plan thus far. Once completed, you’ll know how much money you’ll need, and what you’ll use it for.
Asking someone to invest in your business is like asking for a sale. Fortunately, if you’ve stuck with me this far you’re well prepared to write the funding requirement section of your business plan. I’m sure you’ll get what you need to be successful!
If you know the price of something, you can calculate the cost that will give you a 30% margin as follows: Cost = Price × 70% (1 – margin %).
In business, the very existence of an enterprise is determined by its profitability. Making a profit can be an elusive process, requiring a good understanding not only of the Cost of Goods Sold (COGS) but also the functions performed to sell the product or service.
There are many models that help define costs so that profit margins can be properly calculated. Choosing the best model is critical to establishing proper pricing levels. The math involved in calculating a 30%, 40%, or 60% margin isn’t the difficult part of the process. It is determining the right starting point that requires the most scrutiny and clarity.
Easy to Say But Hard to Do
The first thing to consider is – have all the relevant and pertinent costs been included in the final cost calculation? This is where many companies become confused and the process of determining costs can become quite complex.
Unless the true costs of a product or service are known, any calculation related to profit will not be accurate. This failure to incorporate all relevant costs could end up costing a company dearly.
It’s All About the Budget Baby!
Putting together the costs associated with a product/service includes much more than the obvious costs (material, labor). These are the beginning point for the calculation, but there are other areas that should also be included in the formula. Consider the following:
Invoice Amount
Does the invoice include any discounts for early payment or penalties for late payment? Those numbers should be included in the costing formula.
Handling Costs
If the item is delivered or picked up, there will be a separate cost involved in its transportation. There are also the costs associated with handling the item after its receipt like inventory and warehousing expenses.
Cost of Money
Products that sit on the shelf for an extended period of time have company money invested in them that is not producing at income while it is tied up in inventory. This is known as an opportunity cost.
Taxes
Like death, taxes are inevitable and the costs involved in paying taxes on inventory or property held at the end of a tax year can add to the product’s true cost. Inventory that turns quickly isn’t as much of a concern as inventory which takes a long time to get sold or used.
Overhead
This is always a loaded question with an explosive answer. What is overhead and how should it be allocated? Calculating overhead accurately is a science unto itself. Determining how to allocate it can be problematic at best.
Fudge Factor
Also known as “budget override” or “other costs.” This is an amount added to other costs to make sure nothing is left out of the calculated amount. In most cases, this is an additional 2% to 5% to help cover any unexpected changes.
Add It All Up and It Spells True Cost
The cost of acquisition, handling, overhead, and other considerations have been added up. A final total true cost has been determined. Now what?
With all that formulation and processing, the resultant number is one you can have confidence in. Now that we’ve looked over what the true costs are we can finally multiply it by 30%, 40%, 60% and there’s the sales price. Right?
No.
Markup is not the same as margin. But, more on that in a bit.
Price is what determines margin
Knowing the true cost is the first step, but now it’s time to look at the selling side of the equation. Here are some other factors to consider:
Cash Flow
Is the product or service sold and paid for immediately or does it go on an account for 30 days or more? Are there discounts offered for prompt payment or pre-payment of invoices? Will the buyer earn volume discounts for large orders or is a discount earned over time based on volume?
Associated Costs to Deliver
Sales programs offering free freight or trips to Hawaii for sales associates are additional costs that should be estimated when determining overall profitability.
Negotiation Protocols
Some companies state their prices and no one challenges those prices; other companies state a price but they know the customer will be negotiating the price based on different issues. Allowances should be made to include any fluctuations involved as a result of negotiating the price for the product or service provided.
After-sale Follow-up
Once the product or service has been delivered the costs associated with the transaction aren’t done accumulating. After-sale follow-up by customer service, warranty expenses, and product administrative costs like safety notifications or updates add up quickly and should be taken into account.
Inflationary Issues
Not all inventories are subject to inflationary conditions but many companies find themselves confronted by the costs associated with wider economic issues. Issues that could alter the costs of inventory or services. Construction, manufacturing, and many other industries are constantly facing changes in local, regional, and national economic conditions that affect their business at its most basic levels.
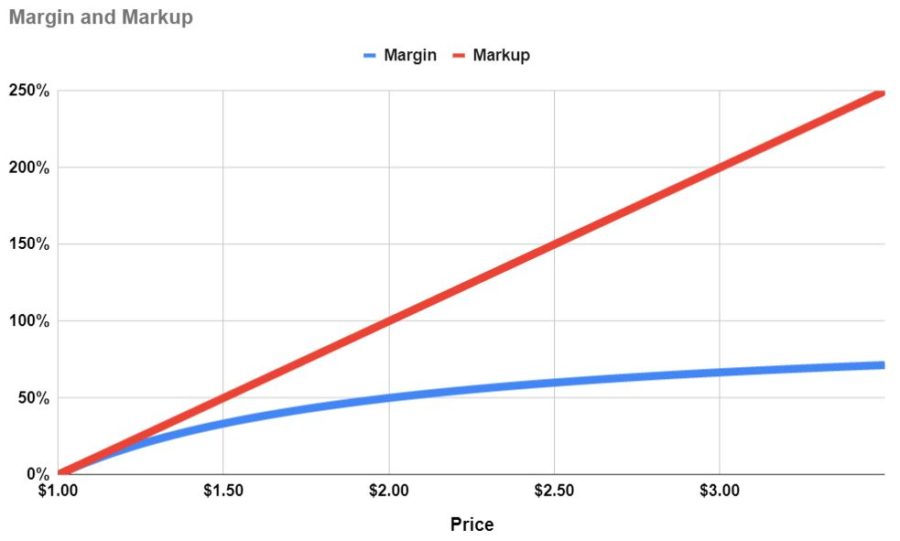
Margin vs Markup
These are two terms that are often mixed. They are similar (even sound similar!) but they are not the same.
Margin can only approach 100%. Markup can be an infinite percent.
Markup is based on cost. It is calculated by dividing profit (gross, operating, or net) by cost.
Say something costs $1.00. If it’s marked up 30%, the price would be $1.30. If it’s marked up 60% the price would be $1.60.
Margin is based on price. It is calculated by dividing profit (gross, operating, or net) by price.
Say something costs $1.00. If it has a 30% margin, the price would be $1.43. If it has a 40% margin, the price would be $1.67.
Price = Cost ÷ (1 – margin %)
Here are some more comparisons of margin and markup:
Price
Cost
Margin %
Markup %
$1.00
$1.00
0%
0%
$1.43
$1.00
30%
43%
$1.67
$1.00
40%
67%
$2.50
$1.00
60%
150%
$3.00
$1.00
67%
200%
$4.00
$1.00
75%
300%
Click to enlarge
Retail, Wholesale, or Manufacturer – The Rules Still Apply
So, is a 30%, 40%, or 60% margin good?
It depends.
It depends on whether you are talking gross margin, operating margin, or net margin. It also depends on the industry and business model you are referring to. Every business and industry is different. What’s good and what isn’t can only be determined when comparing to an appropriate benchmark.
Some industries work with high profit margins and others work on minuscule margins.
Regardless of where an organization stands in the supply chain, the need to maintain profitability is important. Advanced accounting methods combined with software that can quickly search through data to extract the most important information makes the process of assigning costs much easier and much faster.
However, the need to incorporate all salient costs and related expenses can become burdensome and overly detailed if not monitored for accuracy and applicability. Traditional models have been replaced by highly-customized programs that reflect the conditions of individual companies rather than using industry-wide standards for calculating costs.
Protecting the Margin
Knowing the true and detailed costs of a product or service is critical in a competitive environment. If margins start to slip, most businesses will go to their suppliers looking to save money and maintain profit margins by asking for discounts. Or, they might take other cost-saving measures.
Any Way You Cut It, Margin Still Matters Most
The discussion over the difference between the terms “margin and “mark-up” are arguments over the same thing – profit. Unless an organization is a non-profit, its goal is to make a profit and to do so for as long as possible.
Net profit is often called the “bottom-line” and it still defines an organization’s character and capability to many. Every financial analyst, stockbroker, and business columnist focuses on a company’s ability to not only generate a profit margin but to do it repetitively and under a variety of conditions. Knowing the numbers and figures that determine the actual costs for a product or service leads to the opportunity to produce the desired margin more readily and realistically.,
Customer profitability is measured by subtracting allocated costs from customer revenue.
The trick is to logically allocate costs – specifically Selling, General, and Administrative expenses. Understanding your customer profitability will help you make better decisions. For instance, what new customers to target and which of your current customers to part ways with. Having more good (and less not-so-good) customers will make your life as a small business owner more enjoyable.
Download a copy of the Customer Profitability workbook
Complete the form below and click Submit. Upon email confirmation, the workbook will open in a new tab.
Why is it important to analyze customer profitability?
You’re probably wondering if some of your small business’ customers are unprofitable.
In the back of your mind, you know that some customers are better than others. Some customers are a huge headache and don’t bring in that much revenue. Others are a pleasure to do business with and drive the majority of your revenue.
It’s more than just revenue
Sure, you have an inkling of which customers are good and which are… not-so-good. But until you run the numbers, you’ll never know.
What you find might surprise you. Maybe the customer who’s a huge headache is worth it? Or, maybe the customer who seems ideal is actually unprofitable?
Revenue is the starting point. But customer profitability has as much to do with costs as it does revenue.
Build a better business with a customer profitability analysis
By understanding which of your customers are the most profitable, you can make better decisions in the future.
You will have a measurement to decide if you need to dedicate more time and resources to certain customers. Or, if you need to fire them.
Your “ideal customer” will become clearer. This will allow you to focus your marketing toward other “ideal customers.”
Also, by getting rid of not-so-good customers, you’ll likely save a huge emotional toll on yourself and your employees. Work will become more pleasurable. Which, in turn, can only help you achieve your vision for your small business.
How does a business measure customer profitability?
You know that profit = revenue – expenses. So, customer profit must equal customer revenue – customer expenses.
Customer revenue is easy enough. Your accounting software should be able to provide you with a report that tells you what you sold to who. If not, that’s Job #1 – to piece together this information or start measuring it going forward. You can’t measure customer profitability without it.
If you’re following along in the Customer Profitability workbook, you can enter customer names in row 5 of the Customer Profitability worksheet. Additionally, enter Customer revenue in row 7.
Also, for the sake of consistency, I would advise you to enter a Start and FinishTime period. This goes in cells C3 & D3 respectively. These dates won’t affect any formulas. They will, however, help ensure that your revenue and costs are compared consistently.
Costs of Goods Sold/Cost of Sales
Cost of goods sold (COGS), also known as Cost of sales (COS), are the costs your business (more or less) directly incurred to deliver that product/service to the customer.
Again, your accounting software probably captures this for you in a report somewhere.
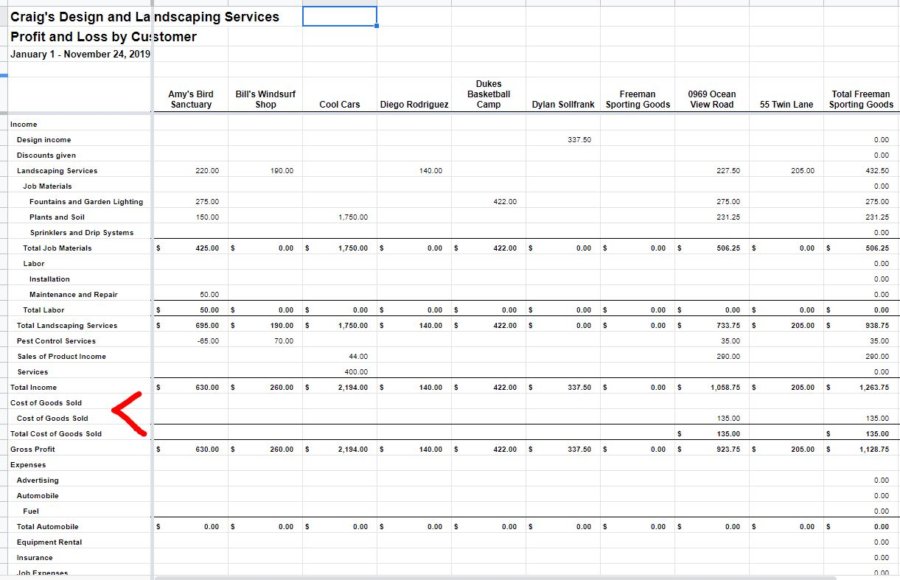
QuickBooks Online captures this information in a report called Profit and Loss by Customer. It can be found by navigating to Reports (left menu) > Standard (tab) > Business overview (section).
Here’s what that report looks like when downloaded into a spreadsheet:
Credit: qbo.intuit.com Click to enlarge
Based on how you set up your customers and products/services in QBO, your COGS will automatically be recorded in this report. That’s a big chunk of costs right there! Customer Gross Profit is taken care of.
What if you don’t have a report that totals customer revenue and COGS?
You can estimate these totals with the Customer Rev/COGS (Optional) worksheet. It will just take a little more legwork.
First, list all your Products/Services in column B. Then for each Product/Service list the average Price you sell it for. Also, the average Cost.
Again, I’ll try not to get too technical. “Cost” in this case, includes material, labor, and overhead. The total costs incurred to produce one Product/Service. If you’re unsure whether to include a particular expense, leave it off. It can always be allocated on the Customer SGA Allocation worksheet.
After you’ve listed Products/Services, Price, and Cost, then you’ll want to enter the QUANTITY PURCHASED by each customer.
At the bottom, you’ll see Revenue and COGS by customer summed. These amounts can then be entered on the Customer Profitability Worksheet. They won’t carry over automatically because this worksheet is optional.
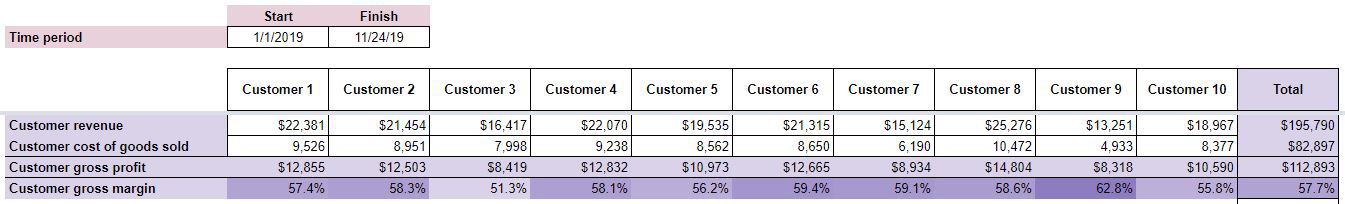
With Customer revenue and Customer cost of goods sold entered, Customer gross profit and gross margin will be calculated. Your Customer Profitability worksheet should look something like this:
Click to enlarge
The shading of the Customer gross margin cells will change slightly to highlight those customers with the highest gross margins.
What about Selling, General, and Administrative expenses?
Everything up until this point has been fairly intuitive. This is where the good customers get separated from the not-so-good, though.
Selling, General, and Administrative (SGA) are those expenses that are not directly tied to any individual Product/Service. This is why you don’t see these expenses included in the QBO Profit and Loss by Customer report.
But, these expenses are very real. They are (or, at least, should be) necessary to serve your customers. So, they should be accounted for any time you speak of “profitability.”
How do you allocate these expenses to individual customers though?
You can think of each type of Expense as a pie. It’s up to you to decide on the most appropriate way to slice that pie for each customer. There are no wrong ways to slice that pie. Some are just better than others.
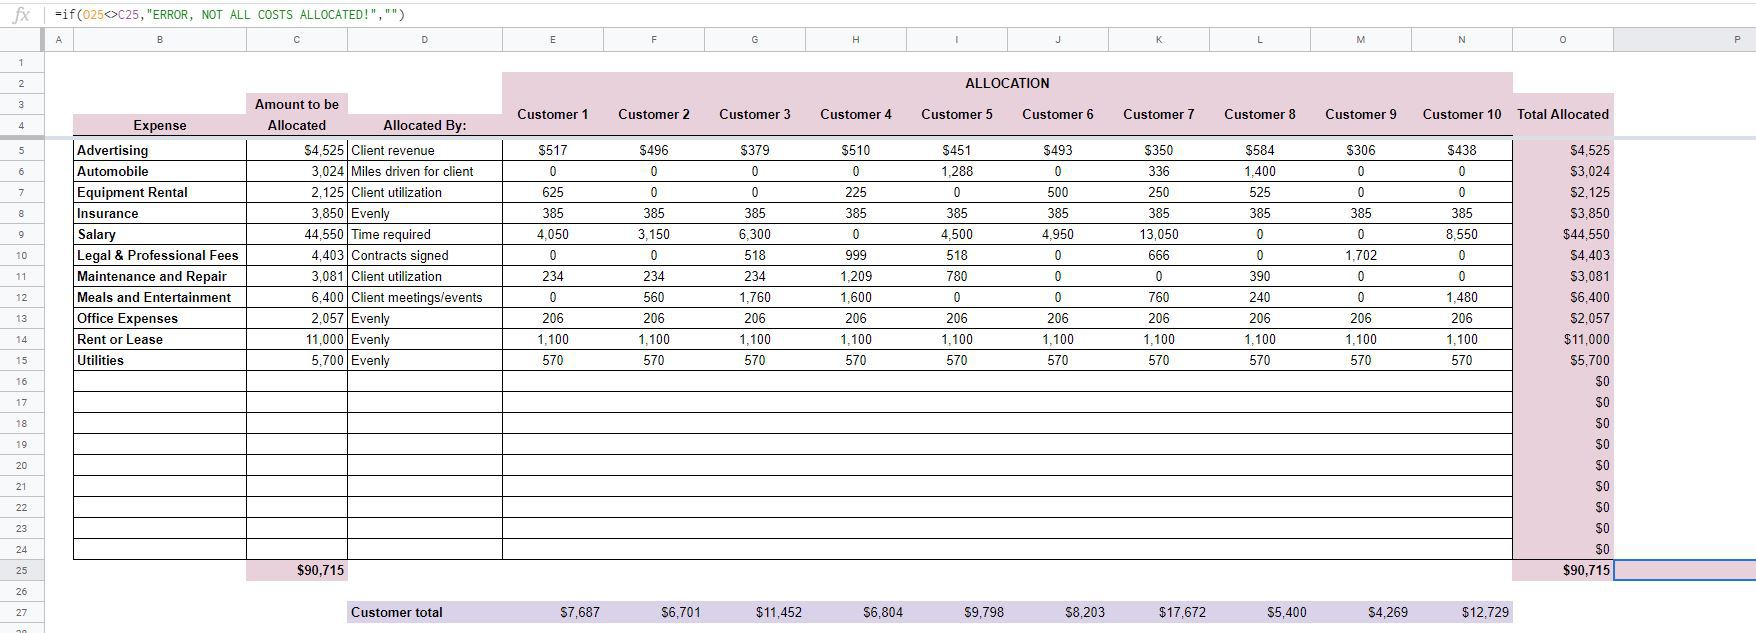
Start by listing Expenses in column B on the Customer SGA Allocation worksheet. Break them down into as much detail as you’re comfortable with.
For each Expense, enter an Amount to be Allocated in column C. Remember to stick to the Time period specified on the Customer Profitability Worksheet. You don’t want to allocate too much or too little.
Drivers – slicing the pie
Now, comes the creative part…
Think about what drives that Expense. Specifically, what the customer does that makes that Expense increase.
For example, Automobile expenses could be allocated by the number of miles driven for a client. Meals and Entertainment could be allocated by the number of meetings and events you took part in with the client.
Again, there are no wrong answers here because there are (usually) no perfect ways to slice the pie. Use your best judgment. If you completely draw a blank, you can always allocate that Expense evenly across all customers.
Try not to do that if at all possible, though. It’s the allocation of these costs that really separates the profitable customers from the unprofitable ones.
Back to the Customer SGA Allocation worksheet.
Enter the method of allocation in column D. Then, for each customer, break the Amount to be Allocated down in that manner. The Total of that breakdown (column O) needs to equal the Amount to be Allocated.
If all of the Totals don’t match, you’ll see an error message in cell P25.
Customer SGA expenses are totaled at the bottom and carried over to the Customer Profitability Worksheet.
Your completed Customer SGA Allocation worksheet should look something like this when you’re done:
Click to enlarge
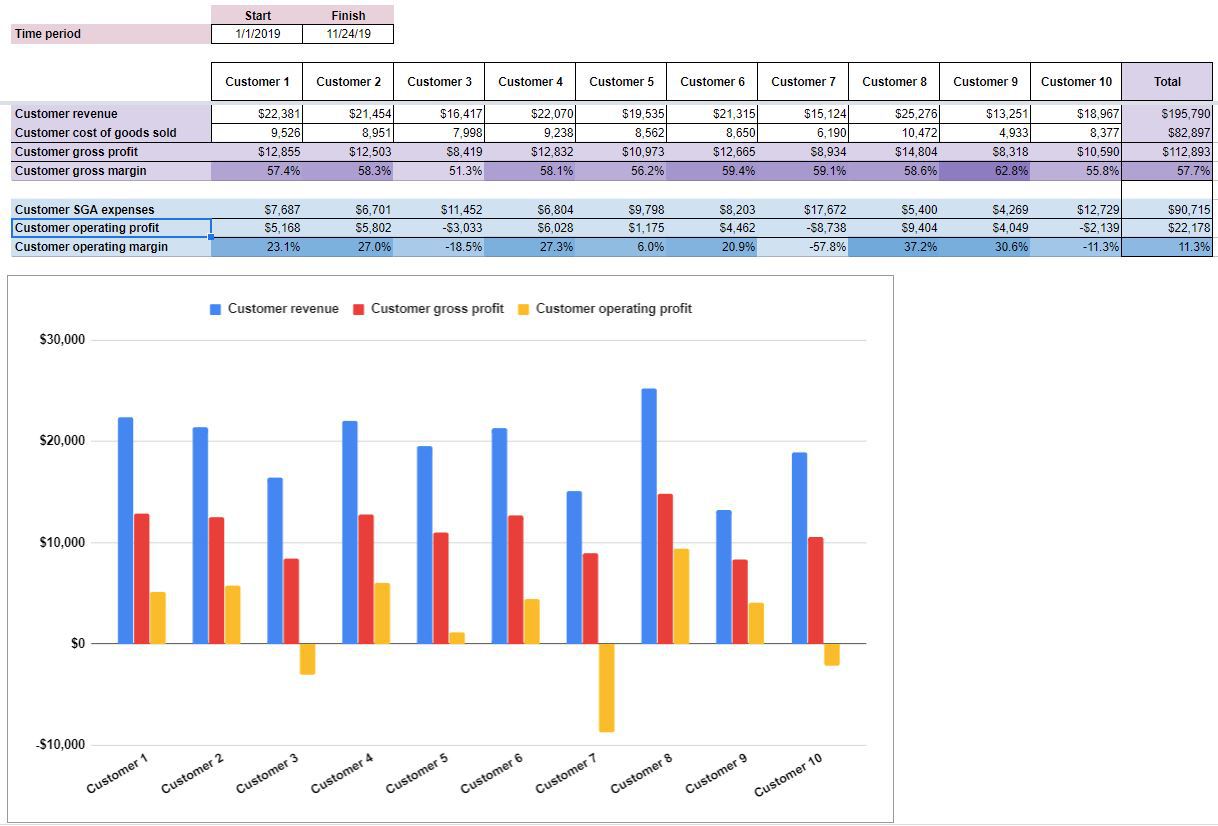
The final product
If you look back at the Customer Profitability Worksheet, you’ll see that Customer SGA expenses are subtracted from Customer gross profit to give you Customer operating profit. Aside from taxes, this is essentially your bottom line for customer profitability.
Customer operating margin is also displayed. Again, the shading in these cells will change to highlight those customers with the highest operating margin.
A chart, comparing your customers is also included to help with understanding.
Your final product should look something like this:
Click to enlarge
How to improve
Good news! The first step to improving customer profitability is to understand it. After using this workbook, you should have a better understanding of customer profitability.
Next, look for common themes among your best (most profitable) customers. Is there anything they have in common?
How did you acquire these customers? Can you replicate it?
Can you do more business with these customers? You don’t want to grind on your best customers too hard. But, are there any more of their problems you can fix with your solutions?
Don’t just look at your customers either. Look into the mirror a little bit too. Is your company making some customers not-so-good? This might not be comfortable. But, some introspection could help you convert some of those not-so-good customers to the light side.
If some of the not-so-good customers are hopeless though, you might have to fire them. This can be a delicate situation. However, sinking money into customers that you don’t even enjoy dealing with is destructive. Do your homework on the best way to do so and let them be someone else’s problem.