Quick & Easy Tool for Measuring Customer Profitability

customer profitability featured

Customer profitability is measured by subtracting allocated costs from customer revenue.

The trick is to logically allocate costs – specifically Selling, General, and Administrative expenses. Understanding your customer profitability will help you make better decisions. For instance, what new customers to target and which of your current customers to part ways with. Having more good (and less not-so-good) customers will make your life as a small business owner more enjoyable.

Download a copy of the Customer Profitability workbook

Complete the form below and click Submit.
Upon email confirmation, the workbook will open in a new tab.

Why is it important to analyze customer profitability?

You’re probably wondering if some of your small business’ customers are unprofitable.

In the back of your mind, you know that some customers are better than others. Some customers are a huge headache and don’t bring in that much revenue. Others are a pleasure to do business with and drive the majority of your revenue.

It’s more than just revenue

Sure, you have an inkling of which customers are good and which are… not-so-good. But until you run the numbers, you’ll never know.

What you find might surprise you. Maybe the customer who’s a huge headache is worth it? Or, maybe the customer who seems ideal is actually unprofitable?

Revenue is the starting point. But customer profitability has as much to do with costs as it does revenue.

Build a better business with a customer profitability analysis

By understanding which of your customers are the most profitable, you can make better decisions in the future.

You will have a measurement to decide if you need to dedicate more time and resources to certain customers. Or, if you need to fire them.

Your “ideal customer” will become clearer. This will allow you to focus your marketing toward other “ideal customers.”

Also, by getting rid of not-so-good customers, you’ll likely save a huge emotional toll on yourself and your employees. Work will become more pleasurable. Which, in turn, can only help you achieve your vision for your small business.

How does a business measure customer profitability?

You know that profit = revenue – expenses. So, customer profit must equal customer revenue – customer expenses.

Customer revenue is easy enough. Your accounting software should be able to provide you with a report that tells you what you sold to who. If not, that’s Job #1 – to piece together this information or start measuring it going forward. You can’t measure customer profitability without it.

If you’re following along in the Customer Profitability workbook, you can enter customer names in row 5 of the Customer Profitability worksheet. Additionally, enter Customer revenue in row 7.

Also, for the sake of consistency, I would advise you to enter a Start and Finish Time period. This goes in cells C3 & D3 respectively. These dates won’t affect any formulas. They will, however, help ensure that your revenue and costs are compared consistently.

Costs of Goods Sold/Cost of Sales

Cost of goods sold (COGS), also known as Cost of sales (COS), are the costs your business (more or less) directly incurred to deliver that product/service to the customer.

Again, your accounting software probably captures this for you in a report somewhere.

QuickBooks Online captures this information in a report called Profit and Loss by Customer. It can be found by navigating to Reports (left menu) > Standard (tab) > Business overview (section).

Here’s what that report looks like when downloaded into a spreadsheet:
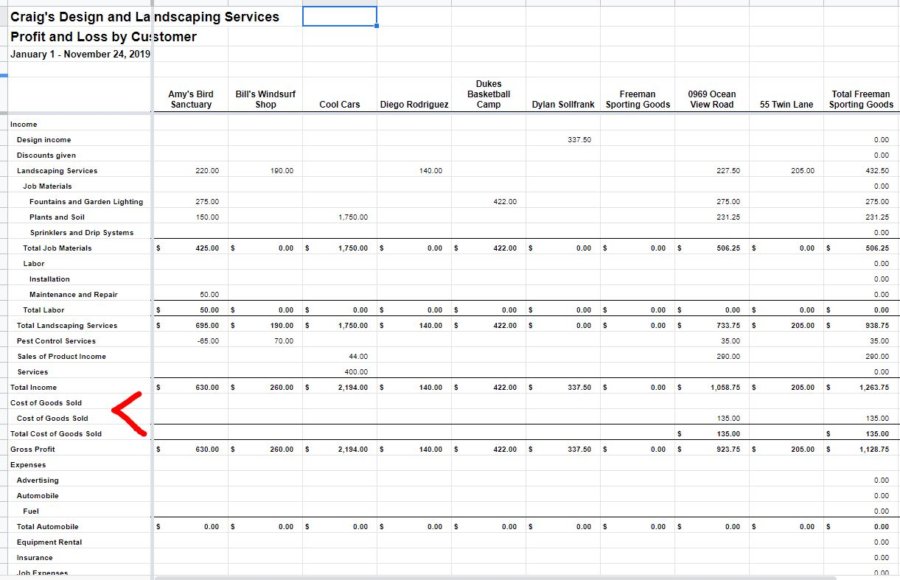
qbo profit and loss by customer report spreadsheet
Credit: qbo.intuit.com
Click to enlarge

Based on how you set up your customers and products/services in QBO, your COGS will automatically be recorded in this report. That’s a big chunk of costs right there! Customer Gross Profit is taken care of.

Learn more about gross profit maximization here.

What if you don’t have a report that totals customer revenue and COGS?

You can estimate these totals with the Customer Rev/COGS (Optional) worksheet. It will just take a little more legwork.

First, list all your Products/Services in column B. Then for each Product/Service list the average Price you sell it for. Also, the average Cost.

Again, I’ll try not to get too technical. “Cost” in this case, includes material, labor, and overhead. The total costs incurred to produce one Product/Service. If you’re unsure whether to include a particular expense, leave it off. It can always be allocated on the Customer SGA Allocation worksheet.

After you’ve listed Products/Services, Price, and Cost, then you’ll want to enter the QUANTITY PURCHASED by each customer.

At the bottom, you’ll see Revenue and COGS by customer summed. These amounts can then be entered on the Customer Profitability Worksheet. They won’t carry over automatically because this worksheet is optional.

With Customer revenue and Customer cost of goods sold entered, Customer gross profit and gross margin will be calculated. Your Customer Profitability worksheet should look something like this:

customer gross margin calculation
Click to enlarge

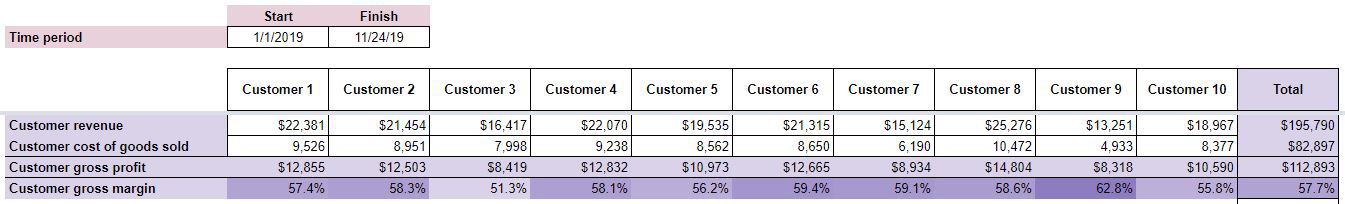
The shading of the Customer gross margin cells will change slightly to highlight those customers with the highest gross margins.

What about Selling, General, and Administrative expenses?

Everything up until this point has been fairly intuitive. This is where the good customers get separated from the not-so-good, though.

Selling, General, and Administrative (SGA) are those expenses that are not directly tied to any individual Product/Service. This is why you don’t see these expenses included in the QBO Profit and Loss by Customer report.

But, these expenses are very real. They are (or, at least, should be) necessary to serve your customers. So, they should be accounted for any time you speak of “profitability.”

How do you allocate these expenses to individual customers though?

You can think of each type of Expense as a pie. It’s up to you to decide on the most appropriate way to slice that pie for each customer. There are no wrong ways to slice that pie. Some are just better than others.

Start by listing Expenses in column B on the Customer SGA Allocation worksheet. Break them down into as much detail as you’re comfortable with.

For each Expense, enter an Amount to be Allocated in column C. Remember to stick to the Time period specified on the Customer Profitability Worksheet. You don’t want to allocate too much or too little.

Drivers – slicing the pie

Now, comes the creative part…

Think about what drives that Expense. Specifically, what the customer does that makes that Expense increase.

For example, Automobile expenses could be allocated by the number of miles driven for a client. Meals and Entertainment could be allocated by the number of meetings and events you took part in with the client.

Again, there are no wrong answers here because there are (usually) no perfect ways to slice the pie. Use your best judgment. If you completely draw a blank, you can always allocate that Expense evenly across all customers.

Try not to do that if at all possible, though. It’s the allocation of these costs that really separates the profitable customers from the unprofitable ones.

Back to the Customer SGA Allocation worksheet.

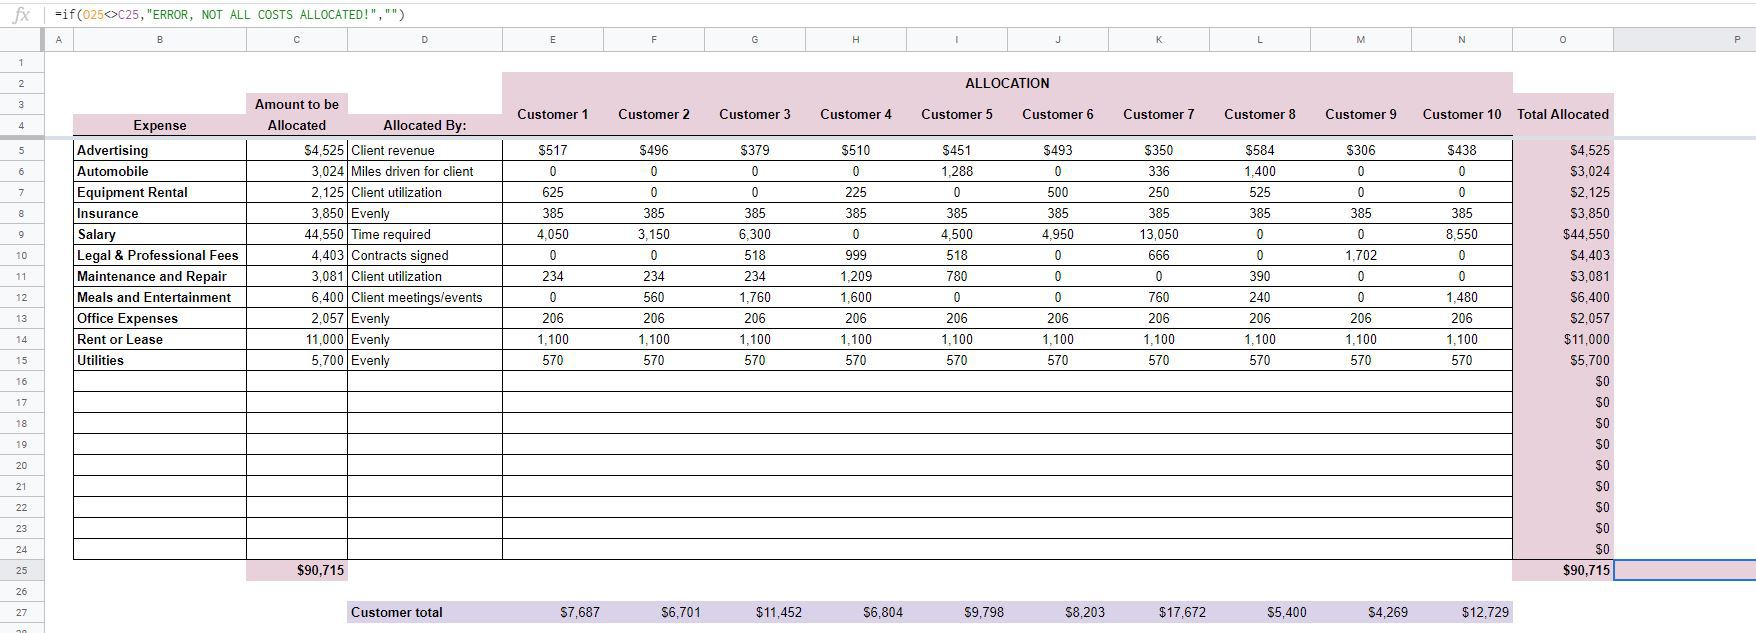
Enter the method of allocation in column D. Then, for each customer, break the Amount to be Allocated down in that manner. The Total of that breakdown (column O) needs to equal the Amount to be Allocated.

If all of the Totals don’t match, you’ll see an error message in cell P25.

Customer SGA expenses are totaled at the bottom and carried over to the Customer Profitability Worksheet.

Your completed Customer SGA Allocation worksheet should look something like this when you’re done:

customer sga expense allocation worksheet
Click to enlarge

The final product

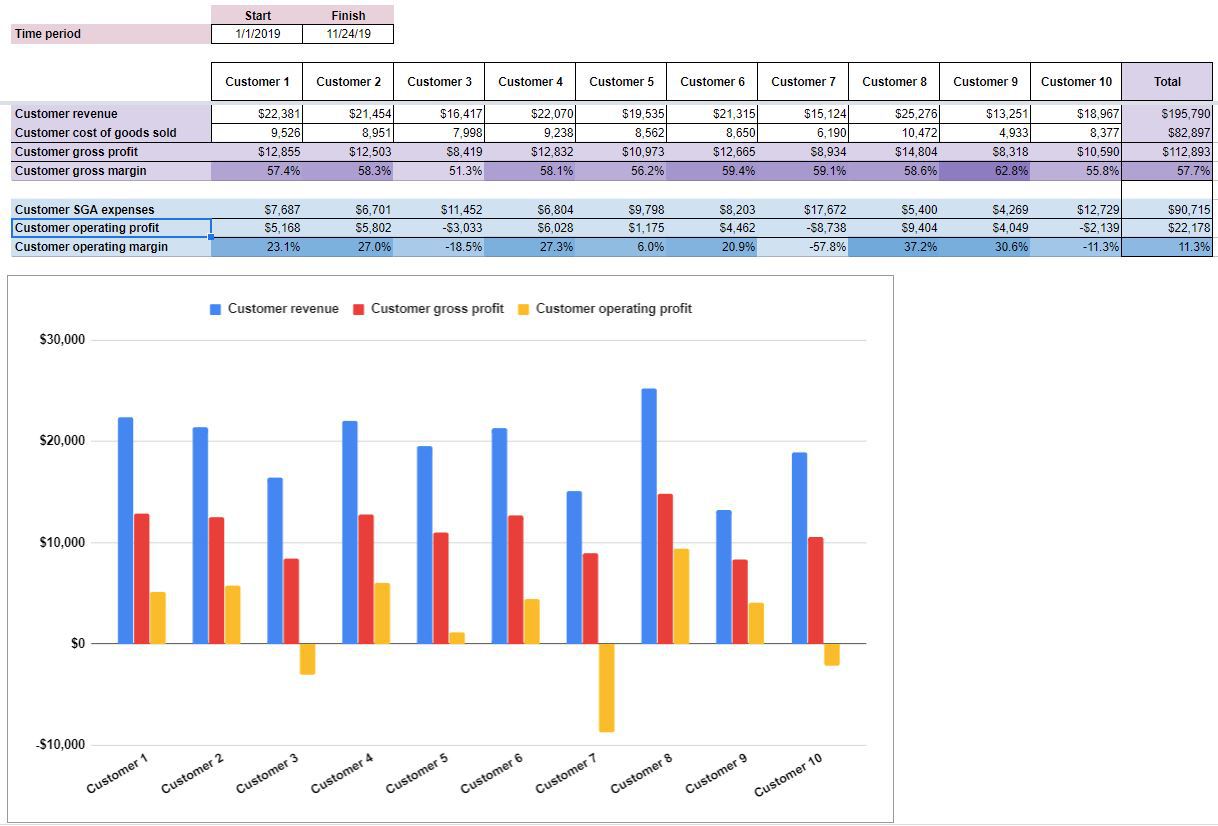
If you look back at the Customer Profitability Worksheet, you’ll see that Customer SGA expenses are subtracted from Customer gross profit to give you Customer operating profit. Aside from taxes, this is essentially your bottom line for customer profitability.

Customer operating margin is also displayed. Again, the shading in these cells will change to highlight those customers with the highest operating margin.

A chart, comparing your customers is also included to help with understanding.

Your final product should look something like this:

customer profitability worksheet table and chart
Click to enlarge

How to improve

Good news! The first step to improving customer profitability is to understand it. After using this workbook, you should have a better understanding of customer profitability.

Next, look for common themes among your best (most profitable) customers. Is there anything they have in common?

How did you acquire these customers? Can you replicate it?

Can you do more business with these customers? You don’t want to grind on your best customers too hard. But, are there any more of their problems you can fix with your solutions?

Don’t just look at your customers either. Look into the mirror a little bit too. Is your company making some customers not-so-good? This might not be comfortable. But, some introspection could help you convert some of those not-so-good customers to the light side.

If some of the not-so-good customers are hopeless though, you might have to fire them. This can be a delicate situation. However, sinking money into customers that you don’t even enjoy dealing with is destructive. Do your homework on the best way to do so and let them be someone else’s problem.

Comment on Twitter!

Church Budget Example – Use This Template! [VIDEO]

church operating budget featured

Video Transcript

00:00 I’m gonna go over how to go about making
00:04 operating budget for your church some of
00:06 my previous videos you know I’ve done a
00:08 little more in depth with the individual
00:10 spreadsheets and how you know what each
00:12 field is about how its calculating
00:14 everything this time I’m going to try
00:16 something different I’m gonna stick to
00:18 kind of summarizing here and I’m gonna
00:19 put a link down in the description where
00:21 you can read the whole in-depth post
00:24 that covers every single aspect you know
00:27 in detail of the operating budget for
00:30 your church and the video here is just
00:32 gonna be kind of a summary so that being
00:34 said let’s get into it
00:36 we’ll start off here with a ordinarily
00:41 with a for-profit company you always
00:44 start with a revenue budget with the
00:45 church you have a little flexibility
00:47 there you start with a revenue budget or
00:48 with your expense budget so for the sake
00:52 of simplicity I’m going to walk through
00:54 this starting with the revenue budget
00:55 but you know it really is a matter of
00:59 private preference do to kind of
01:01 churches unique situations so revenue
01:04 budget is exactly what it sounds like
01:06 it’s a budget in a forecast for all of
01:08 the money you’re gonna bring in for the
01:10 year so in this case we’ve got the
01:13 different sources listed here offerings
01:15 donations facility whose charges trust
01:18 investments and other okay and we reject
01:21 them out for every month for the coming
01:23 year but the first month of our planning
01:25 period here so if you’re planning
01:27 creative begins in July or September or
01:29 whatever some other month with that in
01:32 there it’ll automatically populate it
01:33 out and all the forecasted amounts are
01:38 total by month and total by source also
01:42 point out real quick that all
01:44 spreadsheets for business templates
01:46 which there’ll be a link to the template
01:49 in the link to the post so you get that
01:53 by going to the post but all
01:56 spreadsheets for business workbooks the
02:00 white cells are adjustable okay the
02:02 colored in cells or other formulas or
02:03 their text so unless you really really
02:05 know what you’re doing don’t touch those
02:07 so revenue budget is pretty simple and
02:11 we’ll move on to the expense budgets now
02:16 let me get rid of the fixed cells here
02:21 there’s separate expense budgets for
02:25 each of the four kind of broad
02:26 categories of expenses the inspiration
02:29 for these categories comes from Bree mal
02:31 FERS if you’ve done any searching on
02:33 YouTube or on the web in regards to
02:36 Church strategic planning you’ve come
02:37 across
02:38 Audrey’s work and he’s does a great job
02:42 and you know definitely a good source of
02:47 information I’ve never seen him put
02:48 forth anything like this not to say that
02:50 he hasn’t that I used a lot of his
02:54 inspiration in creating this template
02:57 for budgeting so now he breaks it church
03:02 expenses into four broad categories
03:04 evangelism emissions personnel
03:06 ministries and facilities so as you can
03:09 sing along the bottom here that’s
03:10 exactly what we’ve done
03:12 each of these four budgets is formatted
03:15 in the same manner so for simplicity
03:17 sake we’ll just look at the evangelism
03:21 and missions budget here so what you got
03:26 at the top here is you know basically
03:29 when it would take those broad
03:30 categories expenses and break them down
03:31 into subcategories so do that first and
03:35 foremost for the evangelism missions
03:36 here and direct and Synod support
03:39 Convention Assessment local mission work
03:40 outreach etc of course each broad
03:44 category has its own separate sub
03:48 categories you came and you’ll notice
03:52 also you’ll have to fill those in
03:54 manually and also you’ll notice that
03:56 each bra subcategory of expenses gets
04:03 category wrap categorized as fixed or
04:06 variable and simply put the post goes in
04:11 a little more detail but you know fixed
04:14 is gonna be the same no matter your
04:16 level of revenue a more revenue less
04:19 revenue you would expect this expense to
04:21 stay the same
04:22 variable on the other hand you would
04:24 expect to increase with revenue and
04:25 decrease increase in decrease with
04:28 revenue less revenue less expense more
04:29 revenue more expense okay so you’ll see
04:32 that all these amounts are filled in
04:34 here a lot of them with zeros because
04:36 there’s a room for plenty of
04:38 subcategories well where’s that
04:39 information come it comes from down here
04:41 below this is where you get into the
04:42 detail okay so you’ll notice each sub
04:45 categories listed here and you can
04:47 detail expenses and this is where you
04:48 actually put in the inmense so you know
04:51 you take a broad category of expenses
04:53 break it down to subcategories break it
04:55 down further into details you know
04:58 depending on the sophistication of your
05:00 accounting software or your accountant
05:04 you know this could be these detailed
05:06 expenses here could be individual GL
05:08 accounts or whatever you want them to be
05:11 but as long as you address all expenses
05:14 that’s all that really matters it’s just
05:16 like I said kind of breaking things down
05:18 here into manageable chunks to where you
05:22 can forecast them out for every month in
05:26 the planning period then they’ll total
05:29 here and those totals will carry up here
05:32 okay so you’ll see like I said every
05:36 subcategory of expenses listed here with
05:39 plenty of room to entered detailed
05:42 expenses okay so you do that for
05:45 evangelism and admission you do that for
05:50 personnel do it for ministries it’s all
05:55 them all the same same format do it for
05:58 facilities so okay you better you expect
06:01 the revenue for the year then you
06:03 entered your expected expenses for the
06:07 year don’t forget like in this example
06:09 real quick here you’ll notice this ties
06:13 into the capital budgeting work that we
06:18 did – I like to make my workbooks tie
06:22 into each other so it can paint the
06:24 entire picture for you guys so that’s
06:26 what this means you know most of these
06:28 are Justin Eric detailed expenses but
06:30 this one here talks about snow removal
06:32 and it has to do with the
06:34 creation of a new parking lot that we
06:36 looked at in the capital budget so check
06:38 that video out to check that post out to
06:41 so and yeah once all expenses are
06:46 entered then that’s the biggest part of
06:51 budgeting okay all that’s going to carry
06:54 over here into your pro forma income
06:56 statement where you’ve got your total
06:58 revenue your total for each expense by
07:02 broad category okay and then we threw in
07:05 a percentage amount here
07:08 that’s a percentage of revenue if I
07:11 remember right yes it is okay just just
07:15 kind of paint the picture of what
07:18 categories are contributing most to your
07:20 expenses then we’ve got operating profit
07:23 which is revenue minus expenses one
07:27 other thing you have to fill in I mean
07:28 pro forma income statement here that
07:30 isn’t really covered elsewhere in the
07:31 operating budget is interest income in
07:35 interest expense okay so this is a will
07:39 have to be a forecast you’ll just have
07:41 to look at you know for income if you
07:44 have income earning assets savings you
07:49 know money market accounts something
07:52 that maybe earns a little more than that
07:54 dividends perhaps enter now here
07:57 interest expense it’s gonna depend in
07:58 large part on the amount you need to
08:00 borrow a lot of that will be covered in
08:02 the financial budget okay but you know
08:05 you can go ahead and do your financial
08:08 budget which I’ll cover in a later video
08:09 and a post that’s coming soon and circle
08:13 back around enter that information here
08:14 too okay you’re not gonna be graded on
08:18 your accuracy in terms of forecasting
08:20 this can be a living document come back
08:21 and change it as you need to
08:23 all right so operating profit minus
08:25 these interest expenses churches don’t
08:27 pay taxes so there’s net profit okay
08:32 there’s a couple of simple ratios left
08:34 in here that are applicable for churches
08:38 okay got profit margin which is pretty
08:39 self-explanatory you know your net
08:42 profit compared to you net sales times
08:44 interest earned looks at those
08:46 looks at interest expense and operating
08:50 profit how it relates to it degree of
08:53 financial leverage again the post will
08:54 get into more detail in degree of
08:56 operating leverage we’ll get more detail
08:58 on that too those are two interesting
09:00 concepts that basically tell you what
09:07 the based on degree of financial
09:10 leverage based on the amount of money
09:14 you borrow what effect increasing and
09:20 decreasing
09:21 operating profit would have on that or
09:25 the rather the effect you’ll have to
09:29 read the posts to get a detail because
09:30 if I start talking about it I’ll go on
09:32 for an hour here and like I said and try
09:34 to make this summary so basically the
09:39 effect of degree of financial leverage
09:41 is the effect of interest expense on
09:45 profit degree of operating leverage is
09:47 the effect of fixed expenses fixed costs
09:52 on profit okay and that’s why I asked
09:56 you guys to specify whether costs are
09:59 fixed or variable here okay so that’s
10:01 what that was for read more about that
10:03 like I said you’ve got the chart down
10:06 here pretty straightforward just an
10:08 illustration of what happens month by
10:10 month based off of your forecast you’ve
10:12 got the Green Line is revenue and then
10:15 you’ve got your different categories of
10:16 expenses here you can see how they rise
10:18 and fall in total and by categories so
10:22 one little extra bonus that I like to
10:26 add to my industry specific spreadsheets
10:29 is this likely best case worst case
10:33 scenario okay I think this is super
10:36 valuable you know and it’s it is another
10:39 step and the whole strategic planning
10:43 thing which is time-consuming in that
10:44 bed really is just the like I said the
10:50 plus one however you want to put it to
10:53 to the operating budget this is where
10:56 you know you’ve done you’ve been in put
10:58 your
10:59 expected revenue cost profit etc now you
11:02 get to toy with what the worst case
11:04 would be in the best case would be and
11:06 this just like most of strategic
11:08 planning
11:09 just get your mind working in that
11:10 direction so you’re you’re completely
11:14 comprehensively prepared for the
11:15 upcoming year okay so it starts off here
11:19 with the pro forma income statement
11:26 that’s what this is sure if it Proform
11:28 in there but yeah it’s a pro forma
11:31 income statement or rather this yeah
11:35 sorry okay so this is revenue up here
11:37 where you can toy with best cased amount
11:40 for each revenue source
11:45 worst case amount or you can just use a
11:48 generic multiplier okay so basically
11:52 what that means it’s like if I change
11:53 this worst case is gonna be negative in
11:55 the case of revenue the 15% you’re gonna
11:59 see these worst case amounts decrease
12:03 okay because I made the worst excuse me
12:08 in the worst case that much worse
12:10 okay but you have so you can change that
12:15 there it will affect everything in that
12:17 section but you also have the ability to
12:20 override it okay so see if we delete
12:25 this worst case would be 38,000 versus
12:31 42,000 for trust investments in the
12:34 quest but you know say you think no no
12:38 worst case could be worse than that or
12:40 worst case wouldn’t be quite as bad well
12:43 then you just override that amount okay
12:46 everything else is based off of this
12:48 multiplier but now you’ve overwritten it
12:51 with an amount so same same principle in
12:55 the best case I’d come down here to
12:58 expenses we have our abroad expense
13:00 categories again use a multiplier this
13:04 is just a ballpark figure the multiplier
13:06 basically if you know best-case in the
13:10 Fuhrer expects is going to be the
13:11 decrease
13:12 worst case for expenses gonna be the day
13:15 increase and I keep doing it
13:17 so keep that in mind and you can
13:20 override you don’t like what you see so
13:22 yeah just toy with it you know that’s
13:25 the whole point of this exercise just
13:28 toy with it see what playing with
13:32 different scenarios gives you what it
13:35 makes you think about what you might do
13:37 to plan to avoid a worst case what you
13:39 what planning you might do to take
13:41 advantage of the best case okay so just
13:44 like the pro forma income statement on
13:45 this executive summary
13:47 you got your operating profit here you
13:50 can see negative under worst case this
13:54 will match what’s on the executive
13:55 summary the ten thousand twenty eight
13:58 operating profit and best case
14:05 considerably better six times the
14:07 operating profit so that’s pretty good
14:10 it brings in interest income and expense
14:14 here also and then that profit always
14:20 calculated the exact same as it is on
14:21 the executive summary so then of course
14:25 the you know the whole purpose of ratios
14:26 is to kind of put amounts into
14:31 perspective from your financial
14:34 statements and the same thing takes
14:36 place here you know profit margin can
14:38 range from negative seventeen point
14:41 eight to twenty seven positive twenty
14:43 seven point two times interest earned
14:45 degree of financial leverage is going to
14:48 change all that it’s gonna going to
14:50 change based off of what you enter in
14:52 the best case in worst case fields above
14:57 some anyhow that’s quick rundown of the
15:01 church operating budget template you
15:04 know go get your own copy to toy with I
15:06 get his follow the link and there’ll be
15:10 a links on there follow a link to the
15:13 post there’ll be links on there to
15:14 download your own copy of it and then
15:16 you know you if you’re dealing with
15:18 concepts you’re not familiar with just
15:20 check out the post I’ve got more or less
15:22 every single field on here
15:24 addressed in there and you know if you
15:28 get stuck on something just check that
15:30 out and it’ll help you make sense what
15:33 you’re looking at so appreciate you
15:35 guys’s time appreciate you watching this
15:39 video if you have until this point the
15:41 very end YouTube it is a popularity
15:45 contest just like anything on the
15:47 Internet and if you like this video if
15:50 you think this seems like something
15:51 useful to you best way to let me know is
15:55 to either leave a comment down below or
16:00 better yet maybe I don’t know depends on
16:03 the YouTube algorithm comments are good
16:06 likes or good subscriptions are good I
16:08 know
16:10 alerts are good any of that stuff you
16:13 know I’ll feedbacks good I’ll crank out
16:16 more content there’s also a lot of stuff
16:19 to check out not just for churches but
16:22 for small businesses in general on
16:23 spreadsheets for business comm thanks
16:26 you guys take care