Degree of Financial Leverage – (Dis)Advantages Plus Examples

how financial leverage affects the business decisions featured

Degree financial leverage = Operating profit ÷ (Operating profitInterest expense)

Financial leverage is simply the act of borrowing money to invest. This is done with the hope of earning a return on that money. A return that is greater than the cost. Often, the potential for gain is disproportionately bigger than the cost. But, the cost is fixed and will be the same regardless of the return earned. Small businesses must learn how to effectively manage their degree of financial leverage. Otherwise, they could find themselves buried under the weight of repayment.

Let’s talk about some of the advantages and disadvantages of financial leverage. Also, how the degree of financial leverage ratio can provide insight into net income.

Download your copy of the workbook used in this post

Complete the form below.
Upon email confirmation, the workbook will open in a new tab.

Financial leverage advantages

Financial leverage is a strategy that can be employed to boost gains. The cost of borrowed money (typically) doesn’t change. So, if that money can be used in a way that earns returns beyond the cost of borrowing – a small business can end up way better off than it would have otherwise.

I always say that every investment comes down to three things – cash in, cash out, and time. If the cost of leverage (cash out) is low enough and the terms are favorable (time), then the cash in has the best opportunity to be big enough to make financial leverage worthwhile.

High financial leverage helps small businesses avoid dilution of earnings from the issuance of equity. It also gives them the ability to put more money to work than they would have otherwise. Both of these advantages can translate into excess returns.

Additionally, interest is tax-deductible. This lessens the tax burden that a company would realize if the same funds were raised through equity. Keep in mind that interest is a fixed cost. A fixed cost that can negatively affect a small business if operating profits aren’t high enough.

Financial leverage is a better fit for some businesses than others

On my sister site, I’ve written often about the benefits of certain business models. For businesses with the right business model, more financial leverage could be very beneficial. This is if it brings in more long-term customers. These business models are conducive to earning a good ROI on borrowed money.

Handling debt responsibly = the ability to borrow more in the future

If a small business effectively employs financial leverage, their creditworthiness improves. With improved creditworthiness, they will (likely) be able to borrow more in the future. If they continue to execute effectively, they can earn compounded returns.

The cost of borrowing (rate) could drop with a successful history of repayment. This could decrease the cost of future financial leverage. Lower cost should mean lower risk. Lower risk increases the likelihood of employing it in a successful manner.

Financial leverage disadvantages

Just as it has the potential to boost gains, financial leverage can also boost losses. Every dollar borrowed represents a little more risk. Again, that’s why the return from the borrowed monies means so much.

But, the lender doesn’t care if your small business makes 10x the cost of borrowing. Or, if it “only” makes 100% of the cost of borrowing. It expects its money back, plus interest, either way.

Borrowing money will increase your cash flow out. If the cash flow in isn’t enough to offset that, then, sooner or later, insolvency will ensue.

It all depends on the context

A lot of the negative stigma surrounding borrowing stems from the personal sector. In the personal sector, when people borrow, they often do so to buy consumer goods. Things that don’t earn any sort of return. These items actually depreciate in value. For example, cars and technology.

Nobody flinches when somebody borrows an ungodly sum of money to buy a house. This is because a house (for better or worse) is expected to increase in value.

Just as certain business models are conducive to financial leverage, others are not. Consider business models that sell time for money or one-time purchase items. These businesses will have to be confident in their financial modeling to ensure that they can earn an adequate ROI on financial leverage.

Finally, the perception of leverage depends on timing. During boom times, the companies borrowing look like geniuses. Conversely, if the economy turns against a business that has irresponsibly borrowed, then they could look foolish.

Financial leverage + operating leverage?

There are two general types of leverage that a small business can use. Operational leverage (which I plan to write about next) and financial leverage. The degree of operating leverage measures the effect of fixed costs (not interest) on operating income.

Beware compounding leverage by adding operating (fixed costs) to financial, or vice versa. This could sneak up on a small business. It could create a situation where management is caught unprepared. The result is potentially catastrophic. It’s important that scenarios like this be modeled out and planned for.

Most people understand the risks associated with borrowing money (financial leverage). The risks of operating leverage are a little more camouflaged.

Make sure you plan around your company’s (potential) total leverage situation. Annual strategic planning with an operating budget allows you to do just that.

Regulatory authorities might paint an overly rosy picture

When interest rates are kept low, the hurdle rate (minimum ROI to justify investment) is also lower. This incentivizes small businesses to take on projects that they might not otherwise. Less is demanded of investments. The pursuit of extraordinary returns might stop short in favor of quick-and-easy (but “good enough”) returns.

Also, by making interest tax-deductible, the effective cost of leverage is lowered even further. This further incentivizes small businesses to use financial leverage. Doing so could amplify any of the previously mentioned disadvantages.

Financial leverage example

The Degree of Financial Leverage shows the amplification that borrowing money can provide to profits and losses. So, for instance, in the example operating budget, the Degree of Financial Leverage is 1.4. This means, at this level of borrowing, that for every 10% change in Operating Profit, Net profit would increase by 14% (10% × 1.4).

That sounds great, but the opposite is also true. If Operating Profit declined by 10%, then this level of borrowing would cause Net profit to decrease by 14%. That’s the nature of leverage. It amplifies gains and losses.

Build Your Church Operating Budget with This Free Template – SpreadsheetsForBusiness.com

I created a spreadsheet to model the changes in profit due to changes in other line items. It helps to better understand how the income statement is affected by financial leverage,

I started with a Base case income statement for a small business that has $1 million in sales. This example business also has a 20% operating margin with $500K in debt at a 5% Interest rate. Its Net profit is approximately $138K.

This company’s Degree of financial leverage is 1.14 ($200,000 ÷ [$200,000 – $25,000]).

Only one variable was changed at a time. Here’s what I found:

The effects of an increase or decrease in sales

A 10% increase in Sales translates into a 50% increase in Operating profit – all other things being equal. As expected, this 50% increase in Operating profit translates into a 57.1% increase in Net profit. This is because the Degree of financial leverage is 1.14 (50.0% × 1.14 = 57.1%).

The same thing happens, in the opposite direction. When Sales drop by 10%, Operating profit decreases by 50%. Net profit drops by 57.1%.

how-financial-leverage-affects-the-business-decisions-change-sales

The effects of an increase or decrease in COGS and SG&A expenses

Since COGS is less than Sales, a 10% change doesn’t have as big of an effect on Operating profit. The result is a drop in Operating profit of 35%. As expected, the resulting change in Net profit is -40% (-35.0% × 1.14 = -40.0%).

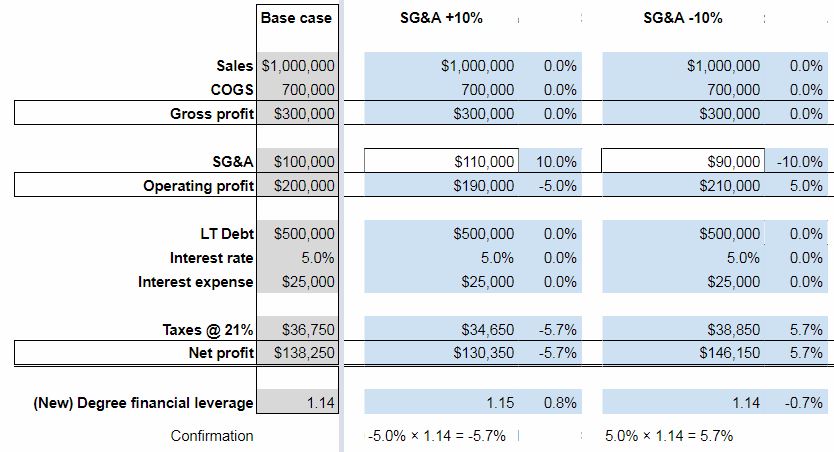
SG&A expenses, being even lower, have less of an impact on Operating profit. A 10% increase only lowers Operating profit by 5% and Net profit by 5.7% (-5.0% × 1.14 = -5.7%).

Of course, things work the same in the opposite direction. A -10% change in COGS increases Operating profit by 35% and Net profit by 40%. A -10% change in SG&A expenses increases Operating profit by 5% and Net profit by 5.7%.

how-financial-leverage-affects-the-business-decisions-change-cogs
how-financial-leverage-affects-the-business-decisions-change-sga

The effects of an increase or decrease in Long-term Debt & Interest rates

As shown above, changes in the income statement that result in increases to Operating profit are amplified in Net profit by the Degree of financial leverage.

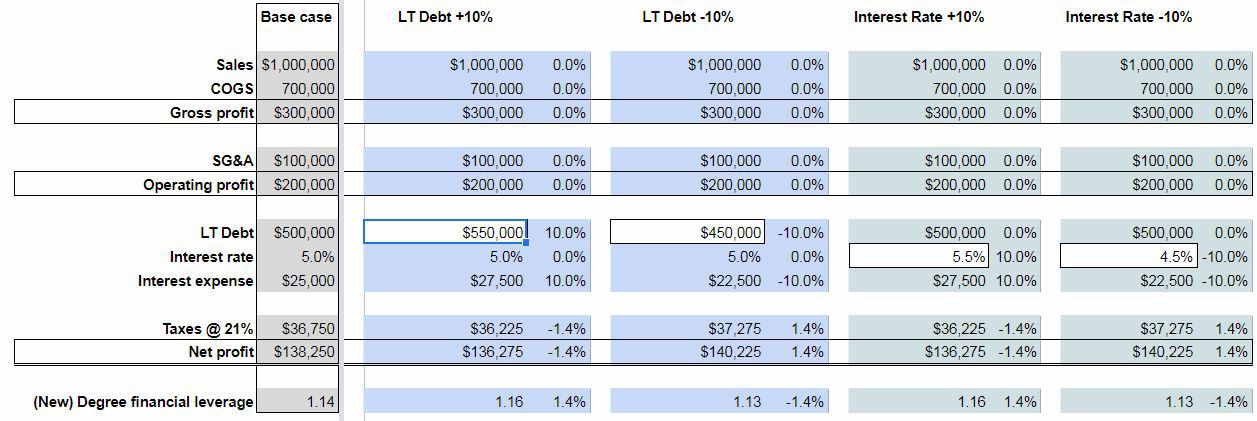
But, what about changes below Operating profit? As expected, a 10% change in either the amount of LT Debt or the Interest rate, results in a corresponding 10% change in Interest expense.

This hypothetical small business carries a sizable amount of LT Debt. Still, Interest expense is still a relatively immaterial expense. Thus, the effect of a change in LT Debt and Interest rates is only ±1.4% on Net profit.

change-debt-interest-change
Click to enlarge

Going forward with a new Degree of financial leverage

Because of the nature of the Degree of financial leverage calculation (Operating profit ÷ [Operating profitInterest expense]), when Operating profit increases, the Degree of financial leverage decreases – all other things being equal. The opposite is, of course, true too.

What does this mean?

It means that if your small business increases Operating profit this year, then your Degree of financial leverage is going to go down for next year. Which isn’t catastrophic. But, it means that a similar gain in Operating profit next year won’t translate into the same boost in Net profit.

To get that, your small business would have to borrow more funds.

On the same token, if your company has a decrease in Operating profit this year, then your Degree of financial leverage will increase for next year. This increase will amplify the effects of a gain in Operating profit next year. But, it doesn’t necessarily mean that you’ll end up ahead of where you would have been if you would have increased Operating profit in year 1.

Shortcomings of the Degree of financial leverage ratio

Again, the Degree of financial leverage ratio is calculated as follows:

Operating profit (EBIT) ÷ (Operating profitInterest expense)

Big companies typically borrow money through the issuance of bonds. This means that they only pay interest until the bond matures.

Small businesses, like yours, don’t issue bonds. The nature of borrowing can vary, but often, loans are repaid on an installment basis. E.g. payments consist of both principal and interest.

So, a ratio that only measures the effects of Interest expense doesn’t completely capture the impact of financial leverage. For small businesses anyways.

Two extreme examples

First, consider a small business that borrowed 10x their previous year’s revenue. If they did so at a very low interest rate, their Degree of financial leverage would also be relatively low. But, having borrowed a disproportionate amount of money, they would theoretically have the opportunity to boost Sales/Operating profit greatly.

Also, consider the other extreme. What if a company borrowed a very modest amount of money? But, was forced to pay an exorbitant interest rate? In this instance, the Degree of financial leverage would be relatively high. But, the company’s opportunity to use this leverage in a beneficial manner is limited.

Finally, in order for the Degree of financial leverage to accurately predict the change in Net profit, Taxes must remain at a constant percentage. E.g. they can’t be 21% of Operating profitInterest expense (EBT) one year and 22% the next. The Forecasted Change in Net profit won’t equal what’s calculated in the Confirmation.

The amount of LT Debt and the Interest rate/expense must also remain constant for the “Operating profit × Degree of financial leverage = Change in Net profit” equation to work out.

So, obviously, the Degree of financial leverage has limitations. It is designed for big businesses – not necessarily small ones. It is based on amounts in the income statement, and not the cash flow statement. Thus, no consideration is taken for the effects of principal repayment.

If its limitations are kept in mind, and if reasonable changes are forecasted, then it can provide guidance on the potential benefits or detriments of financial leverage.

How financial leverage affects business decisions

Plug your small business’ information into the Your degree of financial leverage worksheet. It will help you better understand how your borrowing might help or hinder you in the coming year.

Financial leverage, in and of itself, is neither good nor bad. It’s all about how it’s employed. If it’s used to buy (rather than sell) consumable assets that provide little or no return – it’s wasted. If it’s allocated to resources that increase productivity (or earn extraordinary returns) – it’s a valuable tool for small businesses.

What are your thoughts on the use of financial leverage?

What are some of the advantages and disadvantages I neglected to include?

How about some ways that you’ve effectively employed financial leverage in your small business?

Join the conversation on Twitter!

Church Budget Example – Use This Template! [VIDEO]

church operating budget featured

Video Transcript

00:00 I’m gonna go over how to go about making
00:04 operating budget for your church some of
00:06 my previous videos you know I’ve done a
00:08 little more in depth with the individual
00:10 spreadsheets and how you know what each
00:12 field is about how its calculating
00:14 everything this time I’m going to try
00:16 something different I’m gonna stick to
00:18 kind of summarizing here and I’m gonna
00:19 put a link down in the description where
00:21 you can read the whole in-depth post
00:24 that covers every single aspect you know
00:27 in detail of the operating budget for
00:30 your church and the video here is just
00:32 gonna be kind of a summary so that being
00:34 said let’s get into it
00:36 we’ll start off here with a ordinarily
00:41 with a for-profit company you always
00:44 start with a revenue budget with the
00:45 church you have a little flexibility
00:47 there you start with a revenue budget or
00:48 with your expense budget so for the sake
00:52 of simplicity I’m going to walk through
00:54 this starting with the revenue budget
00:55 but you know it really is a matter of
00:59 private preference do to kind of
01:01 churches unique situations so revenue
01:04 budget is exactly what it sounds like
01:06 it’s a budget in a forecast for all of
01:08 the money you’re gonna bring in for the
01:10 year so in this case we’ve got the
01:13 different sources listed here offerings
01:15 donations facility whose charges trust
01:18 investments and other okay and we reject
01:21 them out for every month for the coming
01:23 year but the first month of our planning
01:25 period here so if you’re planning
01:27 creative begins in July or September or
01:29 whatever some other month with that in
01:32 there it’ll automatically populate it
01:33 out and all the forecasted amounts are
01:38 total by month and total by source also
01:42 point out real quick that all
01:44 spreadsheets for business templates
01:46 which there’ll be a link to the template
01:49 in the link to the post so you get that
01:53 by going to the post but all
01:56 spreadsheets for business workbooks the
02:00 white cells are adjustable okay the
02:02 colored in cells or other formulas or
02:03 their text so unless you really really
02:05 know what you’re doing don’t touch those
02:07 so revenue budget is pretty simple and
02:11 we’ll move on to the expense budgets now
02:16 let me get rid of the fixed cells here
02:21 there’s separate expense budgets for
02:25 each of the four kind of broad
02:26 categories of expenses the inspiration
02:29 for these categories comes from Bree mal
02:31 FERS if you’ve done any searching on
02:33 YouTube or on the web in regards to
02:36 Church strategic planning you’ve come
02:37 across
02:38 Audrey’s work and he’s does a great job
02:42 and you know definitely a good source of
02:47 information I’ve never seen him put
02:48 forth anything like this not to say that
02:50 he hasn’t that I used a lot of his
02:54 inspiration in creating this template
02:57 for budgeting so now he breaks it church
03:02 expenses into four broad categories
03:04 evangelism emissions personnel
03:06 ministries and facilities so as you can
03:09 sing along the bottom here that’s
03:10 exactly what we’ve done
03:12 each of these four budgets is formatted
03:15 in the same manner so for simplicity
03:17 sake we’ll just look at the evangelism
03:21 and missions budget here so what you got
03:26 at the top here is you know basically
03:29 when it would take those broad
03:30 categories expenses and break them down
03:31 into subcategories so do that first and
03:35 foremost for the evangelism missions
03:36 here and direct and Synod support
03:39 Convention Assessment local mission work
03:40 outreach etc of course each broad
03:44 category has its own separate sub
03:48 categories you came and you’ll notice
03:52 also you’ll have to fill those in
03:54 manually and also you’ll notice that
03:56 each bra subcategory of expenses gets
04:03 category wrap categorized as fixed or
04:06 variable and simply put the post goes in
04:11 a little more detail but you know fixed
04:14 is gonna be the same no matter your
04:16 level of revenue a more revenue less
04:19 revenue you would expect this expense to
04:21 stay the same
04:22 variable on the other hand you would
04:24 expect to increase with revenue and
04:25 decrease increase in decrease with
04:28 revenue less revenue less expense more
04:29 revenue more expense okay so you’ll see
04:32 that all these amounts are filled in
04:34 here a lot of them with zeros because
04:36 there’s a room for plenty of
04:38 subcategories well where’s that
04:39 information come it comes from down here
04:41 below this is where you get into the
04:42 detail okay so you’ll notice each sub
04:45 categories listed here and you can
04:47 detail expenses and this is where you
04:48 actually put in the inmense so you know
04:51 you take a broad category of expenses
04:53 break it down to subcategories break it
04:55 down further into details you know
04:58 depending on the sophistication of your
05:00 accounting software or your accountant
05:04 you know this could be these detailed
05:06 expenses here could be individual GL
05:08 accounts or whatever you want them to be
05:11 but as long as you address all expenses
05:14 that’s all that really matters it’s just
05:16 like I said kind of breaking things down
05:18 here into manageable chunks to where you
05:22 can forecast them out for every month in
05:26 the planning period then they’ll total
05:29 here and those totals will carry up here
05:32 okay so you’ll see like I said every
05:36 subcategory of expenses listed here with
05:39 plenty of room to entered detailed
05:42 expenses okay so you do that for
05:45 evangelism and admission you do that for
05:50 personnel do it for ministries it’s all
05:55 them all the same same format do it for
05:58 facilities so okay you better you expect
06:01 the revenue for the year then you
06:03 entered your expected expenses for the
06:07 year don’t forget like in this example
06:09 real quick here you’ll notice this ties
06:13 into the capital budgeting work that we
06:18 did – I like to make my workbooks tie
06:22 into each other so it can paint the
06:24 entire picture for you guys so that’s
06:26 what this means you know most of these
06:28 are Justin Eric detailed expenses but
06:30 this one here talks about snow removal
06:32 and it has to do with the
06:34 creation of a new parking lot that we
06:36 looked at in the capital budget so check
06:38 that video out to check that post out to
06:41 so and yeah once all expenses are
06:46 entered then that’s the biggest part of
06:51 budgeting okay all that’s going to carry
06:54 over here into your pro forma income
06:56 statement where you’ve got your total
06:58 revenue your total for each expense by
07:02 broad category okay and then we threw in
07:05 a percentage amount here
07:08 that’s a percentage of revenue if I
07:11 remember right yes it is okay just just
07:15 kind of paint the picture of what
07:18 categories are contributing most to your
07:20 expenses then we’ve got operating profit
07:23 which is revenue minus expenses one
07:27 other thing you have to fill in I mean
07:28 pro forma income statement here that
07:30 isn’t really covered elsewhere in the
07:31 operating budget is interest income in
07:35 interest expense okay so this is a will
07:39 have to be a forecast you’ll just have
07:41 to look at you know for income if you
07:44 have income earning assets savings you
07:49 know money market accounts something
07:52 that maybe earns a little more than that
07:54 dividends perhaps enter now here
07:57 interest expense it’s gonna depend in
07:58 large part on the amount you need to
08:00 borrow a lot of that will be covered in
08:02 the financial budget okay but you know
08:05 you can go ahead and do your financial
08:08 budget which I’ll cover in a later video
08:09 and a post that’s coming soon and circle
08:13 back around enter that information here
08:14 too okay you’re not gonna be graded on
08:18 your accuracy in terms of forecasting
08:20 this can be a living document come back
08:21 and change it as you need to
08:23 all right so operating profit minus
08:25 these interest expenses churches don’t
08:27 pay taxes so there’s net profit okay
08:32 there’s a couple of simple ratios left
08:34 in here that are applicable for churches
08:38 okay got profit margin which is pretty
08:39 self-explanatory you know your net
08:42 profit compared to you net sales times
08:44 interest earned looks at those
08:46 looks at interest expense and operating
08:50 profit how it relates to it degree of
08:53 financial leverage again the post will
08:54 get into more detail in degree of
08:56 operating leverage we’ll get more detail
08:58 on that too those are two interesting
09:00 concepts that basically tell you what
09:07 the based on degree of financial
09:10 leverage based on the amount of money
09:14 you borrow what effect increasing and
09:20 decreasing
09:21 operating profit would have on that or
09:25 the rather the effect you’ll have to
09:29 read the posts to get a detail because
09:30 if I start talking about it I’ll go on
09:32 for an hour here and like I said and try
09:34 to make this summary so basically the
09:39 effect of degree of financial leverage
09:41 is the effect of interest expense on
09:45 profit degree of operating leverage is
09:47 the effect of fixed expenses fixed costs
09:52 on profit okay and that’s why I asked
09:56 you guys to specify whether costs are
09:59 fixed or variable here okay so that’s
10:01 what that was for read more about that
10:03 like I said you’ve got the chart down
10:06 here pretty straightforward just an
10:08 illustration of what happens month by
10:10 month based off of your forecast you’ve
10:12 got the Green Line is revenue and then
10:15 you’ve got your different categories of
10:16 expenses here you can see how they rise
10:18 and fall in total and by categories so
10:22 one little extra bonus that I like to
10:26 add to my industry specific spreadsheets
10:29 is this likely best case worst case
10:33 scenario okay I think this is super
10:36 valuable you know and it’s it is another
10:39 step and the whole strategic planning
10:43 thing which is time-consuming in that
10:44 bed really is just the like I said the
10:50 plus one however you want to put it to
10:53 to the operating budget this is where
10:56 you know you’ve done you’ve been in put
10:58 your
10:59 expected revenue cost profit etc now you
11:02 get to toy with what the worst case
11:04 would be in the best case would be and
11:06 this just like most of strategic
11:08 planning
11:09 just get your mind working in that
11:10 direction so you’re you’re completely
11:14 comprehensively prepared for the
11:15 upcoming year okay so it starts off here
11:19 with the pro forma income statement
11:26 that’s what this is sure if it Proform
11:28 in there but yeah it’s a pro forma
11:31 income statement or rather this yeah
11:35 sorry okay so this is revenue up here
11:37 where you can toy with best cased amount
11:40 for each revenue source
11:45 worst case amount or you can just use a
11:48 generic multiplier okay so basically
11:52 what that means it’s like if I change
11:53 this worst case is gonna be negative in
11:55 the case of revenue the 15% you’re gonna
11:59 see these worst case amounts decrease
12:03 okay because I made the worst excuse me
12:08 in the worst case that much worse
12:10 okay but you have so you can change that
12:15 there it will affect everything in that
12:17 section but you also have the ability to
12:20 override it okay so see if we delete
12:25 this worst case would be 38,000 versus
12:31 42,000 for trust investments in the
12:34 quest but you know say you think no no
12:38 worst case could be worse than that or
12:40 worst case wouldn’t be quite as bad well
12:43 then you just override that amount okay
12:46 everything else is based off of this
12:48 multiplier but now you’ve overwritten it
12:51 with an amount so same same principle in
12:55 the best case I’d come down here to
12:58 expenses we have our abroad expense
13:00 categories again use a multiplier this
13:04 is just a ballpark figure the multiplier
13:06 basically if you know best-case in the
13:10 Fuhrer expects is going to be the
13:11 decrease
13:12 worst case for expenses gonna be the day
13:15 increase and I keep doing it
13:17 so keep that in mind and you can
13:20 override you don’t like what you see so
13:22 yeah just toy with it you know that’s
13:25 the whole point of this exercise just
13:28 toy with it see what playing with
13:32 different scenarios gives you what it
13:35 makes you think about what you might do
13:37 to plan to avoid a worst case what you
13:39 what planning you might do to take
13:41 advantage of the best case okay so just
13:44 like the pro forma income statement on
13:45 this executive summary
13:47 you got your operating profit here you
13:50 can see negative under worst case this
13:54 will match what’s on the executive
13:55 summary the ten thousand twenty eight
13:58 operating profit and best case
14:05 considerably better six times the
14:07 operating profit so that’s pretty good
14:10 it brings in interest income and expense
14:14 here also and then that profit always
14:20 calculated the exact same as it is on
14:21 the executive summary so then of course
14:25 the you know the whole purpose of ratios
14:26 is to kind of put amounts into
14:31 perspective from your financial
14:34 statements and the same thing takes
14:36 place here you know profit margin can
14:38 range from negative seventeen point
14:41 eight to twenty seven positive twenty
14:43 seven point two times interest earned
14:45 degree of financial leverage is going to
14:48 change all that it’s gonna going to
14:50 change based off of what you enter in
14:52 the best case in worst case fields above
14:57 some anyhow that’s quick rundown of the
15:01 church operating budget template you
15:04 know go get your own copy to toy with I
15:06 get his follow the link and there’ll be
15:10 a links on there follow a link to the
15:13 post there’ll be links on there to
15:14 download your own copy of it and then
15:16 you know you if you’re dealing with
15:18 concepts you’re not familiar with just
15:20 check out the post I’ve got more or less
15:22 every single field on here
15:24 addressed in there and you know if you
15:28 get stuck on something just check that
15:30 out and it’ll help you make sense what
15:33 you’re looking at so appreciate you
15:35 guys’s time appreciate you watching this
15:39 video if you have until this point the
15:41 very end YouTube it is a popularity
15:45 contest just like anything on the
15:47 Internet and if you like this video if
15:50 you think this seems like something
15:51 useful to you best way to let me know is
15:55 to either leave a comment down below or
16:00 better yet maybe I don’t know depends on
16:03 the YouTube algorithm comments are good
16:06 likes or good subscriptions are good I
16:08 know
16:10 alerts are good any of that stuff you
16:13 know I’ll feedbacks good I’ll crank out
16:16 more content there’s also a lot of stuff
16:19 to check out not just for churches but
16:22 for small businesses in general on
16:23 spreadsheets for business comm thanks
16:26 you guys take care