How Do I Make a Restaurant Inventory List? Avoid Wasting Money While Still Meeting Demand [VIDEO]

How Do I Make a Restaurant Inventory List featured & thumbnail

common excel questions

Download the restaurant spreadsheets

What is considered inventory for a restaurant? Video summary

Inventory information is only useful if it contains critical data. Having access to your restaurant’s most important information will help you make smart decisions for your restaurant.

Actual inventory levels must be consistently physically counted and compared to amounts listed in the software. Corrections in the software must be made if there is a discrepancy.

Many restaurant software tools will help to keep track of inventory. However, if they don’t, you can’t neglect this task. Even if they do, periodic inventory counts are still necessary.

What should a restaurant inventory list look like?

There are five fields that are critical for a restaurant inventory list.

These fields are:

  • Item
    • The name of what’s being counted
  • Unit of measure (UOM)
    • A consistent quantity that will be used for counting and costing
  • Quantity on hand (QOH)
    • How many UOM the restaurant currently owns
  • Item cost
    • Don’t count in one UOM and cost in another
  • Extended cost
    • QOH × Item cost
    • The total value of the inventory

Additionally, you can include other fields in your restaurant inventory list if appropriate. For example:

  • Category
    • Meat, vegetables, raw, prepared, etc.
  • Location
    • If you have more than one
  • Any other classification that helps you manage inventory

The restaurant inventory list

Fill out the critical fields for every item you own. If you must, it is okay to use multiple lines for the same item. The pivot table functionality of the spreadsheet can handle it.

Your restaurant’s POS (and other types of) software might be able to help with inventory management. It depends on the software functionality. Some software will track inventory usage. Your accounting software might track purchases too and may keep running inventory levels.

Not every piece of software will keep track of waste, spoilage, and other losses, however. Therefore…

Cycle counting of restaurant inventory will still always be necessary. This ensures that your inventory counts are accurate and you can meet demand and avoid waste.

Employees play an important part in inventory management. Consider giving them an incentive for accurate inventory counts. Explain to them the importance of accuracy.

When cycle counting – maintain a consistent schedule and stick to it! Inventory items with high turnover should be counted more frequently.

Finally, remember to track waste and food loss. Particularly if your software does not. During the hustle bustle of the workday, it may not be possible to accurately measure wasted quantities. Do your best to estimate them. Inventory amounts will be accurately adjusted next cycle count.

Utilize the Food Waste spreadsheet on the Why Spreadsheets Are Your Restaurant’s Best Friend workbook (download above). Also, take advantage of the other spreadsheets in the workbook including:

  • Scheduling template
  • Vendor order sheet
  • Daily prep list
  • Inventory control
  • Food/recipe costing
  • Food waste
  • Sales per day

More considerations regarding your restaurant inventory list

Only consumable items that you use to prepare food should be included in your inventory. Not every asset should be included here. Things such as flatware, cookware, glassware, etc. are not inventory.

It’s important to keep accurate records for these assets, but they are not inventory. Inventory is what you sell to your customers.

Again, make sure you’re using a consistent UOM for your inventory items. Use whatever is easiest to track. Whether it be Lbs, Gal, Oz, Cans, Cases, Flats, whatever – just stay consistent. Doing so will ensure that costly errors in counts and valuation aren’t made.

Food costs are rapidly changing. So what cost should you use?

Your POS or accounting system might track costs for you. If so, great. If not, it might make sense to assign a standard (expected) or average cost to inventory items.

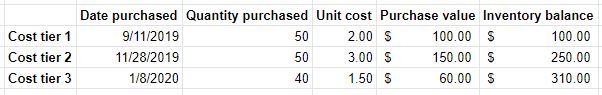
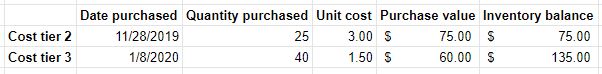
No matter what inventory cost you use, make sure you’re relieving inventory on a First In, First Out (FIFO) basis. E.g. use your oldest inventory first, assuming it’s fit for consumption, of course. No other industry has to wrestle with the issue of spoilage more than the restaurant industry. So, do what you can to avoid needless waste of inventory and dollars.

Again, at the risk of beating a dead horse, make sure your costs reflect your UOM.

Finally, one of the primary benefits of managing your restaurant inventory is that you can measure inventory days on hand. In order to do so, you must keep track of inventory usage on a daily basis.

Inventory days on hand = inventory on hand ÷ average daily usage. Assuming that you are meeting all of your customer’s demand (not running out of stock) then the lower your inventory days on hand, the better.

Questions about How Do I Make a Restaurant Inventory List?

What challenges do restaurants have with managing inventory?

Spoilage is one inventory problem that the restaurant industry is particularly prone to. Many inventory items, by necessity, have an extremely short shelf life.

Accountability is another. With so many different individuals handling and recording inventory, it can be difficult to ensure that QOH in your software matches reality.

Finally, running out of inventory can hurt customer service for a restaurant more than it can other industries. While other businesses can put an item on backorder for a customer – restaurants can not.

These are just a few. There are many more unique challenges that restaurants face in managing inventory.

How does one manage quality control and inventory control smartly in a restaurant for an owner who lives in another city?

Most importantly, it is critical to find employees that can be trusted to manage inventory smartly. Also, while you want every employee to use best practices when it comes to inventory management, you’ll probably want to have one trusted individual who will have ultimate accountability.

Which is the best software for inventory control in a restaurant?

There are a lot of options out there. However, a piece of software called Restaurant 365 seems to be pretty well regarded. I’ve never used it myself. So, I can’t attest to its quality. In my brief searching, though, I never saw any negative feedback. Pricing will run from $250 to more than $450 per month per location.

Spreadsheets are also often recommended. They take some work to get set up, but one major benefit is the ability to customize them to your needs. Feel free to download the inventory control spreadsheet above and check out the Why Spreadsheets Are Your Restaurant’s Best Friend post and video.

“How To Calculate Profit Margin?” Any Percentage

30% margin calculate featured

If you know the price of something, you can calculate the cost that will give you a 30% margin as follows: Cost = Price × 70% (1 – margin %).

In business, the very existence of an enterprise is determined by its profitability. Making a profit can be an elusive process, requiring a good understanding not only of the Cost of Goods Sold (COGS) but also the functions performed to sell the product or service.

There are many models that help define costs so that profit margins can be properly calculated. Choosing the best model is critical to establishing proper pricing levels. The math involved in calculating a 30%, 40%, or 60% margin isn’t the difficult part of the process. It is determining the right starting point that requires the most scrutiny and clarity.

Easy to Say But Hard to Do

The first thing to consider is – have all the relevant and pertinent costs been included in the final cost calculation? This is where many companies become confused and the process of determining costs can become quite complex.

Unless the true costs of a product or service are known, any calculation related to profit will not be accurate. This failure to incorporate all relevant costs could end up costing a company dearly.

It’s All About the Budget Baby!

Putting together the costs associated with a product/service includes much more than the obvious costs (material, labor). These are the beginning point for the calculation, but there are other areas that should also be included in the formula. Consider the following:

Invoice Amount

Does the invoice include any discounts for early payment or penalties for late payment? Those numbers should be included in the costing formula.

Handling Costs

If the item is delivered or picked up, there will be a separate cost involved in its transportation. There are also the costs associated with handling the item after its receipt like inventory and warehousing expenses.

Cost of Money

Products that sit on the shelf for an extended period of time have company money invested in them that is not producing at income while it is tied up in inventory. This is known as an opportunity cost.

Taxes

Like death, taxes are inevitable and the costs involved in paying taxes on inventory or property held at the end of a tax year can add to the product’s true cost. Inventory that turns quickly isn’t as much of a concern as inventory which takes a long time to get sold or used.

Overhead

This is always a loaded question with an explosive answer. What is overhead and how should it be allocated? Calculating overhead accurately is a science unto itself. Determining how to allocate it can be problematic at best.

Fudge Factor

Also known as “budget override” or “other costs.” This is an amount added to other costs to make sure nothing is left out of the calculated amount. In most cases, this is an additional 2% to 5% to help cover any unexpected changes.

Add It All Up and It Spells True Cost

The cost of acquisition, handling, overhead, and other considerations have been added up. A final total true cost has been determined. Now what?

With all that formulation and processing, the resultant number is one you can have confidence in. Now that we’ve looked over what the true costs are we can finally multiply it by 30%, 40%, 60% and there’s the sales price. Right?

No.

Markup is not the same as margin. But, more on that in a bit.

Price is what determines margin

Knowing the true cost is the first step, but now it’s time to look at the selling side of the equation. Here are some other factors to consider:

Cash Flow

Is the product or service sold and paid for immediately or does it go on an account for 30 days or more? Are there discounts offered for prompt payment or pre-payment of invoices? Will the buyer earn volume discounts for large orders or is a discount earned over time based on volume?

Associated Costs to Deliver

Sales programs offering free freight or trips to Hawaii for sales associates are additional costs that should be estimated when determining overall profitability.

Negotiation Protocols

Some companies state their prices and no one challenges those prices; other companies state a price but they know the customer will be negotiating the price based on different issues. Allowances should be made to include any fluctuations involved as a result of negotiating the price for the product or service provided.

After-sale Follow-up

Once the product or service has been delivered the costs associated with the transaction aren’t done accumulating. After-sale follow-up by customer service, warranty expenses, and product administrative costs like safety notifications or updates add up quickly and should be taken into account.

Inflationary Issues

Not all inventories are subject to inflationary conditions but many companies find themselves confronted by the costs associated with wider economic issues. Issues that could alter the costs of inventory or services. Construction, manufacturing, and many other industries are constantly facing changes in local, regional, and national economic conditions that affect their business at its most basic levels.

Margin vs Markup

These are two terms that are often mixed. They are similar (even sound similar!) but they are not the same.

Margin can only approach 100%. Markup can be an infinite percent.

Markup is based on cost. It is calculated by dividing profit (gross, operating, or net) by cost.

Say something costs $1.00. If it’s marked up 30%, the price would be $1.30. If it’s marked up 60% the price would be $1.60.

Margin is based on price. It is calculated by dividing profit (gross, operating, or net) by price.

Say something costs $1.00. If it has a 30% margin, the price would be $1.43. If it has a 40% margin, the price would be $1.67.

Price = Cost ÷ (1 – margin %)

Here are some more comparisons of margin and markup:

PriceCostMargin %Markup %
$1.00$1.000%0%
$1.43$1.0030%43%
$1.67$1.0040%67%
$2.50$1.0060%150%
$3.00$1.0067%200%
$4.00$1.0075%300%
markup vs margin graph
Click to enlarge

Retail, Wholesale, or Manufacturer – The Rules Still Apply

So, is a 30%, 40%, or 60% margin good?

It depends.

It depends on whether you are talking gross margin, operating margin, or net margin. It also depends on the industry and business model you are referring to. Every business and industry is different. What’s good and what isn’t can only be determined when comparing to an appropriate benchmark.

Some industries work with high profit margins and others work on minuscule margins.

Regardless of where an organization stands in the supply chain, the need to maintain profitability is important. Advanced accounting methods combined with software that can quickly search through data to extract the most important information makes the process of assigning costs much easier and much faster.

However, the need to incorporate all salient costs and related expenses can become burdensome and overly detailed if not monitored for accuracy and applicability. Traditional models have been replaced by highly-customized programs that reflect the conditions of individual companies rather than using industry-wide standards for calculating costs.

Protecting the Margin

Knowing the true and detailed costs of a product or service is critical in a competitive environment. If margins start to slip, most businesses will go to their suppliers looking to save money and maintain profit margins by asking for discounts. Or, they might take other cost-saving measures.

Any Way You Cut It, Margin Still Matters Most

The discussion over the difference between the terms “margin and “mark-up” are arguments over the same thing – profit. Unless an organization is a non-profit, its goal is to make a profit and to do so for as long as possible.

Net profit is often called the “bottom-line” and it still defines an organization’s character and capability to many. Every financial analyst, stockbroker, and business columnist focuses on a company’s ability to not only generate a profit margin but to do it repetitively and under a variety of conditions. Knowing the numbers and figures that determine the actual costs for a product or service leads to the opportunity to produce the desired margin more readily and realistically.,

FIFO Method – What It Is, Why & How to Use It

fifo method featured

FIFO is a method of valuing inventory and cost of goods sold (COGS).

FIFO is an acronym for First In, First Out. With the FIFO method, the assumption is made that the first products purchased (put into inventory) are the first to be sold (taken out of inventory). Note that this is only an assumption. If you use the FIFO method it doesn’t mean that you really have to physically sell the oldest pieces of inventory you have in stock.

There are many other methods of inventory valuation. One of those is LIFO. As you might have guessed, LIFO stands for Last In, First Out. Another is weighted-average cost.

Why use the FIFO method for inventory valuation?

The FIFO method is often used because of its simplicity. It is also used because it gives a more accurate representation of inventory and COGS balances.

If costs are rising, as they often do, the FIFO method is also going to allow your small business to report greater profits. Because, it’s the older, cheaper, inventory that will be moved to COGS first.

Also, not that it matters much to your typical small business, but many countries outside of the United States are required to use FIFO by International Financial Reporting Standards (IFRS). The FIFO method is widely used and widely understood.

Why use a different method than FIFO?

FIFO has its advantages, as outlined above. But, it also has some disadvantages. Or, at the very least, some characteristics that make FIFO less appealing than other valuation systems.

Just as FIFO makes net income look bigger when costs are rising, it will also make it smaller when costs are falling. Falling costs are rare, but it does happen.

Plus, keep in mind that a higher net income also results in higher taxes. But, a higher profit will probably make your business more appealing if you were to decide to sell. So, it’s kind of a double-edged sword.

Beware, however, if costs are rising really fast. In circumstances such as these, you might run the risk of overstating profit using the FIFO method.

Also, while calculating FIFO balances is typically easier than LIFO, it’s not necessarily as simple as a standard costing system.

How is FIFO calculated?

To value inventory and COGS using the FIFO method you (or more likely your software) will need to keep track of something called costs tiers.

Every time you purchase (or manufacture) a specific quantity of inventory, at a specific cost – a cost tier is created.

Here is an example of three distinct cost tiers. Notice how each has a different Date purchased, Quantity purchased, and Unit cost.

fifo cost tiers

Purchase value = Quantity purchased × Unit cost

Inventory balance = running total of Purchase value

As inventory is sold (or used in production) it is the oldest (First In) tiers that are relieved first (First Out).

This means that the cost you paid for the oldest inventory is what moves to COGS. The value of the more recently purchased products is what will remain in inventory. Of course, if you sell all of the products you have in stock, nothing will remain in inventory.

Next time you sell (consume) this product, the next oldest inventory will move to COGS. And on and on it goes while costing with the FIFO method.

FIFO method example

For this example we’ll use the same cost tiers from the image above.

On September 11, you bought 50 units of a product. You spent $2.00 dollars each. That’s your first Cost tier.

Then, on November 28, you purchased another 50 units at $3.00 each. That would be Cost tier 2.

Finally, on January 8, you purchased 40 more units at $1.50 each. Cost tier 3.

We’ll assume that you didn’t sell any of this product between September 11 and January 8.

So, you now have 140 units in stock at a total cost of $310.00. This total cost is comprised of three Cost tiers.

Your average cost is $2.21 each ($310.00 ÷ 140 units). Your first units were purchased at $2.00 each. Your last units were purchased at $1.50 each.

fifo cost tiers
Same image as above

Now, let’s assume that you sell (use) 75 units out of inventory. What are those 75 units going to cost each?

$2.21? No. That’s the average cost.

$2.20? No. That’s LIFO.
(40 × $1.50 = $60
35 × $3.00 = $105
$105 + $60 = $165
$165 ÷ 75 = $2.20)

$2.33? Yes. That’s the cost using the FIFO method.
(50 × $2.00 = $100
25 × $3.00 = $75
$100 + $75 = $175
$175 ÷ 75 = $2.33)

In order to calculate your COGS with the FIFO method, you’re going to start with the oldest (First In) cost tier. That cost tier has 50 units at a cost of $2.00 each.

Since 75 units were sold, that leaves 25 more to account for. Of course, those units will come from the next oldest cost tier. That cost tier has a Unit cost of $3.00 each.

So, we know that 50 of the units cost $2.00 each and that 25 of the units cost $3.00 each. This means that the total COGS is $175 and the cost per unit is $2.33.

Not too hard, right?

But, where’s that leave inventory?

With Cost tier 1 depleted and Cost tier 2 relieved of 25 units, the inventory balance is calculated as follows:

fifo cost tiers after sale

Cost tier 3 remains untouched. Cost tier 2 only has 25 units left in it.

The total value of inventory is now $135. Of the original $310 in inventory, $175 of it was sold (via the FIFO method) and $135 remains.

That’s it! This is what happens when you use the FIFO method for inventory and COGS valuation. Once you understand the basic principles, hopefully you’ll see that it is pretty simple and straightforward. It facilitates logical and consistent valuation of inventory for your small business.

FIFO Method? Weighted Avg? The Full Model of Process Costing

process-costing-weighted-average-vs-fifo-featured

There are two methods that can be used to allocate costs in a process costing system. They are weighted average or FIFO (First In First Out). Accountants and business owners can decide which method to use based on their preference for simplicity or accuracy. Of course, there are differences between the two methods. But, they also share similarities…

The FIFO and weighted-average methods each always use these same inputs:

  • Ending WIP units
  • Percentage complete for materials & conversion
  • Amount spent on materials & conversion

Here’s a look at some of the differences between the weighted-average and FIFO methods (by step):

Unit ReconciliationCost/Equivalent UnitCost Allocation
Weighted-average method
Considers begin WIP 0% completeAllocates the value of begin WIPBegin WIP + Monthly expenses =
Amt completed & transferred + End WIP
FIFO method
Considers begin WIP partially completeAllocates expenses incurredMonthly expenses = Amt to
complete begin WIP + Amt started & completed + End WIP

Both methods are, generally speaking, similar. Which you should use depends in large part on preference. It also depends on your ability to conceptualize what is taking place.

A process costing system is primarily used by manufacturing companies that mass-produce a bunch of the same product. A process costing system can be contrasted with a job order costing system. A job order costing system would be used by companies that offer custom products and/or services.

Download the example workbook

Looking for a spreadsheet to build an entire process costing system (weighted-average method)? Read this post:
DEFINITION AND FEATURES OF A PROCESS COSTING SYSTEM

Complete the form below and click Submit.
Upon email confirmation, the workbook will open in a new tab.

Process costing – FIFO vs weighted-average

Need more help with your accounting homework? Read this:
WORKSHEET POSTS

The weighted-average method might be considered simpler. But, the FIFO method might be considered more accurate. That being said, once the groundwork is laid for a FIFO process costing system, calculations should be made automatically and require a minimum of effort on your part. That is…if everything’s set up correctly.

Below, I’ll compare the calculations from the weighted average and FIFO methods. Each will refer to the same inputs – Item1, Dept A, from the Process Costing workbook. That way, you’ll be able to compare the two methods side-by-side, apples-to-apples, and decide which makes the most sense for your company. Then, you can move on to more pressing matters.

Unit reconciliation

Have more questions about the FIFO method of costing? Read this post:
FIFO METHOD – WHAT IT IS, WHY & HOW TO USE IT

process-costing-weighted-average-vs-fifo-unit-reconciliation

The purpose of unit reconciliation is to determine the total number of units to allocate costs across in a given month.

Obviously, those units that were completed will be included. But, also factored in, are “equivalent units.”

Equivalent units

Equivalent units = WIP units × Pct complete

These units are calculated for direct materials (DM), direct labor, and overhead individually. Why? Because these value-added costs are not applied uniformly.

For simplicity’s sake, overhead is assumed to be applied on the basis of direct labor hours. These two costs are, therefore, combined in this example and called conversion (costs).

Pct complete examples

For example, a particular product might have all its materials added immediately when it enters a department. The labor and overhead, however, might be added at a slower pace as those materials are assembled, mixed, machined, or whatever… In this case, the percentage (Pct) complete might be high for DM, but low for conversion.

Conversely, the most costly direct materials might be added during the last operation in a department. Since a lot of conversion costs have been applied, but the most expensive DM are not added until the end, the Pct complete might be high for conversion, but low for DM.

Hopefully, that makes sense. Reread it if you need to.

It all depends on the product being produced and the nature of the value-added in a given department.

Beginning WIP units

You’ll notice that Beginning WIP units aren’t factored into the unit reconciliation calculation for the weighted-average method. With the weighted-average method, Beginning WIP is considered to be started & completed in the current month.

No matter if last month’s Ending WIP units were 99% complete for DM and conversion costs. This month, Beginning WIP units are considered 0% complete. Under the weighted-average method, that is.

With the FIFO method, Beginning WIP units are included in Total units reconciled. Specifically, the equivalent units that weren’t included in last month’s calculation. For example, suppose last month’s Ending WIP units were considered 30% complete. Then, this month 70% of the Beginning WIP units will be used in the Total units reconciled calculation this month.

In fact, if you change the Pct complete for DM and conversion to 0% for the FIFO method, you’ll see that the Total units reconciled are the exact same amount for both methods.

DIFFERENCE 1: THE WEIGHTED-AVERAGE METHOD CONSIDERS BEGINNING WIP TO BE 0% COMPLETE. THE FIFO METHOD DOES NOT.

Completed & transferred vs started & completed

This subtle difference in verbiage makes a big difference in calculations between the weighted average and FIFO methods.

As mentioned above, Beginning WIP is always considered to be 0% complete with the weighted-average method. Ending equivalent units are added to Units completed & transferred to determine the Total units reconciled with the weighted-average method.

With the FIFO method, that is not the case. Since Beginning WIP units are already considered partially complete, Units started & completed are quantified separately. As the title implies – these are units that were both started and finished in a given month.

Total units reconciled

The weighted-average method adds the Ending WIP equivalent units to the Units completed & transferred to arrive a quantity for units reconciled.

The FIFO method does something similar. Ending WIP equivalent units are added to Units started & completed. Beginning WIP equivalent units (1 – Pct complete) are then also added to that quantity.

Cost per equivalent unit

process-costing-weighted-average-vs-fifo-cost-per-equivalent-unit

Unit reconciliation only focuses on units. No costs were considered. Now, it’s time to tally costs for the month and to calculate a Cost per equivalent unit.

Cost per equivalent unit = costs to be allocated ÷ Total units reconciled

Comparing total costs between months, years, or even days doesn’t give you the whole picture. In order to have the whole picture, total costs must be compared using some sort of common denominator.

Hence the need to break costs down on an equivalent unit basis. Equivalent units take into consideration how many units were started, completed, transferred, and left in WIP at the end of the month. Every unit and every dollar is accounted for. So that accurate comparisons can be made.

Total costs to be allocated with the weighted-average method includes the value of Beginning WIP + Monthly expenses incurred. So, since Beginning WIP units were considered 0% complete and added to the Total units reconciled, the Beginning WIP amount (last month’s Ending WIP amount) is also included in the numerator to offset these units.

DIFFERENCE 2: THE WEIGHTED-AVERAGE METHOD ALLOCATES THE VALUE OF BEGINNING (LAST MONTH’S ENDING) WIP. THE FIFO METHOD ONLY ALLOCATES EXPENSES INCURRED THIS MONTH.

Total costs to be allocated under the FIFO method only includes the Monthly expenses incurred. Only costs from this month are used to calculate Cost per equivalent unit. Because, unlike the weighted-average method, only units from this month are reconciled.

Because the weighted-average method includes the value of Beginning WIP and the FIFO method does not, the weighted-average method will always have higher Total costs to be allocated. Whether that translates into a higher Cost per equivalent unit depends on the Beginning WIP units and the Units started & completed.

Cost allocation

process-costing-weighted-average-vs-fifo-cost-allocation

Whereas the Total costs to be allocated include costs that the company started the month with (weighted-average method) and those that were added. The Total cost allocation includes costs that were passed to the next department (or finished goods) and those that the company ended the month with.

The Total costs to be allocated should always equal the Total cost allocation. Costs can’t just disappear into thin air.

In the weighted-average method, the equation balances as follows:

Beginning WIP amount + Monthly expenses = Amount completed and transferred + Ending WIP amount

In the FIFO method, the equation balances as follows:

Monthly expenses = Amount to complete beginning WIP + Amount started and completed + Ending WIP amount

Weighted-average or FIFO for process costing?

Conventional wisdom says that the weighted average method is simpler than the FIFO method. I suppose this is said because Amount to complete beginning WIP need not be calculated for the weighted-average method.

Do you have homework questions about a job order costing system too? Read this post:
JOB ORDER COSTING SYSTEM – EXAMPLE, TEMPLATE, & HOW-TO

But, since you will be determining the Pct complete for DM and conversion costs for Ending WIP units (which will become your quantities for next month’s Beginning WIP units) it shouldn’t matter. The calculation is already made.

Learn more about cost minimization here.

Better to go with the method that produces a more accurate Cost per equivalent unit. Rather than one that blurs the lines between what was done last month and what was done this month. Particularly if you are in a super-competitive environment where accurate costs are needed to price appropriately.

Yes, I know that the Spreadsheets for Business Process Costing example workbook uses the weighted-average method. Confession: it wasn’t until I wrote this post that I really explored the difference between the two methods. If it ever makes sense to redo the process costing example workbook, I will use the FIFO method.

What do you think? Are there any circumstances where the weighted-average method makes more sense?

Is there something I missed? Or, do you have any questions?

Join the conversation on Twitter!