QuickBooks Online Products & Services – 6 Min Read With Pics

qbo products and services featured

Products and services can be easily added and maintained in QuickBooks Online.

Products and services in QBO are the items you buy and sell to conduct business. Keeping this list of items well maintained will help ensure that your sales and purchase forms have the information they need. It will also contribute to more useful reporting for your small business.

What are products and services in QuickBooks Online?

Products and services are the items that appear on sales and purchase forms. If you plan on using these forms, then you should take the time to enter all your products and services into QBO.

Each item will be linked to an account in your Chart of Accounts. Every time a product or service transaction takes place, an entry is made.

Whether you sell products, services, or both depends on the industry you’re in and the nature of your business.
quickbooks online types of items
Credit: qbo.intuit.com

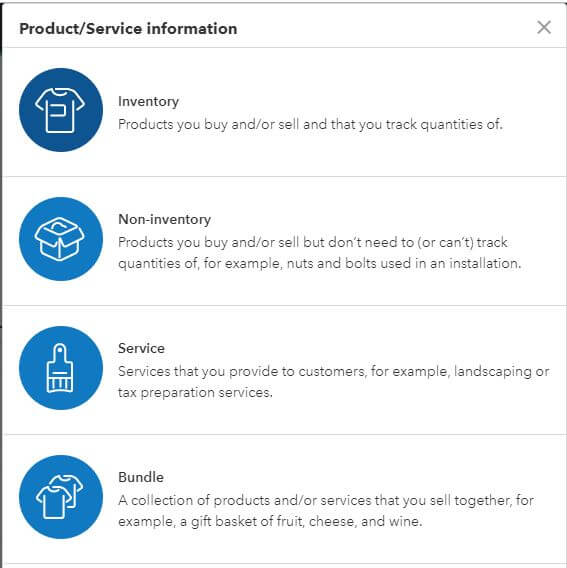
Inventory

These are products that you purchase and/or sell. Inventory quantities are tracked. In order to manage inventory, you must have a QBO Plus subscription.

For example, if you own a boutique clothing store, the clothes you sell would be inventory.

Non-inventory

These are items that you buy and sell but don’t want to keep track of the quantity on hand.

Hand soap for an auto mechanic is an example of a non-inventory item.

Service

This is something that you sell which is intangible.

Delivery of your product is an example.

Bundle

A grouping of products and/or services that you sell together.

A restaurant that offers a meal (main, side, and drink) is an example of a bundle.

Products and services settings
sales settings
Credit: qbo.intuit.com

If you’ll remember, Products and Services settings are accessed by clicking the gear icon in the upper-right. Then Accounts and Settings (below Your Company).

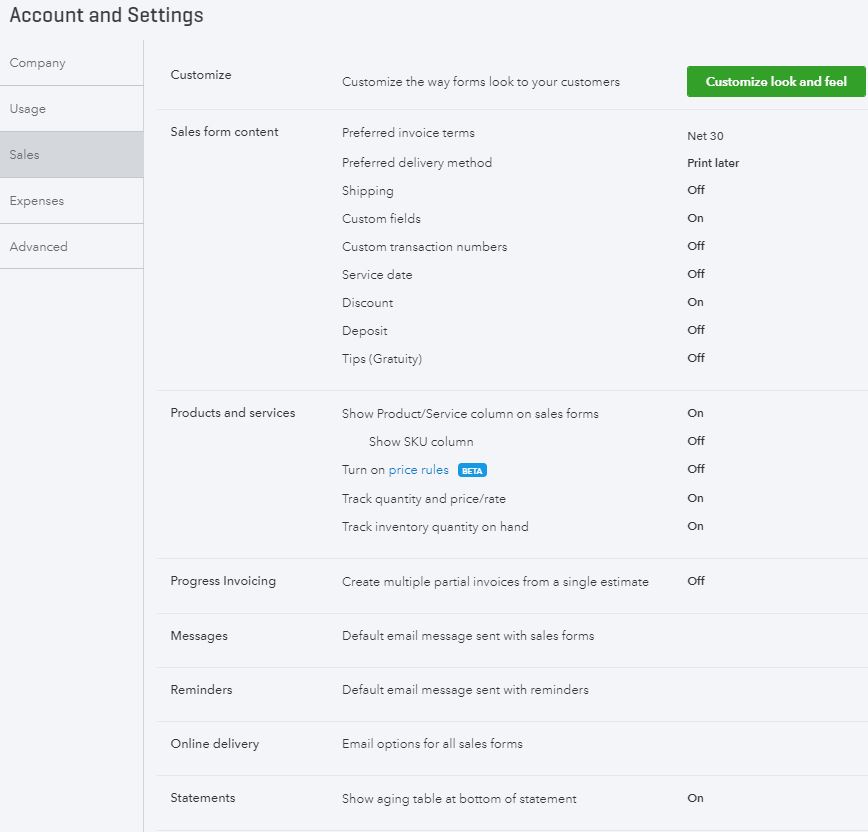
Products and services settings are a sub-section of Sales settings. Check the box next to the features you want to utilize and click “Save” when you are finished.

Show Product/Service column on sales forms

This option must be turned on in order for the product/service column to appear on sales forms. If it is off, your customers won’t see details about the products and services involved in the transaction.

Show SKU column

SKUs are used to track inventory. Turning on this feature will add a SKU/barcode column to sales forms. If you have a considerable amount of inventory to track, you should check the box to turn this on.

Turn on price rules

Read this post to learn more about price rules. Price rules allow you to give discounts on certain products and to certain customers.

Track quantity and price/rate

Turn this on too if you track inventory. It will add rate and quantity fields to estimates, invoices, and sales receipts.

Track inventory quantity on hand

Another feature that should be turned on if you plan to track inventory. Once you do, QBO will keep track to stock levels for products.

How to add products and services to QuickBooks Online
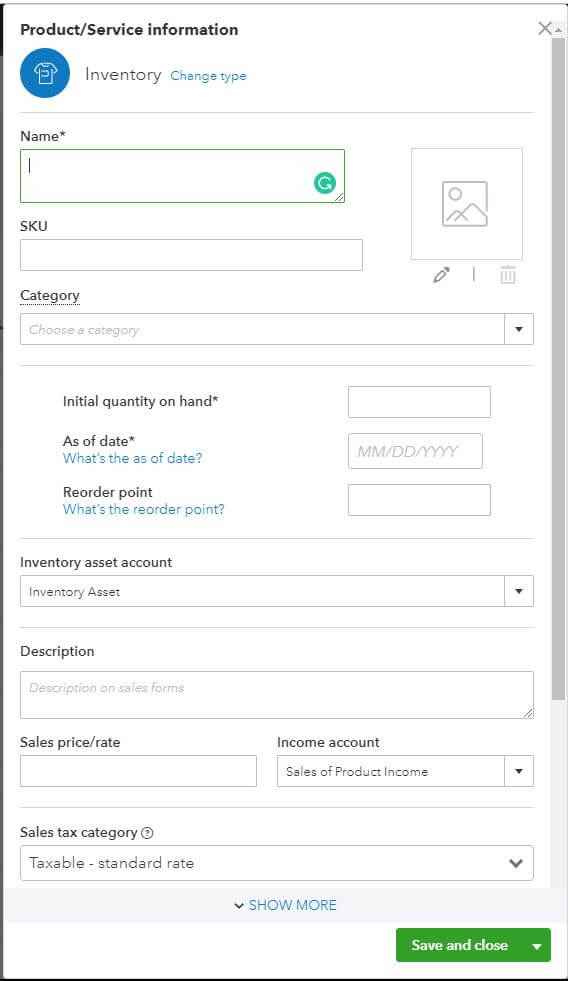
qbo enter new inventory item
Credit: qbo.intuit.com

Every product or service you add will start with clicking on the gear icon in the upper-right part of the screen. From here, you will select “Products and Services” underneath Lists.

Next, select click on the green New button.

Choose whether you want to add an Inventory item, Non-inventory item, Service, or Bundle.

There are several fields to complete here. The more detailed information you can provide, the better your reporting will be in the future.

Keep in mind that the available fields will be slightly different depending on the type of item you’re adding.

Name and SKU

Name is a description of the product or service. Make it detailed enough, but be aware of the space it will take up on forms and reports.

SKU is a unique combination of letters and numbers used to identify a product or service. You can look at it as shorthand for a given product or service.

Category

If you have many products and services, you can group similar ones into categories. Doing so will allow you to better organize your items.

Initial quantity on hand (Inventory)

Enter the number of units you had in stock on the As of date (below). If your As of date is today, then enter your QOH right now.

As of date (Inventory)

This is when you will begin tracking inventory levels. The As of date can be any date in the past. Your current inventory level will depend on the Initial quantity on hand (above) and the inventory transactions that have taken place since the As of date.

Reorder point (Inventory)

If you would like to be alerted if the quantity on hand drops below a specific level – enter that level here.

Inventory asset account (Inventory)

This is the account where the value of your inventory on hand will be recorded for the balance sheet. By default “Inventory Asset” is selected. If you would like to use a different account, select “+ Add new.”

Description

If you are going to offer this product/service for sale to customers, make sure the checkbox is checked.

Also, write a description for the product or service which will show up on customers’ sales forms. This can be the same as the item’s Name or different.

Sales price/rate

This is the standard price you will charge for this product or service. Don’t worry if you want to charge different customers different rates. You can specify that later, in price rules.

Income account

Here, select the appropriate account to record sales of the product/service to.

Sales tax category (Inventory)

If sales tax has not been set up in QBO, then you might not see this field. Best to have sales tax set up correctly so that QBO can keep track of it accurately.

The Sales tax category you choose will determine the amount owed depending on what the item is and where you sell it.

Two options will be available by default ” Taxable – standard rate” and “Nontaxable.” You’ll also have the option to “Choose a special category” if this inventory item is of a specific type.

If you “Choose a special category” you’ll be taken to a list of item types and sub-types. Choose the appropriate item type and click “Done.”

qbo new inventory choose special category sales tax type
Credit: qbo.intuit.com

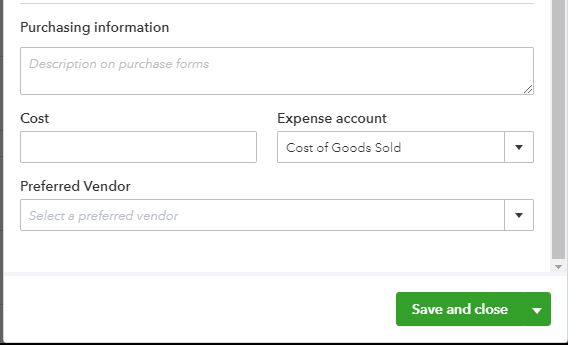
Purchasing information

qbo enter new inventory item show more
Credit: qbo.intuit.com

If this is a product or service that you will be purchasing from a vendor, check this box.

Doing so will cause some other options to appear.

Enter the description for this item you’d like to see on purchase forms.

Cost

This is the standard (typical) cost for this item.

Expense account

Like the Income account, this is where purchases of this item will be recorded to.

Preferred Vendor

Choosing a Preferred Vendor for purchased items will speed up purchase order and bill creation.

Select “Add new” if your Preferred Vendor for this item isn’t set up yet. Then, all you’ll need to do is enter a Name for the vendor to make them preferred.

Click Save and close when you’re done.

You’ll then be taken to the Products and Services screen where you will see your newly-created item.

Save time by making duplicates of similar products and services
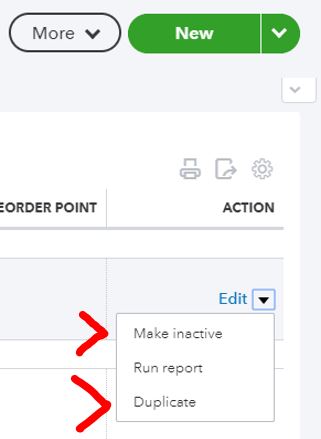
quickbooks online make product or service inactive or duplicate
Credit: qbo.intuit.com

If you’re entering a product/service that is very similar to an existing one – save time by making a copy.

From the Products and Services screen, select the similar product/service and click the down arrow (▼) by the word “Edit” in the Action column. Select “Duplicate.”

The Product/Service Information window will pop up with fields already populated. Make the needed changes and then click “Save and close.”

Importing lists of products and services into QuickBooks Online

qbo import sample file products and services
Click to enlarge
Credit: qbo.intuit.com

If you have a lot of new products and services to set up, you might consider importing them into QuickBooks Online.

You will need to have the items (with relevant information ) in a spreadsheet. By downloading the sample file, you can see the order of the columns and the naming conventions. To avoid error, it’s advised to simply fill in your item information into the sample file. Once you’re done, save the file in a location where you can find it.

The columns included in the sample file will depend on the options you choose when setting up the company (in Account and Settings).

When you’re ready to upload, go to Sales Center and select the Products and Services tab. Choose “Import a file.”

Browse for the saved spreadsheet and select “Open.”

Ensure that all item information is in the correct fields and click “Import.”

Also, here’s a handy tip:

If you want to update your pricing, across-the-board, you can export a product and services list. Then, you can update prices in a spreadsheet and re-import.

Delete a QuickBooks Online product or service

Is your Products and Services list getting cluttered with obsolete items?

You can reduce the clutter by deleting them. Technically, you’re making them “Inactive.” But, the effect is the same.

To do so, click the checkbox on the left-hand side of the page. Then, at the top, select the Batch actions dropdown. Select “Make inactive” then click “Yes” to confirm.

Change the columns in the Products and Services list
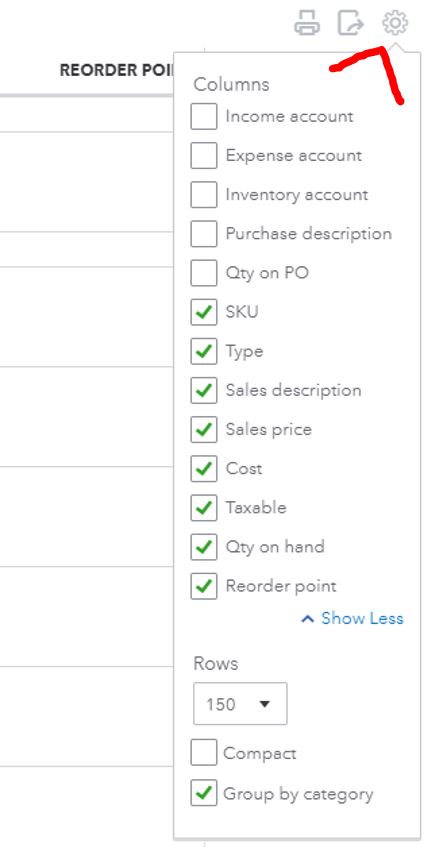
quickbooks online products and services change columns
Credit: qbo.intuit.com

Another action you can take if you feel like the Products and Services list is too cluttered is to remove columns. You can also add them too.

To do so, click the gear icon. Not the one in the far upper right, the one above the Action heading on the right side of the list.

Here, you’ll see every available column (after you click “Show more”). Click the checkboxes to toggle them on/off.

You can also determine how many rows you’d like to see in the Products and Services list. Plus you can “Compact” the list and “Group by category.”

QuickBooks Online products and services

With your products and services set up, maybe you’re ready to run some periodic sales promotions? Read this post to see how to do that in QBO.

Do you have any other tips or tricks for managing your products and services in QuickBooks Online?

Talk to me on Twitter!

QuickBooks Online Chart of Accounts Setup & Optimization


A customized QBO Chart of Accounts will help ensure that your financial reporting tells you what you need to know to run your small business.

Setting up the Chart of Accounts helps small businesses get off on the right foot in QuickBooks Online. Doing so will help you avoid reporting errors and confusion. A customized QuickBooks Online Chart of Accounts will help you run better reporting. This will help you manage your small business more effectively.

Many people don’t even know what a Chart of Accounts is. Those who do, usually don’t want anything to do with it. It’s a technical accounting task and it seems complicated.

Your (or your bookkeeper/accountant’s) answers to the QuickBooks Online startup questions will determine your default Chart of Accounts. Customizations should still be made to make sure it suits your needs in the future.

What is the QuickBooks Online Chart of Accounts?

A Chart of Accounts is the collection of the categories that make up your business’ financial statements. Every financial transaction your business creates ends up in one (or more) categories.

Examples of categories are:

  • Income
    • Product sales
    • Service sales
    • Discounts
  • Expenses
    • Cost of sales
      • Material
      • Labor
      • Overhead
    • Marketing
    • Your salary
  • Assets
    • Cash
    • Accounts receivable
    • Inventory
    • Equipment
    • Real estate
  • Liabilities
    • Accounts payable
    • Loans outstanding
  • Equity
    • Common stock
    • Retained earnings
quickbooks online navigate to chart of accounts
Click to enlarge
Credit: qbo.intuit.com

Where do I find the Chart of Accounts in QuickBooks Online?
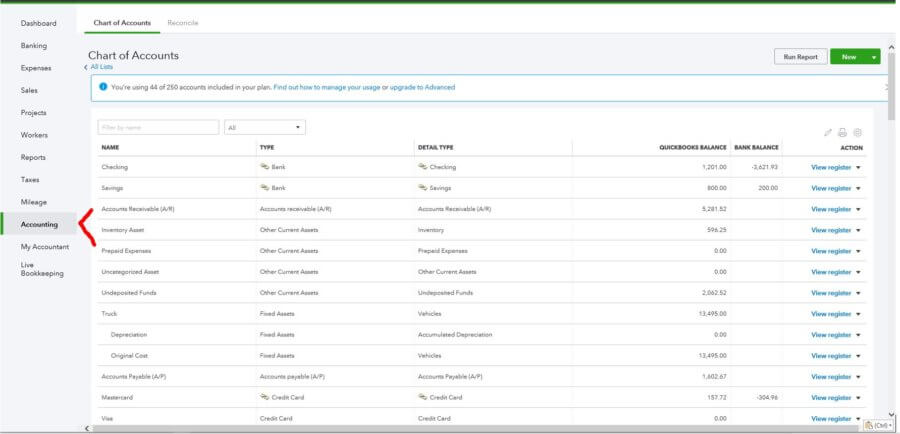
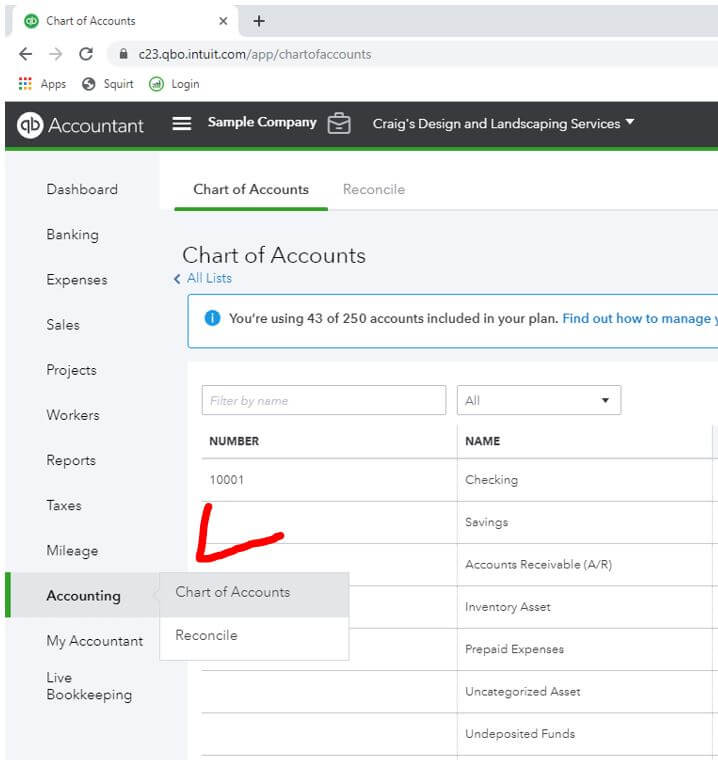
Hover over Accounting in the left-hand menu. Select Chart of Accounts.

quickbooks online left menu chart of accounts
Credit: qbo.intuit.com

Customizing the QuickBooks Online Chart of Accounts

A customized Chart of Accounts in QBO will allow your financial statements to better convey valuable information. Having titled accounts, in the correct order, will prioritize information. Additionally, it reduces the chance of errors and confusion.

Some accounts can not be changed. Accounts Receivable (A/R) and Accounts Payable(A/P), for example.

Other accounts will be created depending on the settings you choose.

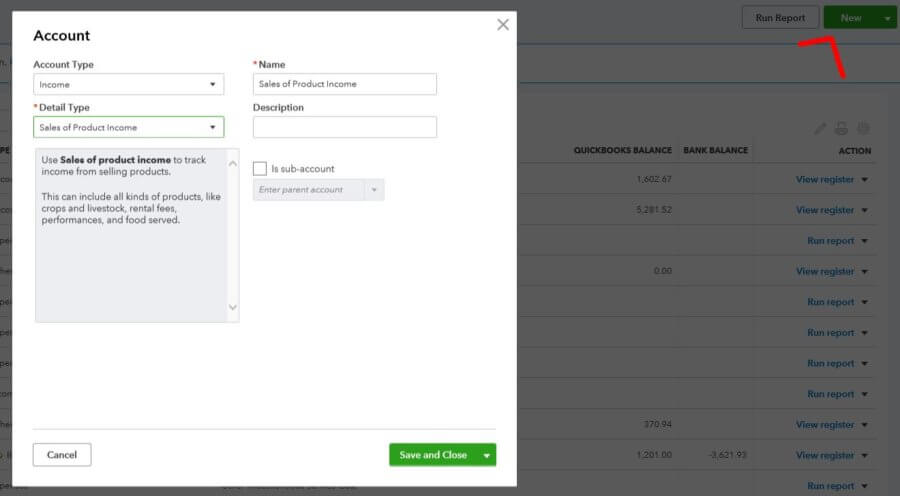
If you create a new account, you’ll be asked to specify an Account and Detail Type. This is very important! What you choose will determine what financial statement this account shows up on. You don’t want a Liability account appearing on the Income Statement. Or an Expense account reflecting as Equity on the Balance Sheet.

New accounts

quickbooks online chart of accounts create new
Click to enlarge
Credit: qbo.intuit.com

While in the Chart of Accounts, select the green “New” box in the upper-right corner.

The Account Type you select will give you different options for Detail Type.

Select the Account Type and Detail Type that are most appropriate.

If you would like to Name the account something different, you can do so. A Description can also be entered if you’d like to give more clarification.

Do consider making new accounts for each checking, savings, credit card, and loan account. Also, for your major sources of revenue and expenses. You’ll be glad you have these itemized when you run your financial statements.

Sub-accounts

Sub-accounts break down the balance in an account into subtotals. For instance, a restaurant might have an Equipment account with a balance of $30,000. The Equipment account might have two sub-accounts with balances as follows:

Vehicles: $20,000
Oven: $10,000

The use of sub-accounts allows you to run summary statements and detailed statements depending on how deep you want to dive.

Editing existing accounts

Accounts can be edited by clicking the dropdown arrow (▼) in the Action column. The arrow will be next to View register or Run report. Click “Edit” to make changes.

Some changes will not be allowed by QuickBooks Online. Others will give you a warning that accounting/reporting will be affected.

Think about renaming accounts so that they better reflect your business. Also, don’t hesitate to delete those that you won’t need.

quickbooks online edit chart of accounts
Credit: qbo.intuit.com

Deleting/making accounts inactive

You might not need all the default accounts. Or, if you’ve been in business for a while, you might have accounts that you no longer need.

There’s a sweet spot for the number of accounts you should have. Just enough detail to give you the information you need. Yet, not so many accounts that your financial statements are overly bloated.

You can make accounts inactive by selecting the dropdown arrow (▼) in the Action column. Select “Make inactive.” Remember that not all accounts can be deleted.

If you find yourself regretting the deletion of an account, you can restore it. Just click the gear icon above the Action header and check the “Include inactive” box. Find your mistakenly deleted account and click “Make active.” It’s like it never happened…

quickbooks online restore deleted account
Credit: qbo.intuit.com

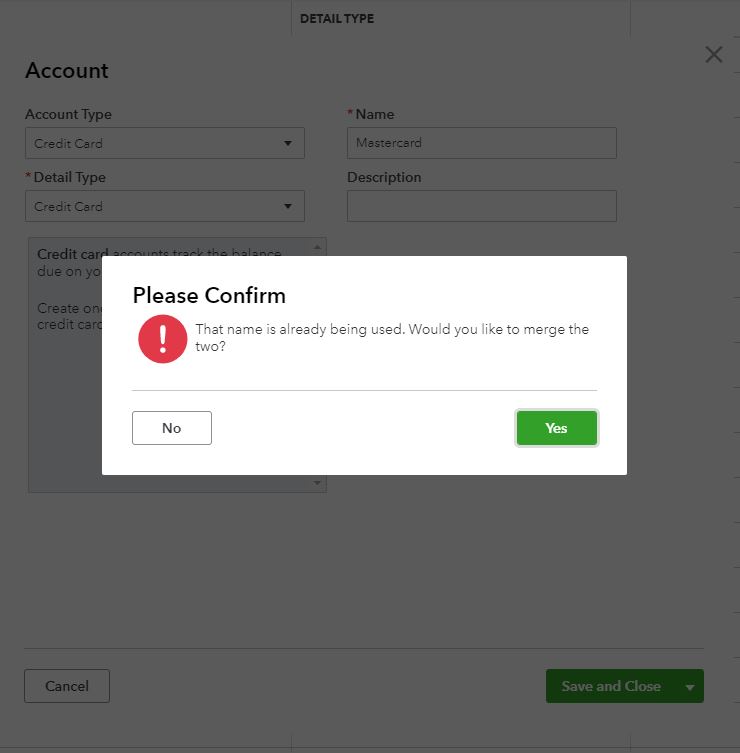
Merging accounts

Maybe, at one time, you thought you wanted two similar, but distinct accounts? But, you came to realize that the distinction was unnecessary.

No worries, accounts can be merged. But, keep in mind that this is a permanent change!

Simply copy the Name of the account you want to keep. Paste that name into the account you don’t need anymore. Make sure the Account and Detail Type are the same. Also, if applicable, make sure that the same parent account is specified.

That’s it! Your Chart of Accounts is now a little less cluttered!

quickbooks online merging accounts confirm

Other tips for optimizing your Chart of Accounts

Once in awhile review your Chart of Accounts to make sure it is still set up to serve you best. Here are some things to review (Credit):

  1. Note accounts that have a $0 or very low balance – consider deleting or merging
  2. Review all account names to ensure that they are accurate and descriptive
  3. Create parent/sub-account relationships where appropriate

QuickBooks Online Chart of Accounts

Are there any other tips or tricks you use to make sure your Chart of Accounts is optimized?

Talk to me on Twitter!

Yes, You Can Have More Than One QuickBooks Online Company

qbo settings featured

When you create a new QuickBooks Online company, take the time to review the settings and make sure your business gets off on the right foot.

Account & Settings is where a small business owner can customize their QBO experience. From communications with vendors and customers to detailed accounting settings. Reviewing these options will allow you to convey the image you want to your customers and give you the information you need to manage your business.

One account, multiple QuickBooks Online companies

You can have multiple QuickBooks Online companies under one account. Each company will need its own subscription plan.

If you currently have multiple companies under multiple accounts, you can merge them.

Here’s how:

  1. Sign in with the account you no longer want to use
  2. Send an invite to the account you do want to use
    1. From the company you want to switch accounts on
    2. Choose “Company Admin” as the user type
  3. Open the email for the account you want to use – click the invite link

If you can’t send an invite, you don’t have the correct administrative privileges.

QuickBooks Online settings

Click the gear icon in the upper-right

Select Account & Settings.

quickbooks online account & settings click gear icon
Click to enlarge
Credit: qbo.intuit.com

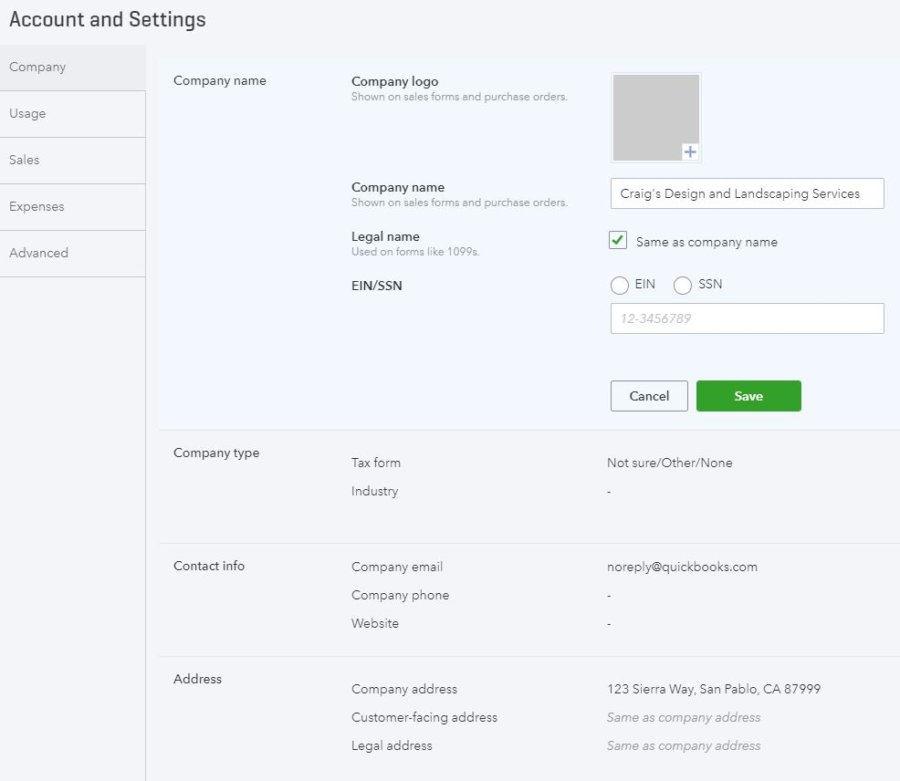
Company settings

These fields are pretty straightforward. They will appear on documents such as invoices, sales receipts, and customer estimates.

All of this is required, so I would suggest filling all applicable fields completely.

Company name – Pretty self-explanatory. You’ll enter your EIN/SSN here too.

Company type – LLC, Sole Proprietor, Corporation, etc… Also, your industry will be entered here.

Contact info – Email, phone, and website.

Address – Includes company, customer-facing, and legal address.

company settings
Credit: qbo-intuit.com

Sales settings

Customize– Choose a template for your invoices. Also, specify payment options and write a subject line for emailed invoices.

Sales form content – Payment terms are entered here. Other information you want to be included on invoices can also be specified. Things like delivery methods, shipping fields, and custom fields.

Products and services – Add columns for SKUs, quantity, and rates to sales forms. If you want, you can also add rules regarding discounts for particular customers here. Don’t forget to turn on inventory while updating this field too!

Progress Invoicing – Set up customer billing for long-term projects – if applicable.

Messages – Customize the text in emailed invoices. This is also where you’d enter email addresses to cc or Bcc invoices to.

Reminders – Similar to Messages. You’ll set up follow-up communication emails here.

Online delivery – Specify if you want your invoices in PDF, HTML, or plain-text format. If you choose to not Attach sales form as pdf, you can take advantage of QuickBooks Online’s tracking functionality for online invoicing.

Statements – These are sent to customers to summarize all outstanding invoice balances. You can decide if you want all of the detail shown for each invoice, or just a single line.

Taking the time to customize the appearance of your invoices will help them stand out. So, consider taking the time to work through these fields.

create new quickbooks online company sales settings
Credit: qbo.intuit.com

Expense settings

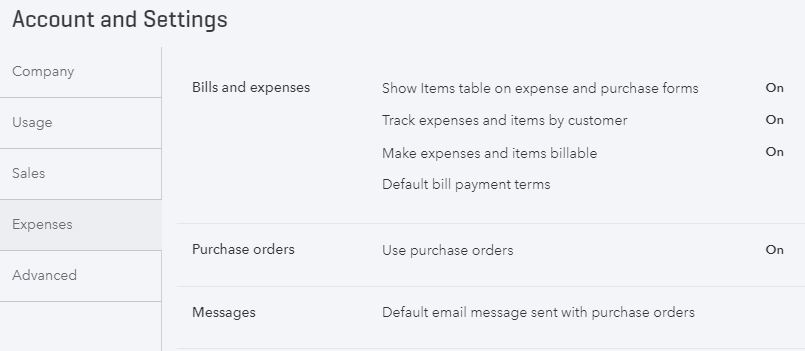
Bills and expenses

Show Items table on expense and purchase forms – Turning this option “On” allows you to see the Items grid when viewing purchase transactions. This is good because it allows you to view reports related to product and service purchases. Note that this option is only available if you have a QuickBooks Online Plus subscription.

Track expenses and items by customer – If you turn this “On,” you’ll be able to select customers when entering expense transactions. This will help you tie costs directly to customers. Also, only available with a QuickBooks Online Plus subscription.

Make expenses and items billable – With this option “On,” you can take expenses and turn right around and bill customers for them. For example, if your customer reimburses for travel expenses, then you would want to utilize this feature. The ability to add a default markup and/or sales tax rate is also available. Again, only available with a QuickBooks Online Plus subscription.

Default bill payment terms – Gives you the option of specifying a default for payment terms. Useful for helping to manage cash flow if your vendor doesn’t set its own terms.

Purchase orders

Use purchase orders – Allows you to add another level of tracking for purchases. Turning this “On” will let you create custom fields in purchase orders. Also, you can automate the creation of serial numbers and transaction numbers. Only available with a QuickBooks Online Plus subscription.

Messages

Default email message sent with purchase orders – If you decide to use the purchase order feature, this is where you can enter a custom message to appear at the bottom of every PO.

expense settings
Credit: qbo.intuit.com

Payment settings

In order to accept payments from an emailed invoice, in person, or over the phone, you will need to create a QuickBooks Payments merchant account.

There are two plans to choose from.

  • The first has no monthly fee, but you’ll pay a higher percentage rate per transaction
  • The other plan has a monthly fee, but a lower percentage rate per transaction

With a merchant account, you can take American Express, Visa, MasterCard, and Discover.

With a merchant account, you can include a “Pay Now” button with your emailed invoices. This will allow customers to make immediate payment. They can do so with a credit card or via ACH. If they choose ACH, there is no fee to you.

If you use the mobile app, you can take payments via a card reader attached to your phone.

Another big advantage of using a QuickBooks Payments merchant account is that every time you get paid, the accounting transactions get made too! Plus, payments are automatically matched with invoices.

Oh, and if you’re using a bookkeeper/accountant, they can possibly get a discounted rate for the merchant account.

If you have an existing merchant account, you can just connect it to your new QuickBooks Online company.

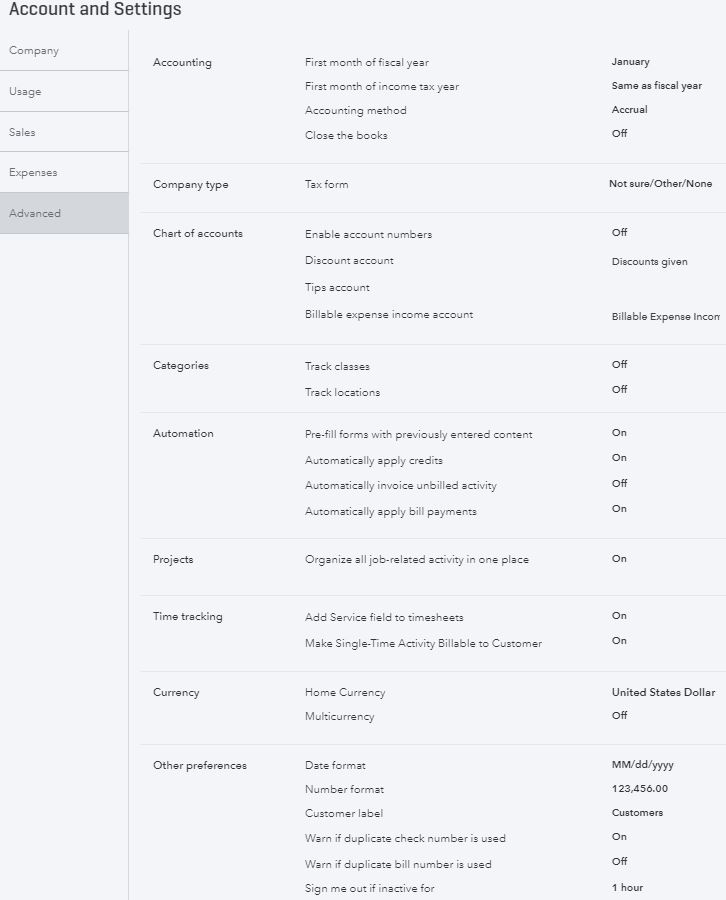
Advanced settings

As the name implies, this is where you can tweak the finer points of your QuickBooks Online account. Unless you have a good grasp of what you’re doing, you might leave these settings to your bookkeeper/accountant. Make sure they know you well if you get third-party help though. The combination of settings you use here is highly dependent on the nature of your business.

These settings can be changed at any time. It’s best to address them when you set up your new QuickBooks Online company.

Accounting

Accounting – Specify the first month of your fiscal year and income-tax year. Plus, if you want to use an accrual or cash-based accounting method. This is also where you will close your books and set your password.

Chart of Accounts – Here, you can opt to use GL account number and set defaults for things like billable expenses, discounts, and shipping.

Other advanced settings

Categories – This setting is where you specify if you want to Track Class or Track Location. Turning this on will include a special field on your forms. Classes can be almost anything you want. For instance salespeople, partners, lines of business, and departments. Location tracking allows you to track inventory by warehouse, area, aisle, bin, etc.

Automation – If you’d like to populate fields on forms based on information entered previously, you can turn this option on. This can save time if you find yourself entering the same information repeatedly.

ProjectsSome businesses are more project-based. Contractors, for instance. If you utilize this feature you can track sales, expenses, and timesheets by project.

Time tracking – This setting allows you to add a Service field to timesheets. Doing so will match employee on-the-clock time with services provided to customers. The billing rate and first day of the workweek are entered here too.

Currency – Conducting business in multi-currency is available in QuickBooks Online. Be careful with this setting, though. Once it’s turned on, it can’t be turned off. Extra fields will be added to your QBO database. If you’re importing data, this must be turned on before the import. Finally, you can’t change your home currency. If you conduct business in other currencies, then this setting will obviously be useful.

Other preferences – These are settings that don’t fit in any other category. Things like date and number formats. You can also dictate how you want to address customers (donors, clients, customers, etc.). Plus, be sure to turn on the option that warns you if duplicate bill or check numbers are used.

create new quickbooks online company advanced settings
Credit: qbo.intuit.com

Create new QuickBooks Online company

That’s a summary of the settings that you should review when you create a new QuickBooks Online company.

Next, read my post on how to navigate QBO.

3 Ways To Navigate QuickBooks Online Including the QBO App

navigating quickbooks online featured

“Where is the navigation bar in QuickBooks Online?” QBO and the QuickBooks app have two primary ways of navigating data:

  1. The left-hand menu
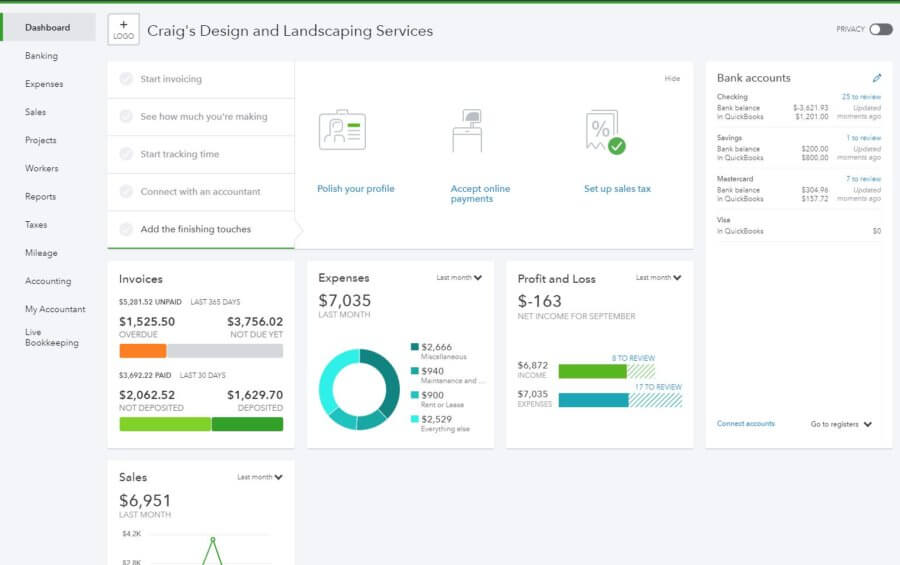
  2. The dashboard “cards.”

Many of the topics in these menus will have sub-topics. Navigating QuickBooks Online (and the app) is fairly simple once you familiarize yourself with the layout. Knowing how to navigate this software will help you do what you need to do and find what you’re looking for.

Accounting is the language of business (Source). So, your books are the story of your small business. This story, like all others, will have twists and turns, peaks, and valleys. Hopefully, when the story is finally finished, the ending will be a happy one.

Check out the Navigating QuickBooks Online Web Story.

Several options for navigating QuickBooks Online

A lot of what you do in QBO can be accessed in several different ways.

There are two primary means of getting where you need to be in QBO – the left-hand navigation bar and the Dashboard.

home screen
Click to enlarge
Credit: qbo.intuit.com

1. Left-hand navigation bar

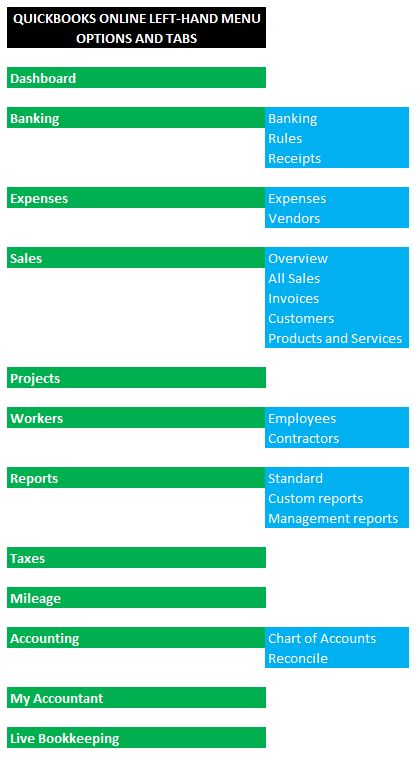
The left-hand navigation bar is organized by business function. The topics are listed below.

Clicking on some of these topics will expand your options into sub-topics.

  • Dashboard
  • Banking
    • Banking
    • Rules
    • Receipts
  • Expenses
    • Expenses
    • Vendors
  • Sales
    • Overview
    • All Sales
    • Invoices
    • Customer
    • Products and Services
  • Projects
  • Workers
    • Employees
    • Contractors
  • Reports
    • Standard
    • Custom reports
    • Management reports
  • Taxes
  • Mileage
  • Accounting
    • Chart of Accounts
    • Reconcile
  • My Accountant
  • Live Bookkeeping.
navigating quickbooks online left hand menu options

2. The Dashboard

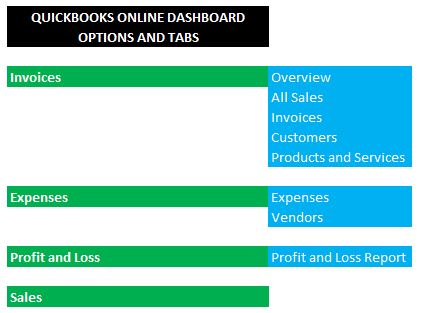
This is the first screen you’ll see when you log in to QuickBooks Online. It is a snapshot of your most critical business information. Click on any of the Dashboard “cards” to open up a tab with further detail.

The cards (and tabs) are:

  • Invoices
    • Overview
    • All Sales
    • Invoices
    • Customers
    • Products and Services
  • Expenses
    • Expenses
    • Vendors
  • Profit and Loss
    • Profit and Loss Report
  • Sales

This information is conveyed as data and graphs. Bank accounts are also shown.

navigating quickbooks online dashboard options

Navigating QuickBooks Online’s mobile app

Owning a small business means that you wear many hats. It also means that you aren’t (probably) spending your entire day in front of your computer.

Maybe you’re too exhausted at the end of the day to sit at that desk and handle your accounting. QuickBooks Online gives you another option to access your books. That’s through their mobile app.

The app is free with a QuickBooks Online subscription. You’ll have access to some of the most critical functions. For example Company, Contacts, Transactions, Reports, plus Help and Settings.

quickbooks app menu
Credit: rodmancpa.com

When you first open the app, you’ll see your Activity screen. This will show your business’s cash flow transactions.

Click on Customers will show you all of the activity for a particular customer. Plus, you can easily call, email, or see a map of the customer’s address.

The Expenses option allows you to take a picture of receipts and you can capture the expense on the spot.

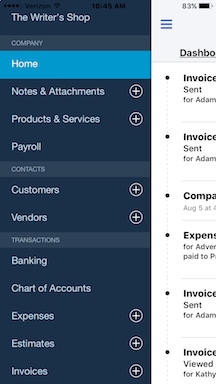
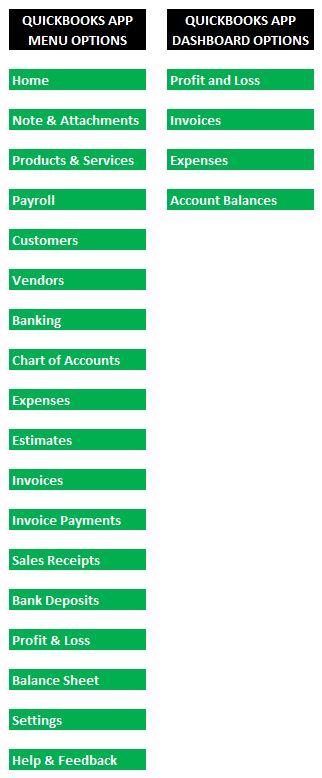
The QuickBooks app menu options are:

  • Home
  • Note & Attachments
  • Products & Services
  • Payroll
  • Customers
  • Vendors
  • Banking
  • Chart of Accounts
  • Expenses
  • Estimates
  • Invoices
  • Invoice Payments
  • Sales Receipts
  • Bank Deposits
  • Profit & Loss
  • Balance Sheet
  • Settings
  • Help & Feedback
navigating quickbooks online app menu dashboard

The QuickBooks app dashboard options are as follows:

  • Profit and Loss
  • Expenses
  • Account Balances

Navigating QuickBooks Online

QBO gives you multiple entry points for finding the information you need. Also, remember that tools and settings can be accessed from the gear icon in the upper right-hand corner.

The Dashboard is the first screen you’ll see when you log in to QBO. This screen is comprised of “cards” that give you a snapshot into relevant aspects of your business. Each card will show data and a graph.

The app allows you to access the primary functions of QBO via your smartphone. One of the main features of the app is the ability to take a picture of receipts in order to create an Expense transaction. The app is free with a QBO subscription.

Do you use the QuickBooks app?

What topics are too hard to find in QBO?

Join the conversation on Twitter!

Business Plan Economic Analysis – Don’t Overlook It!

business plan economic analysis featured

Every small business operates in a number of different economies ranging from their neighborhood to worldwide. The health of these economies has a huge impact on the health of small businesses.

A business plan economic analysis should paint a picture of the economic environment your business will operate in. With many economic indicators, you can delve into further detail. Referencing information specific to small businesses in your state and industry helps to provide an even clearer context.

No, these indicators might not always paint a rosy picture. What they will do, however, is show that you’ve done your homework. That you, as an entrepreneur, understand your environment. You’ll show that you can plan around the threats you face and capitalize on the opportunities.

What to look for in a business plan economic analysis

  1. Small Business Employer Firms
  2. Proprietors’ Income
  3. Small Business Job Creation
  4. Business Births vs. Deaths
  5. Small Business Loan Supply and Demand
  6. Business Lending
  7. Small Business Loan Approval Rate
  8. Loan Charge-Off and Delinquency Rates

If you were so inclined, you could probably draw a correlation between any economic indicator and the health of your small business.

Depending on your industry, the particular economic indicators that affect your small business will vary. Whether you’re retail, manufacturing, goods, or services will make a difference.

Inspiration for these indicators was taken from the Small Business Economic Bulletin. This document is published by the U.S. Small Business Administration. Supposedly on a quarterly basis. Though, the Bulletin linked above is the most recent one I could find. It’s over six months old as of this writing.

Anyhow, I’ll work with what I’ve got. The Bulletin is a jumping-off point for the agencies that compile these statistics. I’ve covered some of these agencies before.

For each indicator addressed in the Bulletin, I’ll discuss what it measures, why (I think) it matters, and how to use the information. In the end, I’ll also touch on what (if anything) each indicator might mean for my startup.

These data are just a jumping-off point. You’ll have to dig into it further to determine what it means for your business.

Small Business Employer Firms

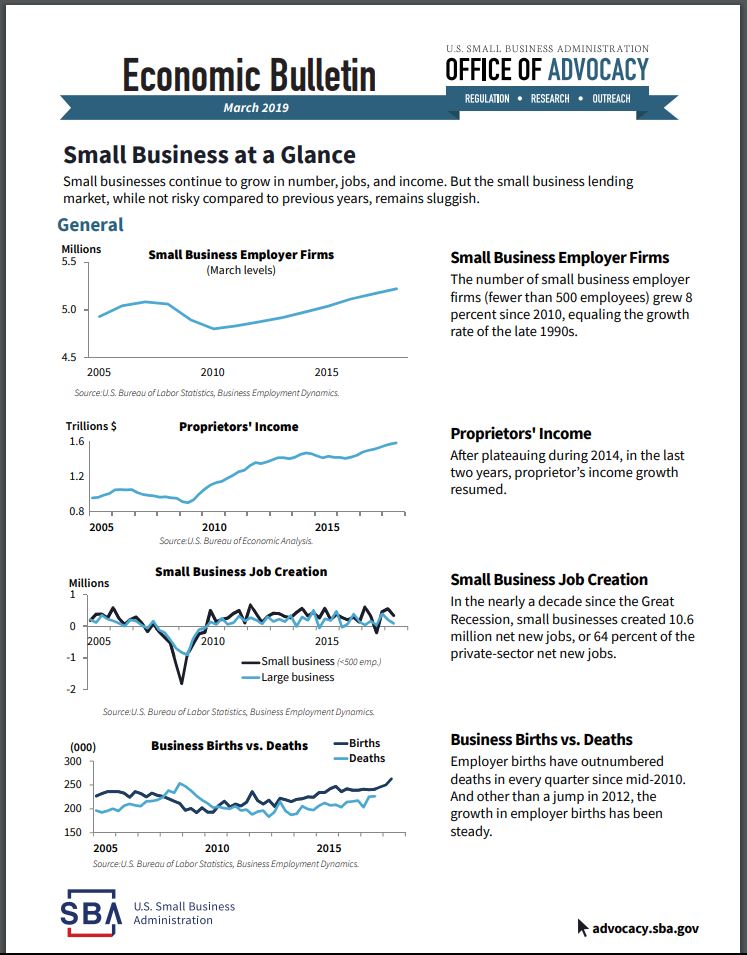
This indicator measures the number of small businesses that employ people.

business plan economic analysis small bulletin pg 1
Credit: advocacy.sba.gov

It is derived from data maintained by the BLS. Specifically, a database named Business Employment Dynamics (BDM).

Small business, for the purpose of this indicator, includes businesses with less than 500 employees. I think that includes a lot of businesses that would qualify as “mid-sized.” But, that’s just me.

An uptrend in the number of Small Business Employer Firms implies that the environment is ripe for small businesses to launch. A decline would imply the opposite.

Where possible, I always recommend digging down into regional or state information. Doing the same thing by industry is smart too. That way you get the most relevant economic statistics for your business.

In the BDM database, the best way I found to do this is by using the Multi-Screen option for data retrieval.

bdm multi screen
Credit: bls.gov/bdm/

You’ll notice two pairs of similar phrases if you browse the BDM. These phrases are Openings/Closings and Births/Deaths. So, what’s the distinction? I sent an email to the SBA and a tweet to the BLS.

The BLS responded quickly with a link to this page. The language is a little hard to understand. However, I think that the main difference is that Openings/Closings can include seasonal businesses. Births/Deaths are considered permanent.

The SBA, predictably, didn’t respond.

It’s my guess that this indicator is a tally of Births/Deaths. Which makes sense. Including seasonal businesses in the tally would increase its volatility. Probably better to count businesses that permanently open and close.

Proprietors’ Income

This is the aggregate amount of income earned by the owners of small businesses.

Specifically, sole proprietorships, partnerships, and tax-exempt co-ops. Dividends aren’t included in this indicator. Neither is rental income (i.e. by a landlord).

Most businesses start off as a sole proprietorship (Source). Businesses that don’t pay the proprietor enough income – die. A healthy small business environment should translate into healthy growth in Proprietors’ Income.

What if Proprietors’ Income is flat (or declining), but Employer Firms are growing? That might imply that more firms (proprietors) are fighting over shrinking pieces of the pie. If this is happening in your industry, beware.

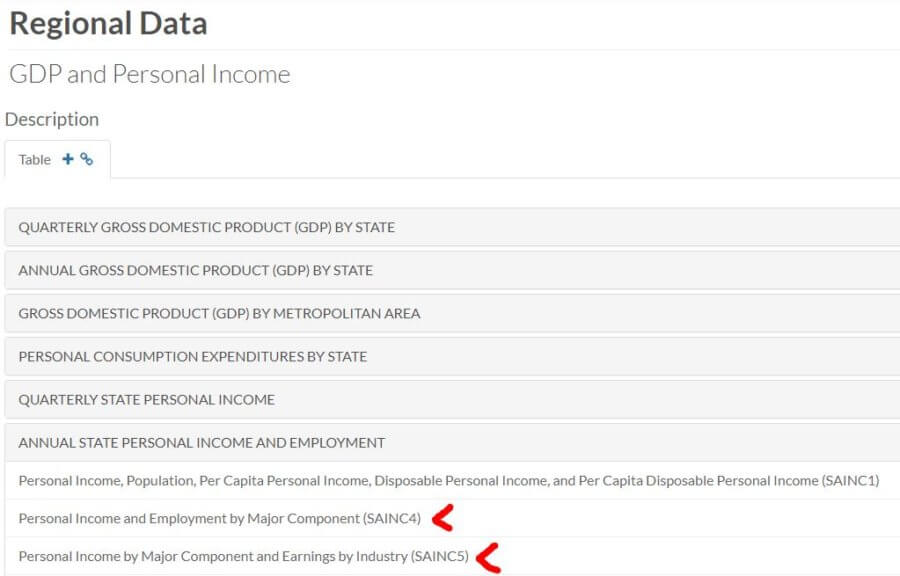
The best way I found to drill down is to look at the most current release of Personal Income by State. From there, you want to go to the Interactive Tables. Specifically, you want tables SQINC4 and SQINC5 for quarterly information. SAINC4 and SAINC5 for annual information.

Clicking on either of those should guide you to what you need. Remember, you can use Ctrl to select multiple options!

proprietors income
Credit: apps.bea.gov

Small Business Job Creation

Job creation is a sign of growth. As customers demand more, help is needed to meet that demand.

It might come in the form of direct labor or administrative help.

Your small business may or may not follow suit. What this indicator tells us, though, is whether there is a net gain in small business jobs or not. If there is, that could be considered a tailwind. Not something that is going to guarantee success. But, not something you’re going to have to fight against either.

Here’s the flip side of that “good news” though. If small businesses (and the big boys) keep adding jobs, quarter after quarter, eventually you could reach a point where demand exceeds supply. The cost of labor goes up and (potentially) the quality goes down. For you, your suppliers, and maybe your customers.

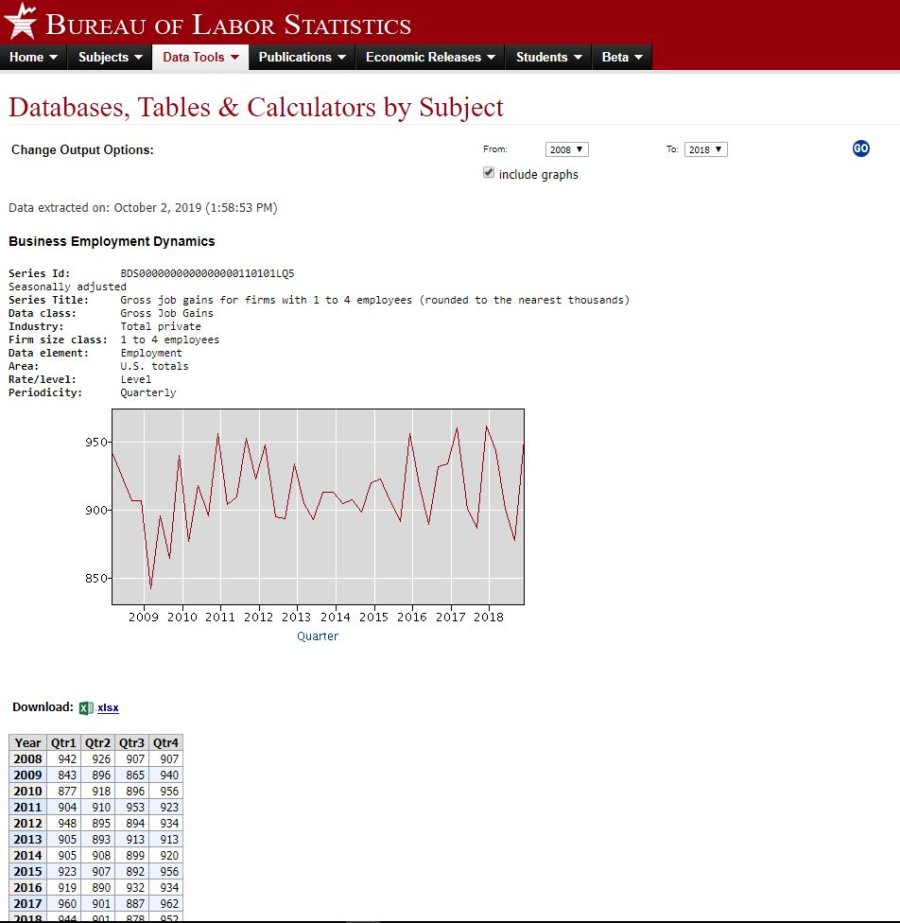
Like Small Business Employment Firms, this indicator refers to the BDM database. Again, I suggest using the Multi-Screen Data Search to navigate it.

You can drill down by state if you choose to look at all industries and all sizes. However, some industry-specific searches can drill down by state too. I imagine it’s the bigger industries that allow for such a drill-down.

business plan economic analysis small job creation
Click to enlarge
Credit: data.bls.gov

Business Births vs. Deaths

This indicator ties in directly with the Small Business Employer Firms. More Births than Deaths mean that the number of Employer Firms goes up. More Deaths than Births – down.

Once again, we refer to the BDM database. Breaking information down this way allows you to see how much of pull Births and/or Deaths are having on the number of Small Business Employer Firms. For example, is the number increasing because of more Births? Or, because of fewer Deaths?

This is just further insight into the small business environment. It might be able to provide some clue as to how ripe it is for success.

When researching Establishment Births & Deaths you can isolate by industry. But, you’ll only get totals for the whole U.S. Conversely, when looking at all industries, you can narrow down by state.

Small Business Loan Supply and Demand

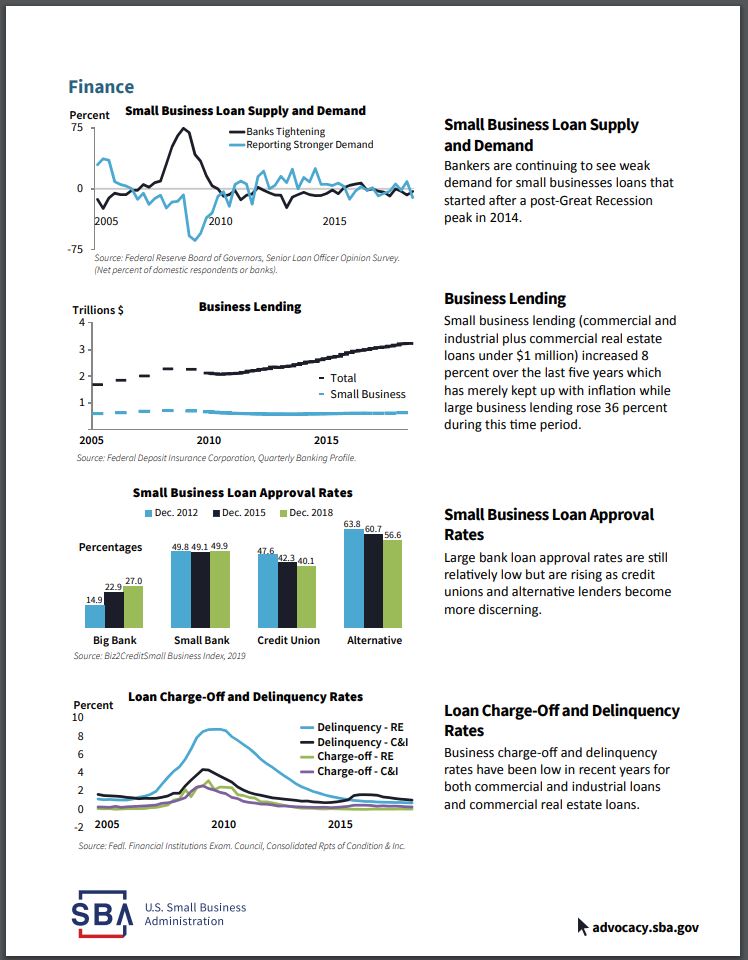
This indicator measures the percentage of bankers that answered two questions in the affirmative or negative. The first question asks if banks have tightened or eased their standards on small business lending. The second question asks if the demand for small business loans has increased.

business plan economic analysis small bulletin pg 2
Credit: advocacy.sba.gov

Now we shift gears a little. Away from small business employment, openings, closings, births, and deaths. The focus of the following four indicators is small business borrowing.

This indicator seems to be rather subjective. It comes from a quarterly publication by the Federal Reserve. This publication is called the Senior Loan Office Opinion Survey (SLOOS) on Bank Lending Practices.

Not a terribly objective measurement. More of “getting a feel for the room” statistic. It is just a survey, after all.

Beyond those two questions, though, there is a lot more in the SLOOS that measures bankers’ attitudes toward small business lending. Questions related to terms, collateral, covenants, and much more.

The lines on the chart seem to oscillate around 0. A negative would mean that the banker felt the opposite of what is being charted, I suppose. For example, a negative Banks Tightening figure means that more bankers answered that they were easing standards. A negative Reporting Stronger Demand line would mean that demand was weaker.

Anyhow, this indicator might provide insight into how many small businesses are seeking to employ financial leverage. Those insights can be compared with the indicators measuring expansion and contraction. If the small business environment seems ripe, but few are willing to leverage in this environment, then maybe the optimism about the future is shaky.

Don’t forget to check out the accompanying tables for a more quantifiable view of the data.

No industry or state-specific information seems to be available for this indicator.

Business Lending

This indicator compares small business loan volume to that of big business.

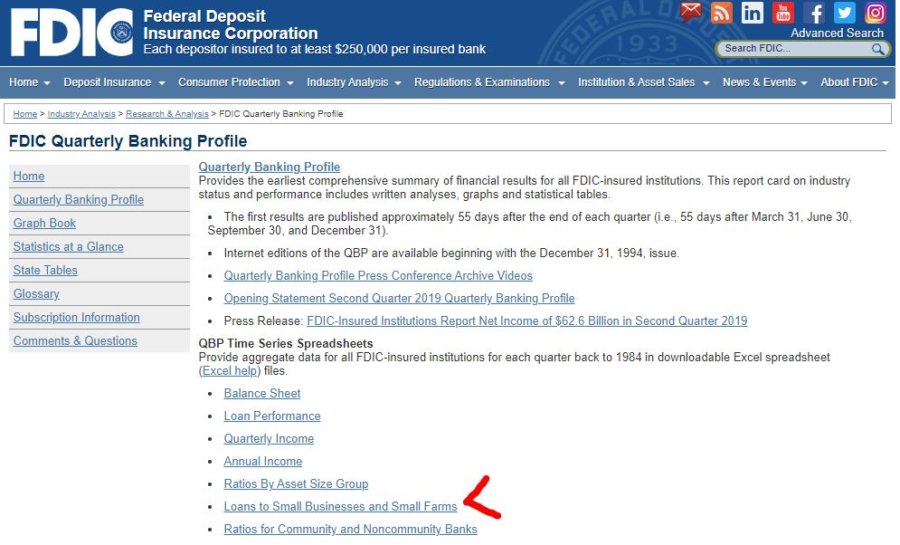
The Federal Deposit Insurance Corporation (FDIC) Quarterly Banking Profile is the source of this information.

Commercial and industrial loans to small businesses are measured. As are real estate loans under $1 million.

Like the Small Business Loan Supply and Demand indicator, I think this is indicative of small business owner optimism. If small business owners feel like the environment is good for investment, they are more likely to borrow. If they don’t feel like they can earn an adequate return for the risk, they will likely limit their exposure.

It’s wise to look at small business lending in several different ways. One indicator might tell you one thing. Another indicator – something else. When you get conflicting (credible) information you should investigate. You’ll hopefully come out the other end a shrewder businessperson.

fdic quarterly banking profile
Credit: fdic.gov
Click to enlarge

Small Business Loan Approval Rates

This indicator provides valuable information two-fold. First, it gives you an idea of what the odds are of getting approved for a small business loan. Second, it breaks the approval rates down by the type of financial institution.

Granted, you don’t know the quality of the applicants measured by this indicator. That is something that would help to put this information into perspective. Are they startups or existing businesses? Maybe they aren’t adapting appropriately to changes in cash flow.

Big banks, small banks, credit unions, and alternative sources are measured. This might provide some insight as to where to go if your small business needs financing.

Unlike the other indicators, this one is more of a snapshot. Historical information is displayed. But only for the same month three and six years ago. It is not presented as a time series.

This gives you an idea of how well to prepare and where to focus your efforts when you need financing. If lenders are becoming more discerning, then you know that you’ll need to create a better business plan.

What you see in the Bulletin is pretty much all there is in the report itself. No state, industry, or size breakdown is provided.

Loan Charge-Off and Delinquency Rates

This indicator gives you an idea of how effectively other businesses are employing their leverage.

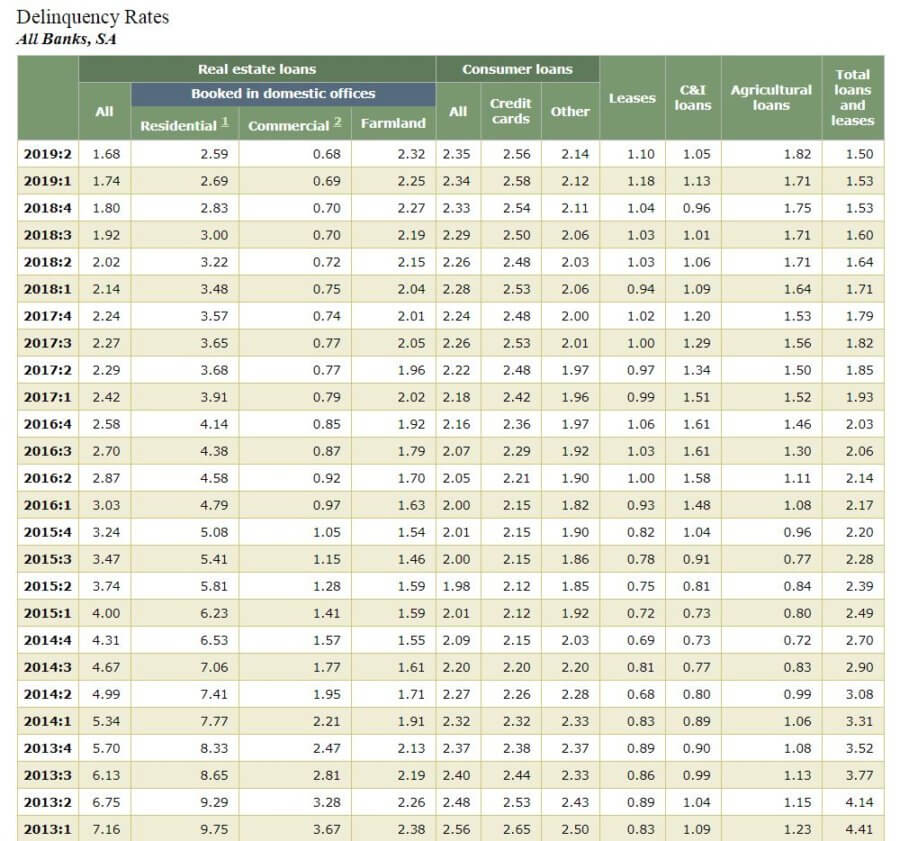
Access the tables behind this indicator here.

Granted, it really only points out what percentage of businesses are doing poorly. It doesn’t say much about the upside. Only the downside.

The description of the report doesn’t outline exactly how the terms are defined.

My interpretation is that Delinquency means that one or more payments are late. Maybe even only by one day.

Charge-Off likely means that the bank has written off the loan against their reserves. They feel that payment for the remaining balance is extremely unlikely.

This serves as a lagging indicator for some of the others. I think the indicator it ties to best is Business Lending. If Business Lending is increasing, but Delinquency is level, we can assume that businesses are finding a good use for the borrowed money.

No state, size, or industry-specific information is available.

delinquency rates
Credit: federalreserve.gov

Business plan economic analysis for my startup

I don’t know if I’ll finance my startup with debt or equity. Therefore, I don’t know if the lending indicators are relevant to my business plan. If I plan on using debt financing, I can circle back and scrutinize the relevant indicators.

Right now, I don’t plan on hiring any employees. So the Small Business Job Creation indicator isn’t currently relevant either.

Of the remaining three indicators, two are somewhat redundant – Small Business Employer Firms and Business Births vs. Deaths.

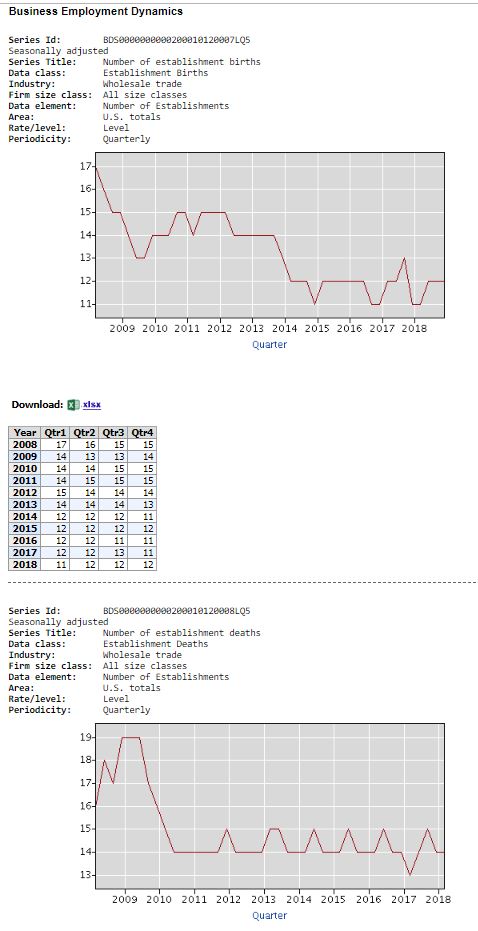
I feel like the Business Births vs. Deaths indicator gives a little more insight. Let’s look at what it shows for my industry – Wholesale trade.

wholesale trade births vs deaths
Credit: data.bls.gov

Not terribly encouraging. In 2014, Births fell below Deaths and seemed to stay there. This suggests, possibly, consolidation in the industry. Big, strong firms forcing out smaller, weaker ones.

What about Proprietors’ Income?

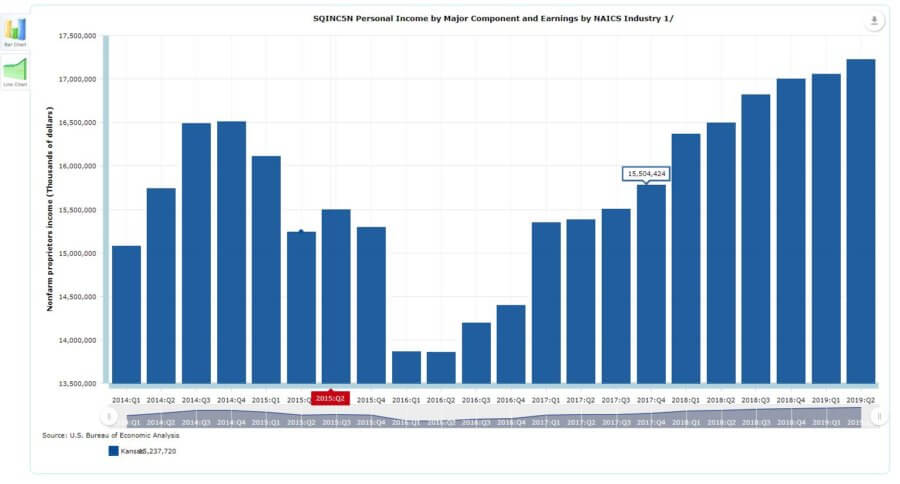
More encouraging. Proprietors’ Income has risen sharply in my state since Q1 of 2016. Despite the title, the table doesn’t have a NAICS breakdown. But it doesn’t.

So, I don’t know the whole story. If this rise took place in my industry, I could assume that there’s plenty of money to be made. It’s just going to fewer hands. This means that I had better have a sound plan for success.

proprietors income kansas
Click to enlarge Credit: apps.bea.gov

What other indicators should I have included in my business plan economic analysis?

Which indicators are important for your business plan economic analysis?

Join the conversation on Twitter!

Market Size for a Business Plan – 2 Methods to Gauge It

market size for a business plan featured

In order to estimate how much in sales your startup can hope for, you’re going to have to estimate the market size for your product/service(s). This is critical for your startup because it will give you an idea of your business’ potential. It will also help you plan for capacity-related issues.

2 approaches to estimating the market size for a business plan

I cover this topic more in-depth in a post on market size and growth rate on my sister site, InvestSomeMoney.com.

The context there is focused on investing your money in a publicly-traded company. Though that’s a little different than what we are doing here, the fundamental principles remain the same.

The goal is to determine how many potential customers there are for a business and how much they are willing to spend. In order to do that, we can employ two general methods. These methods are a top-down analysis and a bottom-up approach to understand market size and growth.

One way to think about this is that a bottom-up approach uses multiplication and a top-down analysis uses division to arrive at an estimated market size.

After writing on this subject several times, I’ve come up with another way to think about these methods. I think a bottom-up approach should look internally, at things like unit size and capacity. A top-down analysis should look externally at things like demographics and market research.

Looking at this from these two different perspectives opens the door for further analysis. When you’re done, you should know whether you can expect to be capacity constrained or demand constrained. You’ll also start to flesh out some ideas that will help you further into your business plan.

If you do an analysis with both approaches, you can compare the results. For instance, if your bottom-up approach is higher, you’ll know that you could have excess capacity issues. You need to consider scaling that back or otherwise expanding your product/service offering to drum up additional demand.

Conversely, if your top-down analysis reveals that demand is in excess of capacity, then you are leaving money on the table. Time to start thinking about what you can do to scale up and capture as much of the market as possible.

Let’s start by taking a look at a bottom-up approach to estimating the market size for a business plan.

Bottom-up approach example

On my sister site, InvestSomeMoney.com, I researched three real-life examples of a bottom up market sizing approach. In those examples, you’ll see that they sometimes mix in a little top-down analysis with their bottom-up approach and vice versa. There’s no rule against doing that, but I would rather look at things from two totally different perspectives.

When using a bottom-up approach, try to start with the most simplistic piece of firm information you can get your hands on. Then, start to build on it with other information, or the best guess you can muster.

You can think of a bottom-up approach as one that focuses on how much and how often customers will buy.

This information might be something you have internally. Or, it might be from the information you found by researching online. Start with a single “serving size” of your product/service. Then, think about how often a customer would buy. Work your way up from there.

A bottom-up approach for my business plan

As mentioned in earlier posts about business plans – I’m building one as I write these. My theoretical product is an all-natural topical hair loss treatment.

In the post linked above, I performed something of a top-down analysis of market size for a business plan. I later discovered that I was operating with incomplete information.

There’s still a lot to consider regarding packaging volume and dosage. That will require more thought. But, for the time being, I’m going to estimate the volume of a one month’s supply and the daily dosage to be the same as Rogaine. If that changes as I progress with my business plan, I can easily circle back to this and plug in different numbers.

With Rogaine as my benchmark, I know that a dosage of my product would be 1 mL. The product would be used twice a day. My product would come in 2 oz (60 ml) bottles. Each bottle would be one month’s supply, as I said.

Thinking about capacity

Okay. Now that I have a grasp on the package size – what about blending and packaging? If this idea were to come to fruition, I don’t picture myself blending batches in my bathtub and filling bottles with a ladle and a funnel. I would need access to some sort of industrial equipment.

Fortunately, a quick internet search shows that there is no shortage of contract blenders and packagers out there. Especially for food and supplements. What it costs, remains to be seen. That’s an issue for another time. For now, I just want to get an idea of how much I could manufacture.

This company claims it can blend 1.25 million pounds per workday. We’ll assume, for now, this represents the average contract blender/packager. What does that translate into in terms of 2 oz bottles?

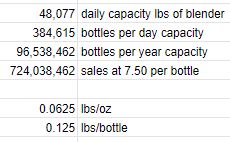
First of all, I wouldn’t need all 26 of their kettles. Only one, tops, especially at startup. So, if we divide the 1.25 million pounds by 26, we get a per kettle capacity of about 48,000 lbs per day.

Pounds are a weight unit of measure (UOM) and ounces are a volume UOM. To make the conversion, we’re going to have to do some more estimating.

Water weighs a little over 8 lbs/gallon. We’ll assume my product has roughly the same density.

8 lbs ÷ 128 oz (per gallon) = .0625 lbs/oz. With each bottle containing 2 oz, we know that it’ll weigh approximately .125 lbs/bottle.

This means that with one of this company’s kettles, I could blend 384,615 bottles worth of product per day. 96.5 million bottles per year. At an approximate sales price of $7.50 per bottle, that translates into nearly $725 million in revenue per year.

Okay, I’ve looked at things from a bottom-up, capacity-focused approach. Let’s now consider a top-down, demographic-focused analysis.

Market Size for a Business Plan capacity

Top-down analysis

Not surprisingly, I also wrote a post on InvestSomeMoney.com with examples of a top-down analysis to determine market size for a business plan. When you read through it, you might notice that some of the examples use Census data (or something similar). They take big chunks of information and start narrowing down their market from there.

Which brings us to three important terms for performing a top-down analysis. These are:

Total addressable market (TAM)
Serviceable available market (SAM)
and
Serviceable obtainable market (SOM)

A SOM is a fraction of the SAM. In turn, a SAM is part of the TAM.

The TAM can be thought of as every potential customer that you can reach geographically. The SAM is what’s left when you niche down a little into the population that is a good fit for your unique selling proposition. Finally, the SOM represents the percentage of the SAM you can realistically expect to take.

It’s unlikely that you will ever capture 100% of the SAM. Even in a specific niche, you can’t be everything to everyone. That’s alright, though. The goal of this exercise is to make realistic estimates so that you have a sound business plan to work from.

When doing a top-down analysis, start with a large population or an overall industry size. From there, narrow down your customer until you arrive at your SOM. It helps to have a “customer avatar” in mind before starting a top-down analysis so you know where to niche down to.

I would suggest you perform a business plan demand analysis first to get a crystal clear picture of what that avatar is. You might think you know it intuitively. But you might be surprised at what you find – like I was!

A top-down analysis for my business plan

I know that not every person in the U.S. (much less the world) is going to want or need an all-natural topical supplement for hair loss. Who might though???

I’ll refer back to my handy-dandy business plan demand analysis (linked above) to see what I can find.

Here, I’m reminded of the ages that men and women first started experiencing hair loss. I’m reminded of the percentage that has sought any sort of treatment. Finally, I’m given an idea of what types of treatment they have tried.

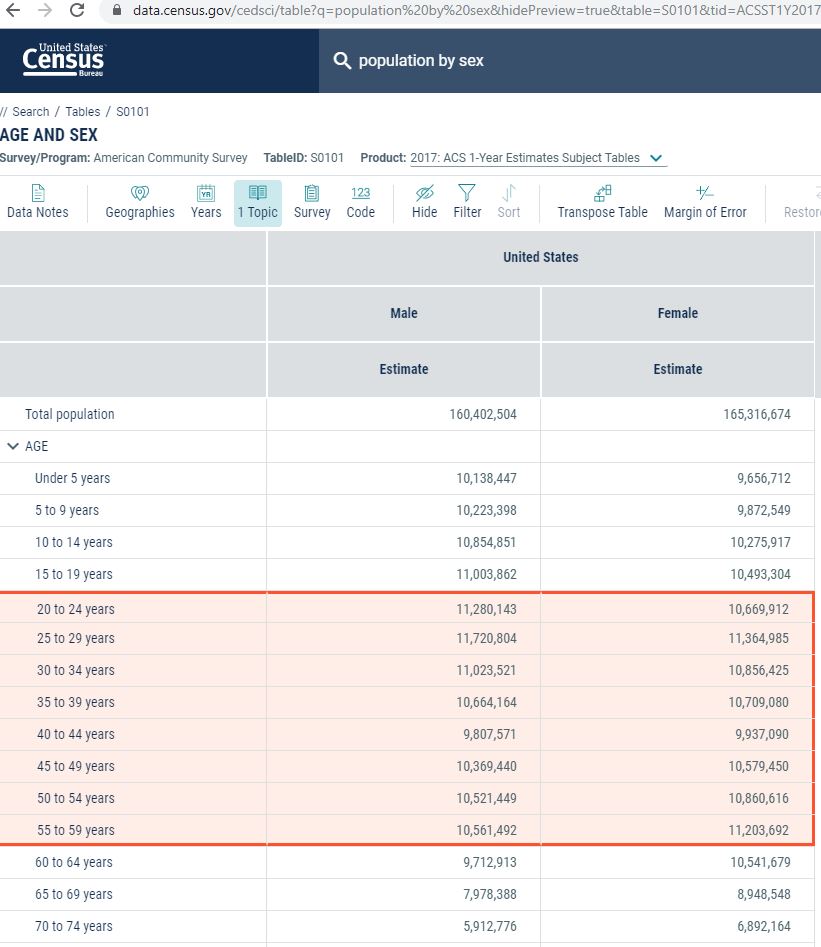
A quick visit to Data.Census.Gov and I find table S0101, which gives me the U.S. population by age and sex. I customize and filter the table real quick. Then, I copy and paste the data I need into my spreadsheet.

Market Size for a Business Plan data census gov

Next step is to narrow these numbers down. I’ll use the “regular” numbers and the pessimistic numbers from sensitivity analysis from my business plan demand workbook.

I want to know the percentage of men who have had hair loss and tried any sort of treatment. Then, I want to go deeper and estimate the number that has found supplements to be effective. I’ll do this for both the most-likely and the worst-case scenarios. On the women’s side, I’ll do, more or less, the same thing.

TAM and SAM

You’ll see that I didn’t use the same age ranges for men and women. I assumed that males would start experiencing hair loss earlier, but would also stop caring about it earlier too.

The age range for males in my TAM was 20 – 54. For females, it was 25 – 59. This translates into a TAM of 151 million people in the U.S.

For the SAM, my worst-case scenario estimated that .9% of the male population in the target age ranges would be part of my market. 1.54% of females in the target age ranges were also assumed to be part of my market. This translated into a worst-case SAM of 1.8 million people.

As for my most-likely SAM, I estimated that 1.41% of males and 2.4% of females in the target age ranges were potential customers. This resulted in a SAM of 2.88 million people. Over a million more potential customers.

SOM

SOM is tricky.

Who’s to say what percentage of the SAM my company could capture? Obviously, it would start at 0% and work its way up from there. Where would it stop though?

It will depend, in part, on the number of companies vying for this niche. As I often do, I will refer to the Pareto principle. The Pareto principle states that 20% of the inputs will be responsible for 80% of the outputs. Put another way, 20% of the companies will have roughly 80% of the market share.

I’ll refer back, again, to my post on business plan demand. In it, I found three direct substitutions for my topical hair loss product. I won’t include Minoxidil (Rogaine) in that group, because of its unnatural chemistry.

Again, without getting too mired in math, I estimate that there are approximately thirty companies in the topical hair loss supplement space. This was a quick and dirty estimate based on the results of an internet search.

Six of those thirty companies probably control 80% of the market. That leaves 4.2% (1 ÷ 24) of the remaining 20% as my short-term SOM. Obviously, if my product were to take off, that amount could grow considerably and could approach the SAM.

What that means as far as the market size is 15K people worst-case and 24K people most-likely. At 12 bottles purchased per year, this translates into 184K and 287.5K bottles per year respectively.

Here’s a look at the spreadsheet breaking that all down:

Market Size for a Business Plan top down
Click to enlarge

Comparing a bottom-up and top-down analysis when determining market size for a business plan

Obviously, a couple hundred thousand bottles (top-down) is a far cry from 96.5 million (bottom-up). So, it would appear I will not be capacity constrained in the near future. In fact, as this startup moves forward, I need to make sure I’m not over-buying capacity. Those huge fixed costs could kill my business before it has a chance to get off the ground.

Speaking of fixed costs, the information from this analysis has given me good data to build my pro forma financials – when that time comes.

Now, at some point in the future, selling my product internationally could be an option. However, in this tiny niche, it is unlikely that I’ll ever need that much capacity for this one product.

Market size for a business plan

What were there factors I didn’t consider (but should have) when estimating my potential market size?

How might you have approached this differently?

Join the conversation on Twitter!

“Where Can I Get Data for Market Research?” 6 Gov’t Sources

market research data sources featured

You know that market research is important. It helps you to better understand your customers and your environment. Are the market research data sources you’re using painting a complete picture?

Do you have unanswered questions? Or, perhaps, you’re missing things that you didn’t even know would affect your small business.

Complete the picture of your market research by checking out the valuable information available for free from these government resources.

1. Statistical Abstract of the United States – A summary of…everything

Link

The Statistical Abstract of the United States was a yearly document published by the Census Bureau. This tool for market research was a summary of the most important statistical information collected by the government. A really great reference that died in 2012.

stat abstract of us
Credit: census.gov

The entire document, itself, is a beast, at over 900 pages. Alternatively, if you want market research piecemeal, you can browse information by topic and download relevant spreadsheets. 2011 is when the spreadsheets were last updated. To get more timely information, you’ll probably have to reference what agency the data was compiled from.

The Statistical Abstract of the United States is a neat concept. But, as of the time of this writing (2019), the information is pretty dated. Like the USA.gov website, it can serve as a starting point to ultimately find the market research data you need. Like an old-fashioned card catalog.

2. American FactFinder – the (former) granddaddy of all demographic information

This tool is part of the Census website. It has an enormous amount of demographic, economic, and geographic statistics. If you could use only one source of information in your market research, this might very well be it.

In July of 2019, the Census Bureau transitioned to Data.Census.Gov as its main portal for public access to information. The American FactFinder (for now) can still be relied upon to provide valuable, timely info for market research.

Because of the breadth of information available, it’s unlikely that there isn’t something here that could help you with your market research project. A better understanding of your customers and your business environment will help you make better decisions. Not to mention, avoid potentially disastrous mistakes.

The American FactFinder tool is basically a guide to the relevant Census tables that have the market research you need. You pick topics that are of interest to you. The American FactFinder will return the tables that contain pertinent information. From there, you can view or download the information.

There are three primary ways to find what you need.

First is the Community Facts. Here, you can find some high-level information along with some links to tables related to various topics

The Guided search walks you through a series of questions and then presents you with tables that match the criteria you set forth.

Finally, my favorite method to use is the Advanced search. Here, you select your Topics individually. The relevant tables are presented as search results.

market research data sources american factfinder table
Click to enlarge Credit: factfinder.census.gov

No matter what method you choose, all paths lead to the Table viewer. It’s here that you can add and remove information and format it as you see fit. It’s also here that you can download into a spreadsheet for further analysis, if you wish.

3. Federal Reserve Consumer Credit Data – American consumer and student debt

Link

For better or worse, Americans like to borrow money to purchase things. Things that don’t (typically) give them much of a return on investment. The Consumer Credit Data (G.19) report has statistics on the amount of credit extended to the public – real estate excluded.

This report is relatively small. Especially when compared to other government market research sources. Yes, I know the Fed isn’t technically part of the government.

market research data sources federal reserve g19
Click to enlarge
Credit: federalreserve.gov

Here is a link that describes how to read this report.

First of all, information is broken up into sections that are Seasonally adjusted and Not seasonally adjusted.

The information about who holds the debt (Depository institutions, Finance companies, etc.) probably won’t interest you much. The levels and flows of revolving (credit card), nonrevolving (student and car loans) might interest you, as a business owner.

It’s a highly technical report. Probably not something you would reference unless you had a business that was sensitive to consumer debt levels.

So, for instance, if you have a business that was very un-recession proof, then this is something you might keep an eye on. Because once debt (fixed costs) start to balloon to unsustainable levels, it could be your businesses such as yours that suffer first.

In cases such as that, you might cross-reference another source of market research. One that would give you corresponding information on disposable income.

4. Consumer Product Safety – Avoid potential liability

Link

The Consumer Product Safety Commission publishes information aimed at decreasing injuries and death from consumer products. They also have the authority to implement standards regarding public safety.

For small business owners, this information is useful because it lets you know potential sources of liability. Whether it be products you sell or equipment you use in the normal course of business.

From a market research standpoint, this information might be useful if you were designing a brand new product. It might help you avoid some of the safety pitfalls of existing products.

market research data sources cpsc
Credit: cpsc.gov

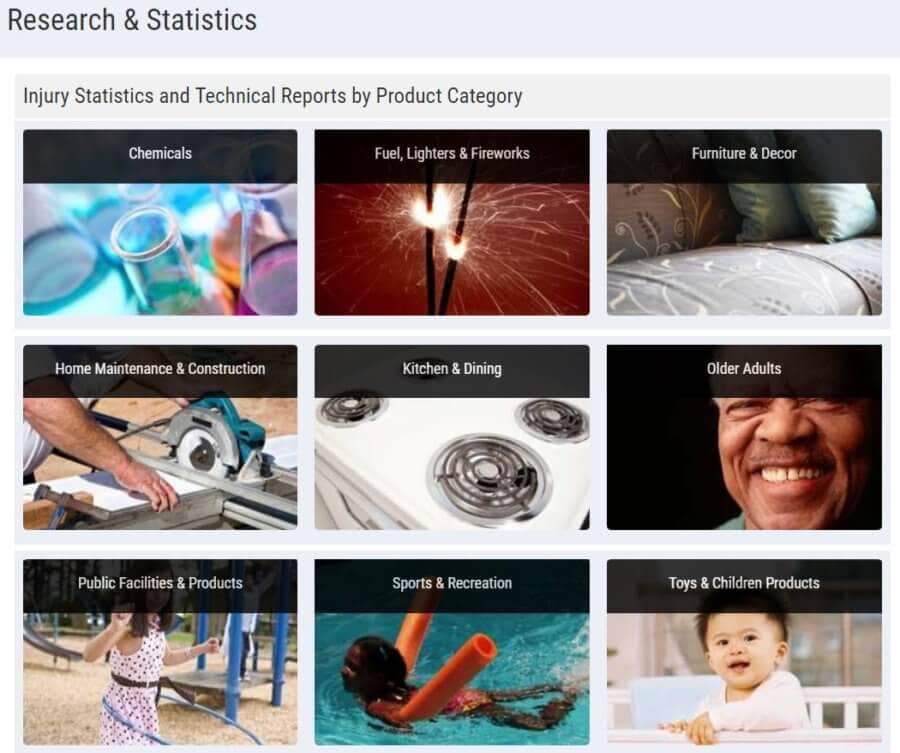
Information is broken into nine categories. Each category has a list of dated reports and injury statistics on related products. It’s also broken out by hazard category. For example – electrocutions, fire, poisonings, etc.

Additionally, the CPSC has a section of their website dedicated issues facing small businesses. Here’s a link to that. I think a quick browse through that page is a good idea for any small business owner.

Of particular interest, for a business designing a brand new product, is the Regulatory Robot. This is a wizard that asks you questions about your new product. It then delivers customized regulatory information that you need to know. A real time-saver for market research and risk management.

5. BLS – market research and help with forecasting/budgeting

Link

As the name implies, the Bureau of Labor Statistics measures labor activity. In addition, it also collects and interprets information on working conditions and price changes.

The Bureau of Labor Statistics prides itself on its objective reporting of the facts. Transparency and accurate data are among its core values.

An entrepreneur could use BLS statistics to forecast revenue. In particular, it would be useful in creating best-case and worst-case scenarios. By knowing how prices changed in different economic conditions – a more informed forecast can be created.

Furthermore, data can be found on wages that would help a startup better estimate labor costs when drafting a business plan.

Beyond that, there is a lot of economic data. Much of this is geographically specific. Which will accentuate information pulled from elsewhere.

market research data sources bureau labor statistics
Credit: bls.gov/data

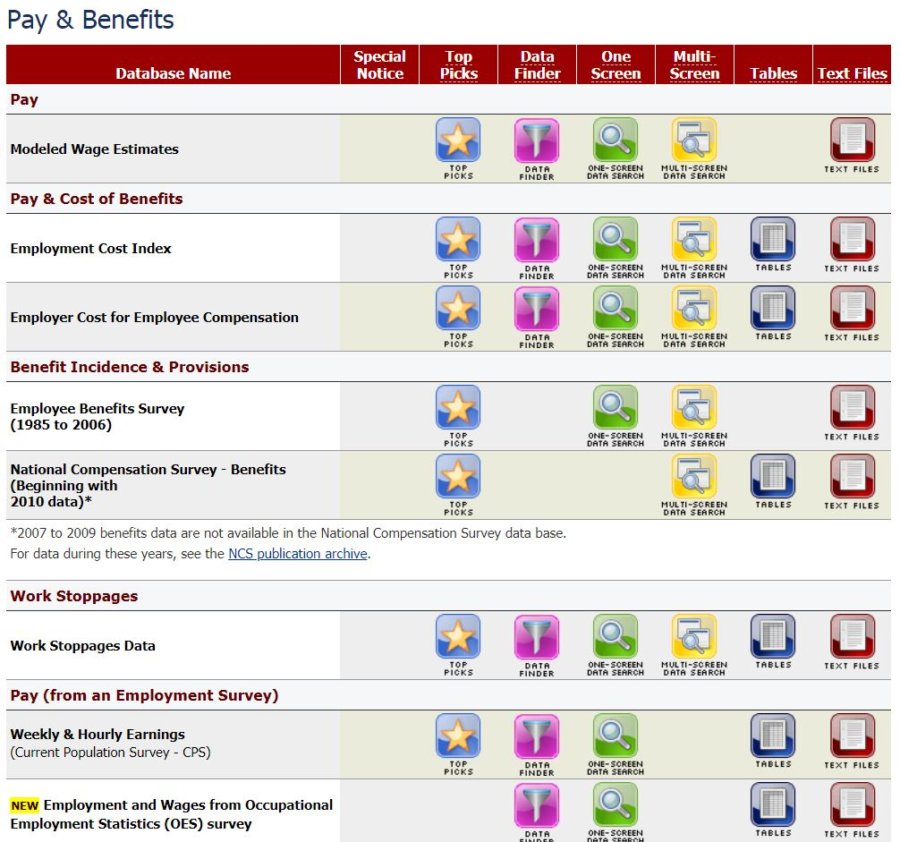
Data from the BLS usually comes in a handy tabular format. Finding what you need isn’t as intuitive as other sites. But, it’s not too complicated. You’ll see that it’s grouped into categories (Inflation & Prices, Employment, Pay & Benefits, etc…) and sub-categories.

For each sub-category, there are several options. These are Top Picks, Data Finder, One Screen, Multi-Screen, Tables, and Text Files. Each is a different means to the same end – the tables that have the statistics you want.

I prefer the Top Picks and One Screen options for finding what I need.

6. Bureau of Economic Analysis – a look at the bigger picture

Link

The Bureau of Economic Analysis focuses on the U.S. economy. This government agency is responsible for calculating the GDP among many other important economic indicators.

As goes the economy so goes business. Some businesses are recession-proof. But, most are not. If you’re a small business planning for the coming year, or an entrepreneur needing market research for a business plan, you’ll want to familiarize yourself with the economic cycle.

You’ll not likely be able to predict when the economy will expand and contract. However, when you compare BEA statistics with those from other sources, you can get an idea of cause and effect. This will give you a better picture of the business environment. In turn, you’ll better understand what it would mean for your small business if ___ happened.

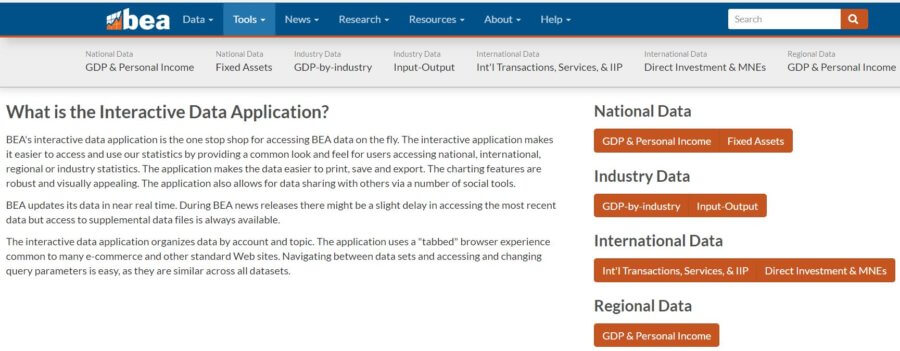
There are three general methods for accessing the Bureau of Economic Analysis’ data. These methods are the Data menu, the Tools menu, and the Interactive Data Application (accessed from the Tools menu).

market research data sources bureau economic analysis
Credit: apps.bea.gov

Of these three methods, I prefer the Interactive Data Application.

From the main menu of the App, you can browse National Data, Industry Data, International Data, or Regional Data. Each choice will lead you to a sub-menu and some will give you the option to map your information.

From the sub-menu, narrow down what you want to see further. Many of the tables will allow you to specify what state/region you want data for and the year of the results.

Market research data sources

Are there any other market research data sources that fly under-the-radar? What are they?

Join the conversation on Twitter!

Census Data Market Research at the New Data.Census.Gov

census data market research featured

In an effort to modernize, the Census Bureau recently launched its new portal for census data market research. It is located at Data.Census.Gov. Here, you can find information on a bevy of subjects including population, economics, education, business, and many other topics.

Market research is important to know who your customers are and where they are at. No other free resource (that I know of) has the breadth of information that the Census does. It is your ticket, as a small business owner, to better understanding your customers and your environment.

What is Data.Census.Gov?

This tool is part of the Census website. It has an enormous amount of demographic, economic, and geographic data. If you could use only one source of information in your market research, this might very well be it.

The main portal for accessing Census data used to be the American FactFinder. In July of 2019, the Census began using Data.Census.Gov as its primary means of providing Census data.

The user experience is much more polished on Data.Census.Gov than it was on the American FactFinder. It seems to have been built with the general public more in mind the data-centric business users.

Why use Data.Census.Gov?

It’s unlikely there isn’t something here that could help you. A better understanding of your environment will help you make better decisions. Also, avoid potentially disastrous mistakes.

Most people think of the Census of only having data on population and demographics. In fact, the Census has a lot more. You can find data on health, housing, business/trade, employment, and more.

So, whether your business is retail, manufacturing, B2C, or B2B, you’re likely to find insights here that you would not have otherwise known.

How to access census data market research?

With the American FactFinder, there were four ways to conduct a search: Community Facts, Guided Search, Advanced Search, and the Download Center.

At Census.Data.Gov you are presented with two options. A search bar at the top, and “canned “searches at the bottom.

Start your search with whatever’s most important to you. If it’s a geographic area, start with that. If it’s related to employment, population, or some other topic, start with that.

At any time, if you want to start over, click on the United States Census Bureau button in the upper left. That will take you back to the home page to start a new search.

A solely geographic search

A geographic search will bring up a screen full of “quick facts” about that area. To access this information you need to select the geographic area you want from the drop-down menu that appears as you enter your query. Don’t just type it and click Enter.

The “quick facts” include things like People and Population, Race and Ethnicity, Families and Living Arrangements, among other topics. Basically, the same topics outlined in the “canned” searches at the bottom of the home page.

A topic-based search

A search that includes a topic such as health insurance or housing will give you a results page that includes TABLES, MAPS, and PAGES related to your query. By clicking on the corresponding result-type along the top of the page, you’ll be taken to results that are exclusively that type.

Tables

census data market research tables
Credit: data.census.gov

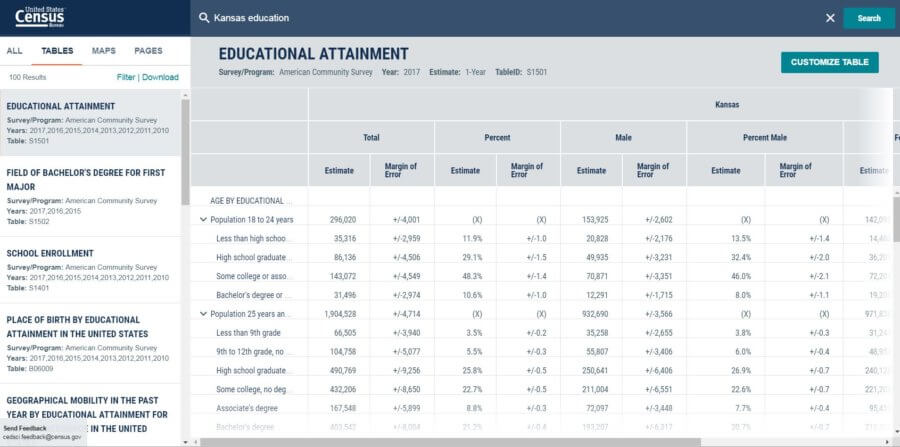
TABLES are the bread and butter of the data-centric user. Upon clicking on the TABLES option, you’ll see a list of tables in the left-hand menu that corresponds with your query.

Once you find the table you’re interested in delving into, click the Customize Table button. It’s in the upper-right.

Now, you can expand and collapse rows so you can only see the data you’re interested in.

When you’re ready to get this information into a spreadsheet, click the chevron (two arrows pointing up) by the title of the table. Select Download/Print/Share. Next, you’ll select the years you want information for and click Download when you’re ready.

Unfortunately, the downloaded data sucks. As I also outlined in the Defining a Target Market… post. It’s difficult to read and can’t easily be put into a format that facilitates understanding. It can’t be copied and pasted into a spreadsheet easily. The American FactFinder site did allow for easy copying and pasting..

Also, if you’d like to add or remove other geographic areas, or the year of the data, click CHANGE GEOGRAPHY or CHANGE YEAR respectively.

Also using the Filter with the tables will allow you to use similar functionality as the Advanced Search option. The Advanced Search will be covered later.

Once you’re satisfied, you can click TABLES in the upper left corner to return to the main tables page.

Maps

census data market research map
Credit: data.census.gov

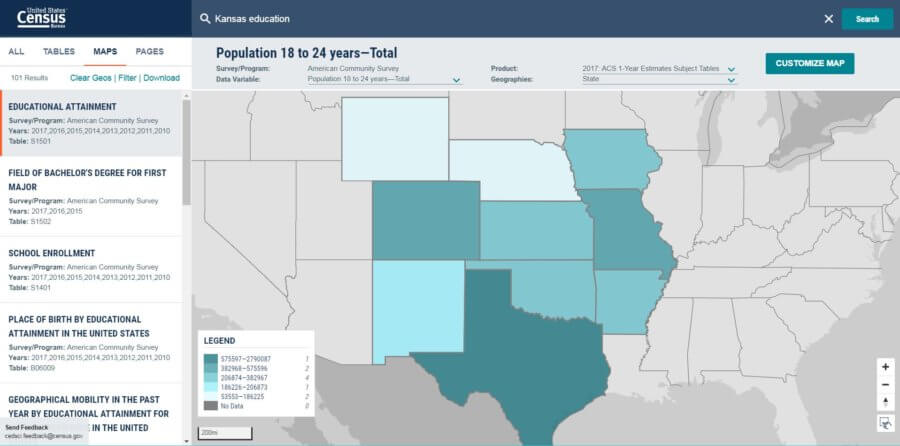
The map and table are tied together. The changes you make in one will bleed over into the other. For instance, if you choose a different Geography in the map, your table will change accordingly.

Along the top, you can also change the Data Variable. These options correspond with the rows in your table.

Geographies will change color according to the data variable. In the lower-left, you’ll see a legend that shows the amounts and quantity of Geographies in each quintile.

You also have the option to click on surrounding Geographies (states, counties, etc.). When you do, they’ll be added to your analysis.

Filters

In the tables, maps, and the Advanced Search, you can narrow down the results by adding Filters. The Filters are pretty intuitive. Select those that you want to use and the data will be updated accordingly. If a Filter isn’t available, it will be greyed out.

Census data market research

What other tips and tricks do you have for finding the data your business needs with Data.Census.Gov?

Do you know of a better way to get information from the tables into spreadsheets?

Join the conversation on Twitter!

Using Census Data for Business – Find the Perfect Location

using census data for business featured

The Census Business Builder is an interactive tool that allows small business owners to make educated decisions about the location of their businesses. Of course, the location of a business can be an enormous factor in determining whether it is successful or a failure.

Click here to try the Census Business Builder for yourself.

What is the Census Business Builder?

This is a “wizard,” of sorts, for small businesses to use to find an ideal location. Information is presented in a map or report format.

Go To Map

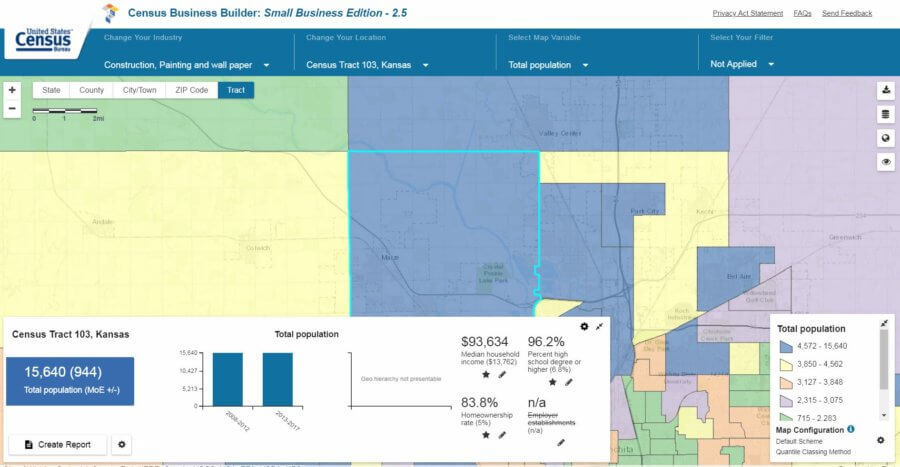
The map is, as you would expect, very visual. It allows you to view the information by state, county, city, and zip code. Different sections of the map are color-coded depending on the variable selected.

using census data for business census map
Credit: census.gov

Variables include, but aren’t limited to the following:

  • Demographic information
    • Age
    • Income
    • Education
  • Business & workforce information
  • Consumer spending

Beyond that, you can filter any of the variables to reduce the “clutter” on your map. Then you can focus on the information you’re really interested in.

Create Report

Whereas the map allows you to customize what you see, the report gives you a rundown of the information it thinks you want.

There are three main sections of the report. They are listed below along with their sub-sections.

  • My potential customers
    • Demographics
    • Socioeconomic characteristics
    • Housing
  • Businesses like mine (based on the NAICS code)
    • Employer businesses
    • Business revenue
    • Nonemployer businesses
    • International trade
    • Workforce
  • Consumer spending

Not all the Businesses like mine information is always going to populate for a given geography. The more pinpoint the geography (Census tract, ZIP code) the more likely that information will be omitted. I assume this is done to protect privacy.

This resource is a tool for finding information about different industries. Information is available from the neighborhood level up to the national level. The information is presented in a more visual format; whereas a lot of other Census data is in tables.

Why should I use the Census Business Builder?

Because it is map-based, the primary purpose of this tool seems to be to find a good location for your business. Thus, it might prove more beneficial for retail or business-to-consumer (B2C) businesses than other types.

That being said, there are business-related variables and filters too. So, you might find information for business-to-business applications too.

If you have a good grasp on your “customer avatar,” and you are looking for the ideal place to locate your business, then the Census Business Builder could help you avoid costly mistakes and give your retail business the best chance at success.

Gathering and acting on market research takes scarce resources like time and money. You want to know that those resources are well spent.

market research data sources census business builder
Credit: census.gov

How to use the Census Business Builder

Using the Census Business Builder is relatively easy and surprisingly intuitive for a government website.

The first step is to select your industry, or manually type it in.

When browsing the map, I couldn’t ascertain what difference it made to select one industry over another. I think this only affects what you will see in the report.

From there you’ll select the location you want to analyze and then Go To Map or Create Report.

Using census data for business – the Census Business Builder map

The map will allow you to move around and see a visual representation of your location, the selected variable, and the selected filters. If you’re viewing data by city, then each city will be color-coded based on which quartile it’s in. If you Change your location to a ZIP code, state, or something else, the map will change accordingly.

Changing the Map Variable is going to affect what you see on represented on the map. Note that you can scroll down on the Map Variables. So, if you don’t see what you want at first glance, there are more options below that.

Your filter options are the same as the Map Variables. By choosing a filter, you’ll be able to exclude geographic areas from your map that don’t meet certain criteria. You’ll set a minimum and maximum for the filter and then select Apply Filter. Your map will update accordingly.

Remember, that like the Map Variables, you can scroll down to find more options for your filter. Apply up to five filters.

At any time, in the map view, you can create a report based on the industry and location selected. Just click Create Report in the lower-left corner.

Using census data for business – the Census Business Builder report

The report will provide a nice summary of the location selected. Included will be every piece of data available in the map, in a presentable format. Ready to be copied and pasted into your business plan, if desired.

using census data for business census report
Click to enlarge
Credit: census.gov

Obviously, the report is less interactive than the map. There are some adjustments that can be made, though. Along the top, you see the option to Display MOEs (margin of errors), Configure Contents, and Download Data.

The MOE information probably won’t mean much to the average small business owner. But, if you’re curious, it simply means that the data isn’t exact and could actually be higher or lower by the MOE amount. For instance, let’s say the Percent high school degree or higher is 90% and the MOE is 1%. Then, the actual Percent high school degree or higher is anywhere from 89% to 91%.

The option to Configure Contents allows you to remove sections of the report that might not be relevant.

Finally, the Download Data option allows you to create a spreadsheet or a PDF with the information in the report. From there you can perform your own analysis, copy to a business plan, or whatever else you wish.

Using Census data for business – a valuable tool

What are some “hidden” treasures in the Census Business Builder map that I missed? Is there a combination of variables and filters that provide especially useful information?

Join the conversation on Twitter!

Government Statistics for Market Research via USA.gov

government statistics for market research featured

Links to valuable government statistics for market research can be found in the Data and Statistics section of the USA.gov website (those links can also be found below!). These resources are valuable whether doing market research or drafting a business plan. You’ll appreciate the value of the information and the time saved.

Here is a link to the government statistics for market research at USA.gov.

What is the Data and Statistics section of the USA.gov website?

The Data and Statistics section of the USA.gov website doesn’t really have any original data. It’s more of a gateway to other government websites that have the information you need.

It’s a good place to start if you are wondering if any data even exists about a specific topic. Some of the topics addressed are:

Economics

Information from the Bureau of Economic Analysis. This includes data on industries, trade, other economic data including the GDP.

The justice system

Provided by the Bureau of Justice Statistics. Data on crime, victims, offenders, and the operation of the justice system at all levels – local through national.

Labor

Labor information comes from the Bureau of Labor Statistics. The BLS prides itself on the objective reporting of data. This data is used to support public and private decision making. Things such as price changes and labor market activity are addressed.

Transportation

The Bureau of Transportation Statistics provides information on airline performance, transportation safety, and much more. As part of the DOT, this site is the preeminent source of data on anything with wheels or wings.

Demographics

The Census Bureau is the granddaddy of all demographic information sources for the U.S. Additionally, you can also find a plethora of business data here too.

Energy

All things involving energy are covered on the Energy Information Administration website. They collect data on all sources of energy. Their goal is to provide impartial information and encourage sound policymaking.

Taxes

The Internal Revenue Service isn’t all that popular with the general public – for good reason. But, maybe you can get a little bit of value for your money by utilizing their statistics information. Included, is data on income, foreign companies controlled by U.S. companies, and exports. Plus, investments in the U.S. by foreign entities, among many other things.

Agriculture

The National Agricultural Statistics Service addresses nearly every aspect of U.S. agriculture. Production, prices, labor & wages, chemicals, and demographics are all part of the data they collect.

Additionally, the Economic Research Service, which is also part of the USDA, addresses agriculture issues too. The ERS’s focus is more on the future (trends and emerging issues) than the past.

Education

The National Center for Education Statistics addresses education. As you might have guessed. As part of the U.S. Department of Education, they are the number one aggregator of data on education in the federal government.

Health

The National Center for Health Statistics is part of the CDC. Their data is, of course, health-related. Information on nutrition, vital statistics, and death is also addressed.

Science & engineering

Here’s a data source that you might not have known about – the National Center for Science and Engineering Statistics. They exist to collect data on research & development activities and the STEM workforce. Also U.S. competitiveness in STEM fields, and STEM education.

Government spending

The authoritative site for U.S. government spending is USAspending.gov. As a taxpayer, you might find this a bit depressing. But, if your business revolves around government spending, you’ll appreciate the transparency.

State & local governments

The federal government isn’t the only public entity that has money burning a hole in its pocket. On the USA.gov website, you can find links to your state and local government websites. No guarantee that they’ll report with the same level of detail as the federal government. But, if you need it, you’ll at least have a starting point for research.

Social security

The Office of Research Evaluation and Statistics is part of the Social Security Administration. Their duties include reporting data related to social security payments, benefits, and more.

Maps

In addition, there is a collection of very cool maps from the Census Bureau, USGS, EPA, and other agencies.

market research data sources usa.gov maps
Click to enlarge
Credit: usa.gov

Why should I use the USA.gov Data and Statistics?

No matter what you’re researching, I would suggest at least glancing at the USA.gov website. It will help you make sure you’ve got a complete picture. Most market research will revolve around information about consumers and businesses. However, information from other sources can help paint a complete picture.

You might even come across a resource that you didn’t know existed. This can ensure that you have rounded out your knowledge of your industry. Which, is particularly important if you are in the startup stage.

How to use these government statistics for market research

Since this website is merely a portal to other government resources, there’s not really any technical know-how needed. Obviously, that might change if you follow a link to another government website/tool.

I would suggest if you have the time, to browse all the federal agencies listed and consider how they might apply to your market research. Again, you might already have a comprehensive picture of your industry/market. But, information presented in a different context might compound your understanding of a particular subject.

Analyzing market research from the U.S. government

In addition to the USA.gov website, the Data.gov website also serves as a valuable resource. Here, you’ll find detailed information about the American public. About their workplaces, purchasing habits, and about any other aspect of life you can think of.

Are there any other resources for this type of information (government or private) that deliver the same value as the sites listed above?

What about overseas? It’s a big world out there and marketing to international customers could be very lucrative. Where can similar information be found for other countries?

Join the conversation on Twitter!