Church Financial Budget – A Guide to Managing Cash Flow

church-cash-flow-featured

  • Download the free template by filling out the form below
  • Estimate the amounts and timing of cash inflows
  • Forecast the amounts and timing of cash outflows for expenses and capital projects
  • Determine a desired ending cash balance for every month in the planning period
  • Factor in the effects of short-term and long-term financing
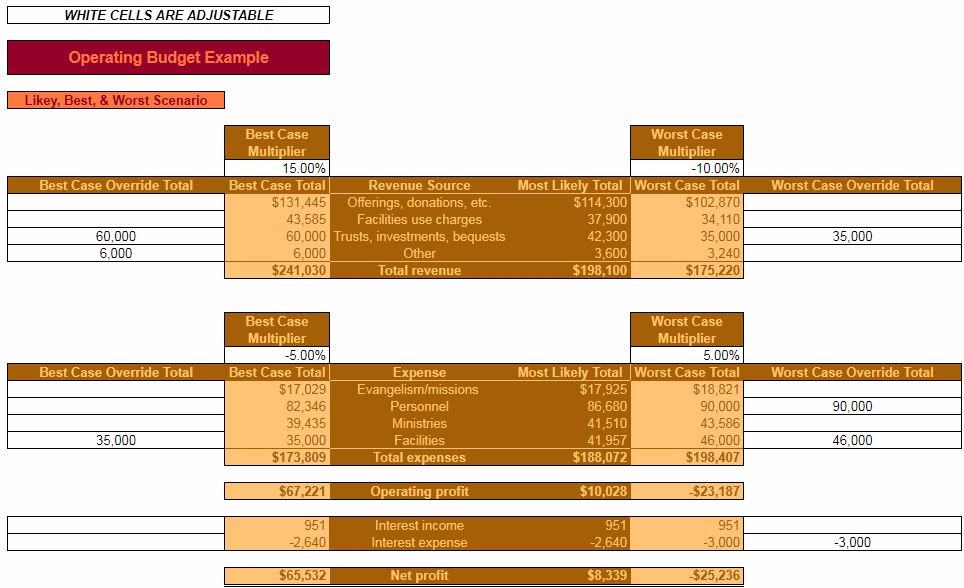
  • Analyze the most likely, best-case, and worst-case scenarios in your financial statements

Get your copy of the church financial budget template

Complete the form below and click Submit.
Upon email confirmation, the workbook will open in a new tab.

Sample church financial budget to help your congregation reach its goals

All right, we finally made it! This is the third post on church budgeting. It’s also the sixth, and final, post on church strategic planning. Yes…this is long overdue.

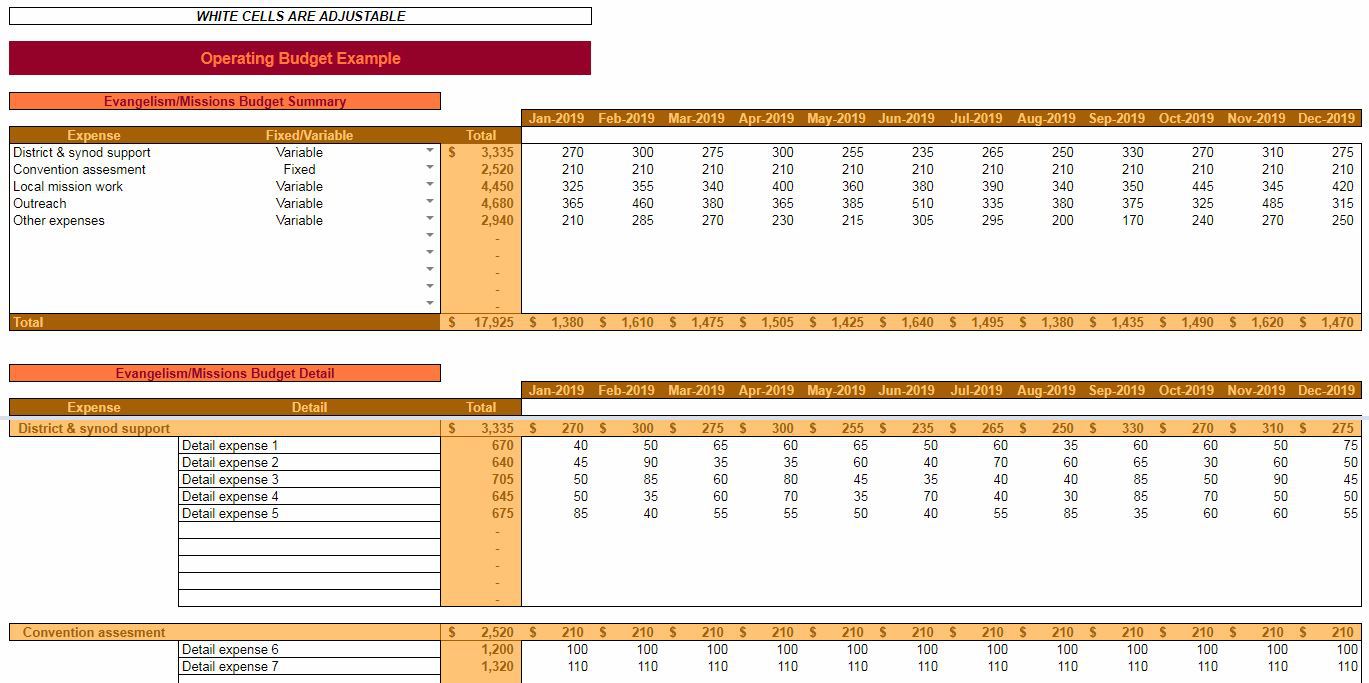
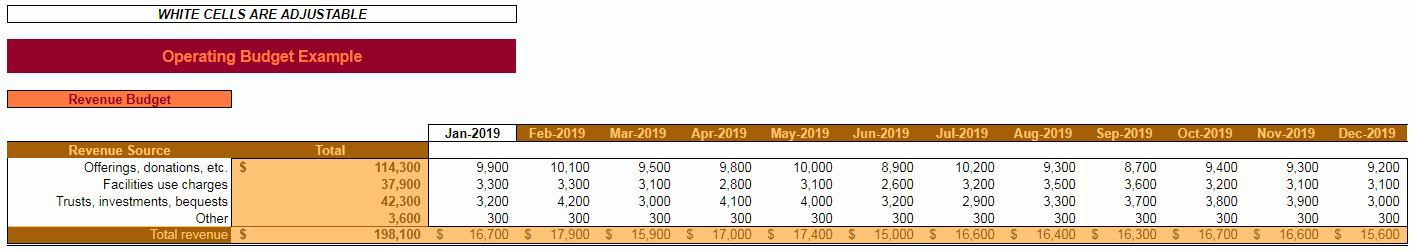
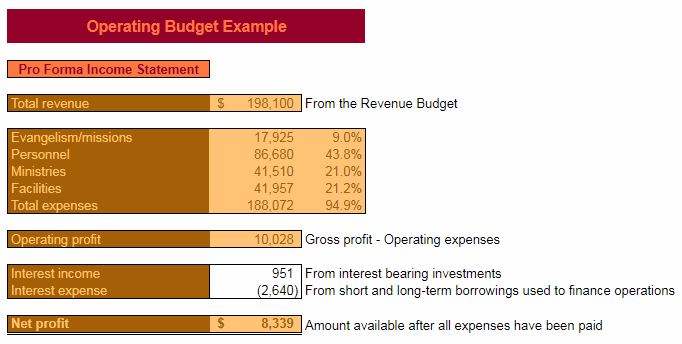
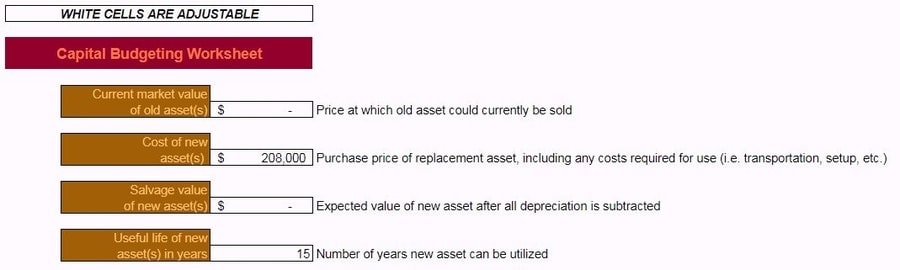
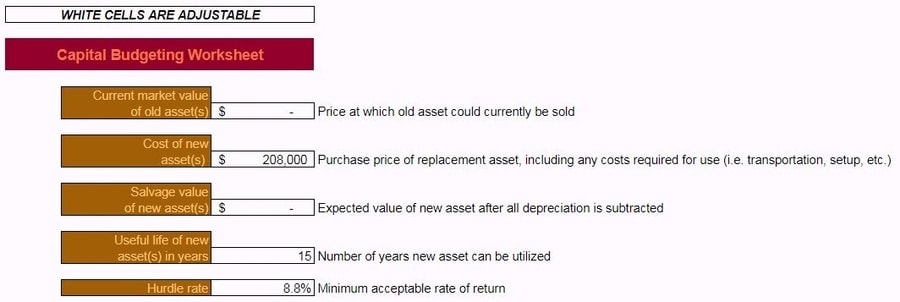
Capital budgeting for churches was addressed previously. As was creating an operating budget. The capital budget involved the forecasting of cash inflows and outflows from the installation of a new parking lot. The operating budget involved estimating revenue and expenses to arrive at a pro forma (estimated) income statement.

Does your church have big capital projects? Read this post:
CHURCH CAPITAL BUDGET – WHY IT MATTERS & HOW TO DO IT RIGHT

The financial budget builds off of the operating budget. It allows your church to estimate the timing of cash inflows and cash outflows. Doing so will help ensure that your church doesn’t run up against a cash flow crunch throughout the coming year.

Yes, strategic planning is time-consuming and labor-intensive. Never more so than the first time you do it. For the church that is serious about ensuring the ongoing fulfillment of its mission, it is time well spent.

What is a church‘s financial budget?

A church financial budget walks through the expected timing and amounts of cash receipts and expenditures over the course of the next year. Churches are in a unique (and somewhat enviable) position since most of their revenue comes from donations. They typically receive cash instantly.

One exception, for the church, might be Facilities use charges, or something similar. Revenue like this is often paid in advance to reserve dates and times. Since the cash comes in earlier (typically) than when the service is delivered, there could be a situation where cash flow and revenue recognition are different.

On the cash disbursement side, a church faces a lot of the same issues as a for-profit business. The recognition of expenses could be different from when the actual cash leaves the church’s checking account.

The church’s Cash Collection Schedule and Cash Disbursement Schedule will come together into a Cash Budget. It is here that the church will have the opportunity to adjust the Desired Ending Balance. And to make any tweaks to Short-term or Long-term Financing arrangements.

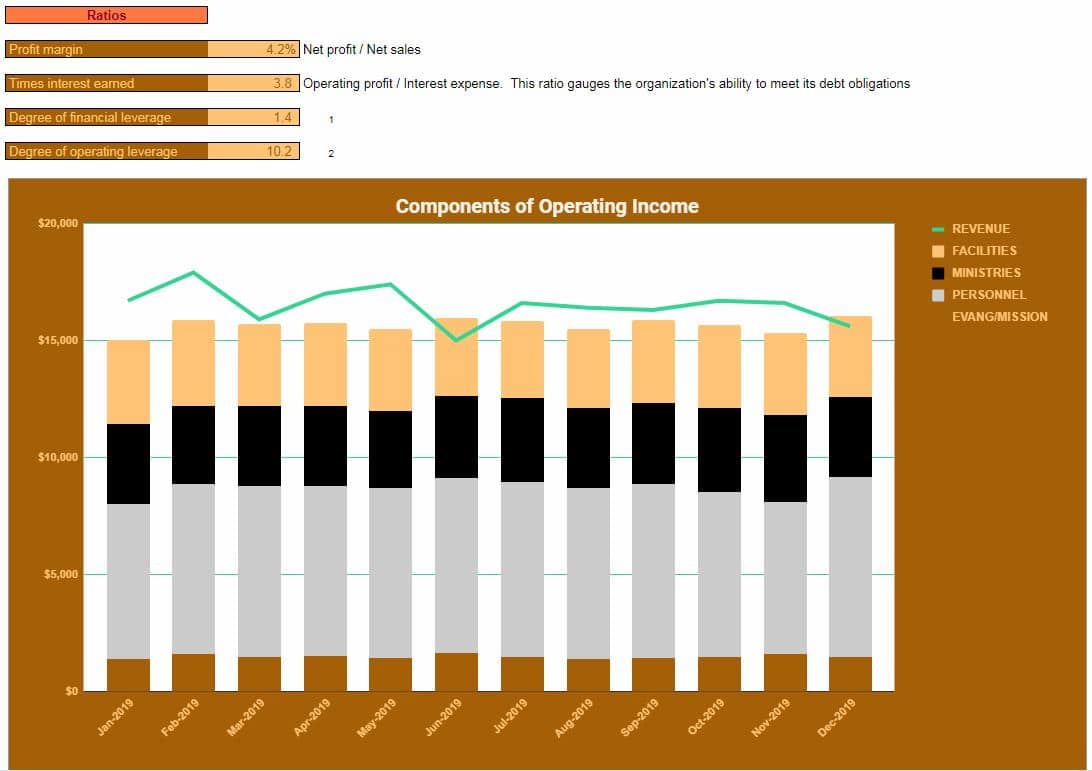
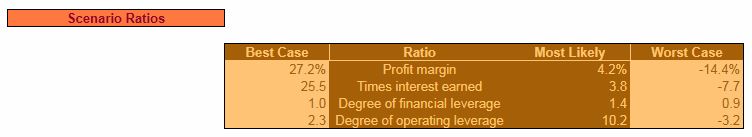
Everything culminates with Pro Forma (expected) financial statements. Just as with the operating budget. This allows the church to compare where they start the year with where they end it. With this information, Ratios can be calculated. More importantly, needed action can be taken to hedge potential problems.

Also, a chart illustrating the month-to-month changes will be available. Also, your church will have the opportunity to play with best-case and worst-case scenarios.

The importance of a church financial budget

Cash is the lifeblood of a business, and a nonprofit organization is no exception. All strategic planning plays an important role in preparing for the future. However, none of the steps may be more important than the financial budget.

Failure to plan for potential shortfalls in cash could mean shuttering the doors. I could mean forever forgoing the opportunity to lead your congregation to the achievement of its mission.

How does a church’s financial budget differ from an operating budget?

A financial budget forecasts cash flow in and cash flow out. An operating budget, if you’ll remember, forecasts revenue and expenses. The difference might seem negligible, but there are some important distinctions.

Want to compare a church financial budget and operating budget? Read this post:
CHURCH OPERATING BUDGET TEMPLATE (FREE) WITH WALKTHROUGH

Operating at a loss in a particular month (e.g. having more expenses than revenue) won’t necessarily constitute a crisis in your church. It can’t go on forever, but if it’s a short-term problem, you should be able to push through it.

But, having more cash go out than comes in during a given month will obviously deplete your cash on hand. Beyond that, if the difference is big enough, and goes on for long enough, your church will be in real trouble.

Cash is king

You don’t pay your bills, or your employees, with numbers on a spreadsheet. As great as spreadsheets are, they can’t do that for you. You pay expenses with cash. So, even if things look good on a spreadsheet or a financial statement, if the cash isn’t there, problems could start compounding.

Over the long-term, the amount of revenue should equal the amount of cash flow in, more or less. Likewise, the amount of expenses should equal the amount of cash flow out. It’s all a question of timing.

An operating budget is important to make sure that your church stays financially healthy for the upcoming year. A financial budget is important to make sure that your church stays solvent from month to month.

One more important distinction is that a financial budget (specifically the cash budget) takes into account things that the operating budget does not. For example, capital projects, financing, and investments. I’ll illustrate the effects of these sorts of things later in the post.

How does a church financial budget differ from that of a for-profit company?

A financial budget for a church versus a financial budget for a for-profit company will differ in a couple of ways.

On the cash collection side, a lot of a church’s revenue is recognized at the same time the cash is collected. The same is not true for your typical for-profit company. The exception, for a church, might be a facilities use charges, or something similar. The timing of cash receipt and revenue recognition being so close together make the cash collection side of a church’s financial budget a little bit simpler.

The cash disbursement side of things will be similar to a for-profit company. Bills are bills after all. When expenses hit versus when they’re paid could be very different. Additionally, capital expenses, if applicable, will require big chunks of cash to be spent at one time. Just as is the case with for-profit companies. Conversely, though, income taxes are a non-factor for churches.

Other factors will be similar between a for-profit company and a church when it comes to financial budgeting. The church may still require short-term and long-term financing. Also, it may put its money into separate savings or investment account, just as a for-profit company would.

So, it stands to reason, that there are a couple of minor differences between the two. But, all in all, financial budgeting is just as important for churches, and other nonprofit organizations, as it is for their for-profit counterparts.

Why should you have a church financial budget?

The reasons for your church to have a financial budget for the coming year are the same as the reasons for doing any other step in the strategic planning process. These sorts of things are done to force you to think about what the future might hold. That way you can best position your church for success.

If your church runs out of cash midway through the year then its very existence might be at stake. Even if your church just gets into a cash flow crunch, that could start a chain of events that might keep it from realizing its full potential.

Certainly, drafting a financial budget and going through all of the steps of the strategic planning process isn’t going to guarantee that your church won’t fall upon hard times. However, it will probably lessen the length and severity of the hard times. Plus, when the hard times do come, then you’ll at least know you’ve done everything in your power to protect your church and to ensure its ongoing success.

One more benefit is the ability to plan long-term and short-term financing. Since these two factors play a large part in the amount of cash flowing in and out of your church, they should be scrutinized. The financial budget allows you to prepare and make arrangements for financing needs well in advance of the time that they become critical.

How to create a church financial budget

Creating a financial budget starts with a forecast of the timing and amounts of cash inflows from revenue sources. As mentioned earlier, since many of a church’s typical revenue sources are of the sort that collects cash immediately – this could be a pretty easy step in the process.

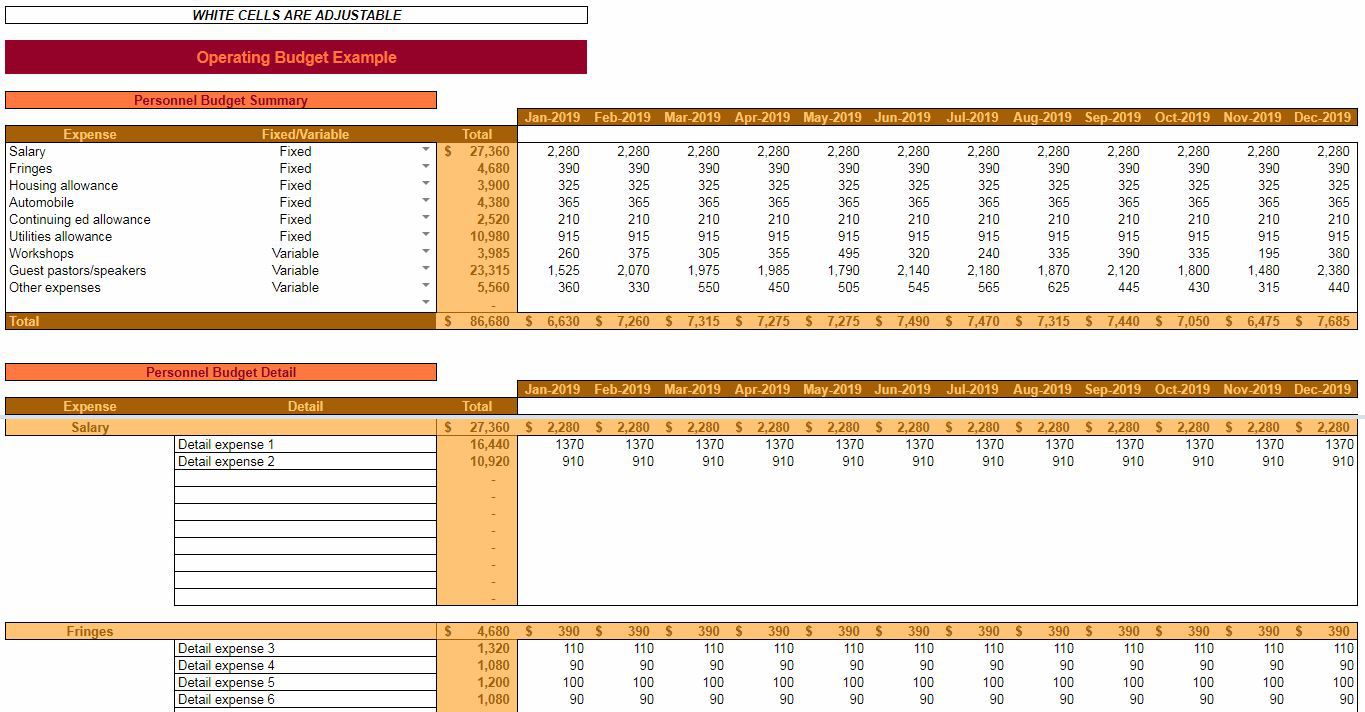
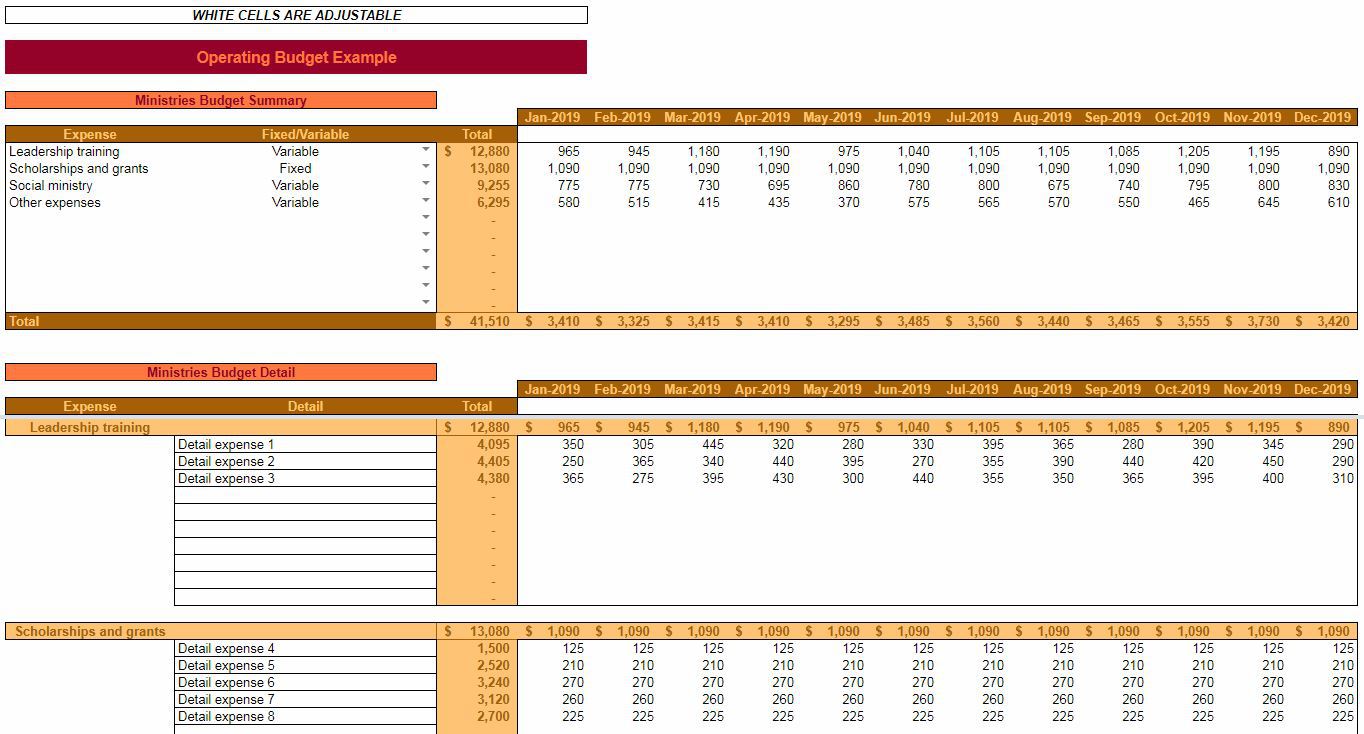
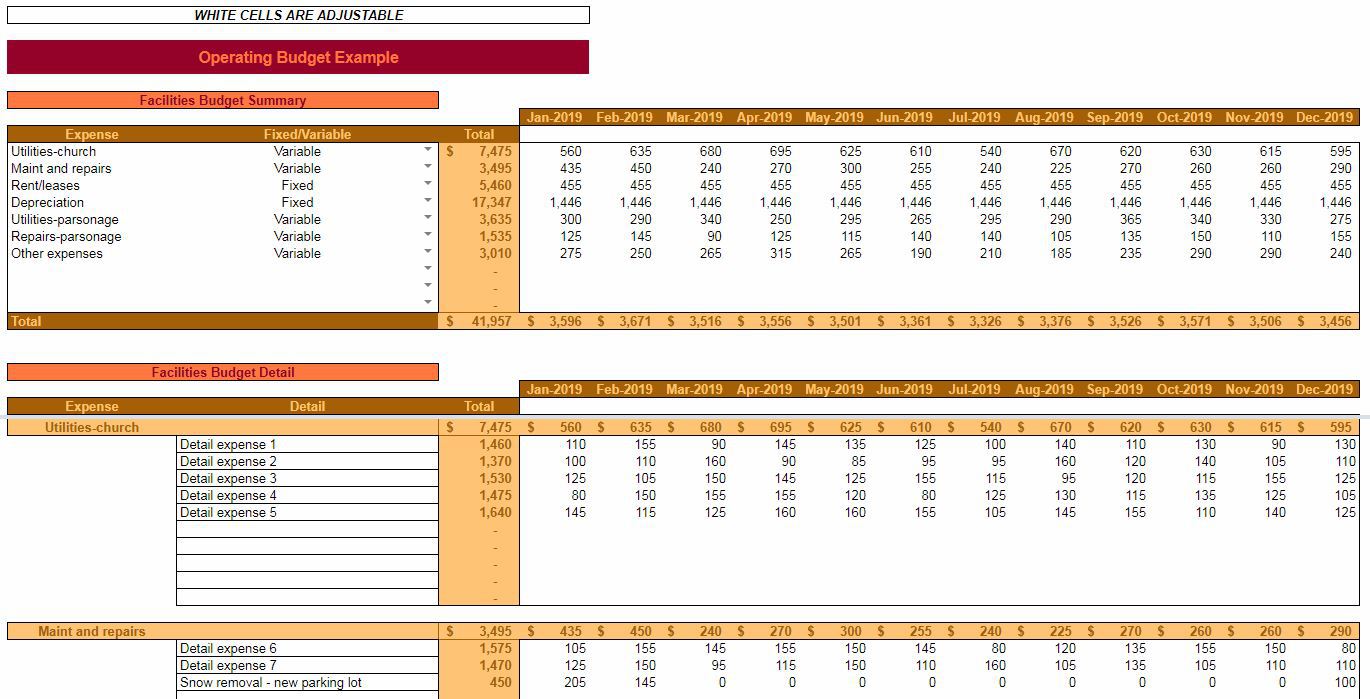
On the cash outflow side, each expense category from the church operating budget will be looked at separately. Each will be unique in terms of when the cash is expected to leave the church. Additionally, this is where capital expenditures will be entered. If you’ve done a capital budget for your church, then you should know the total amount expected to be spent. It’s just a matter of entering the timing.

The cash budget will bring together the Cash Collections Schedule and the Cash Disbursements Schedule. Also, here, you’ll be able to determine a Desired ending cash balance for every month. Beyond that, information about long and, short-term financing will need to be entered.

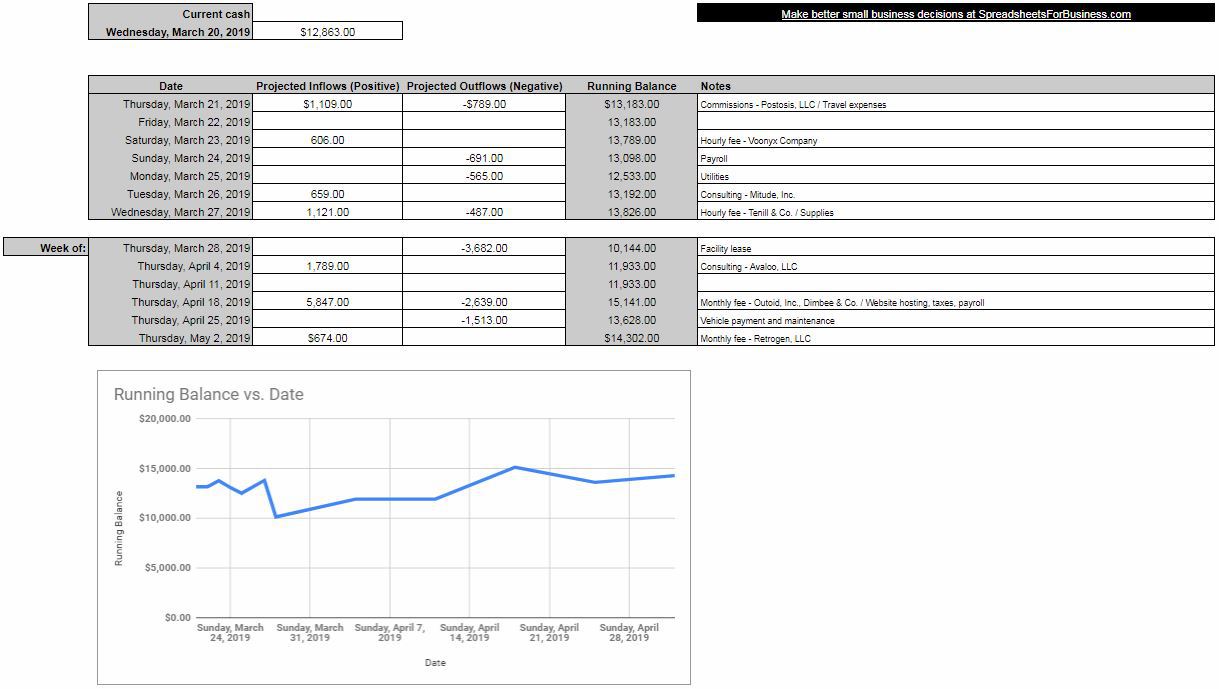
Everything entered previously culminates in a Pro Forma Balance Sheet and Cash Flow Statement. Along with the Pro Forma Income Statement from the operating budget, you’ll have a complete set of forecasted financial statements for the coming year. Anytime there are financial statements, you can expect there will be Ratios. The Executive Summary ends, as usual, with a chart illustrating the most relevant information from the workbook.

An opportunity is given to play with the best and worst-case scenarios. Just as was done with the operating budget. Here, you’ll have the opportunity to tweak the amounts on your Pro Forma Balance Sheet, Cash Flow Statement, and Income Statement to the positive and negative side. Accordingly, best case and worst case Ratios will also be calculated.

Timing of cash inflows

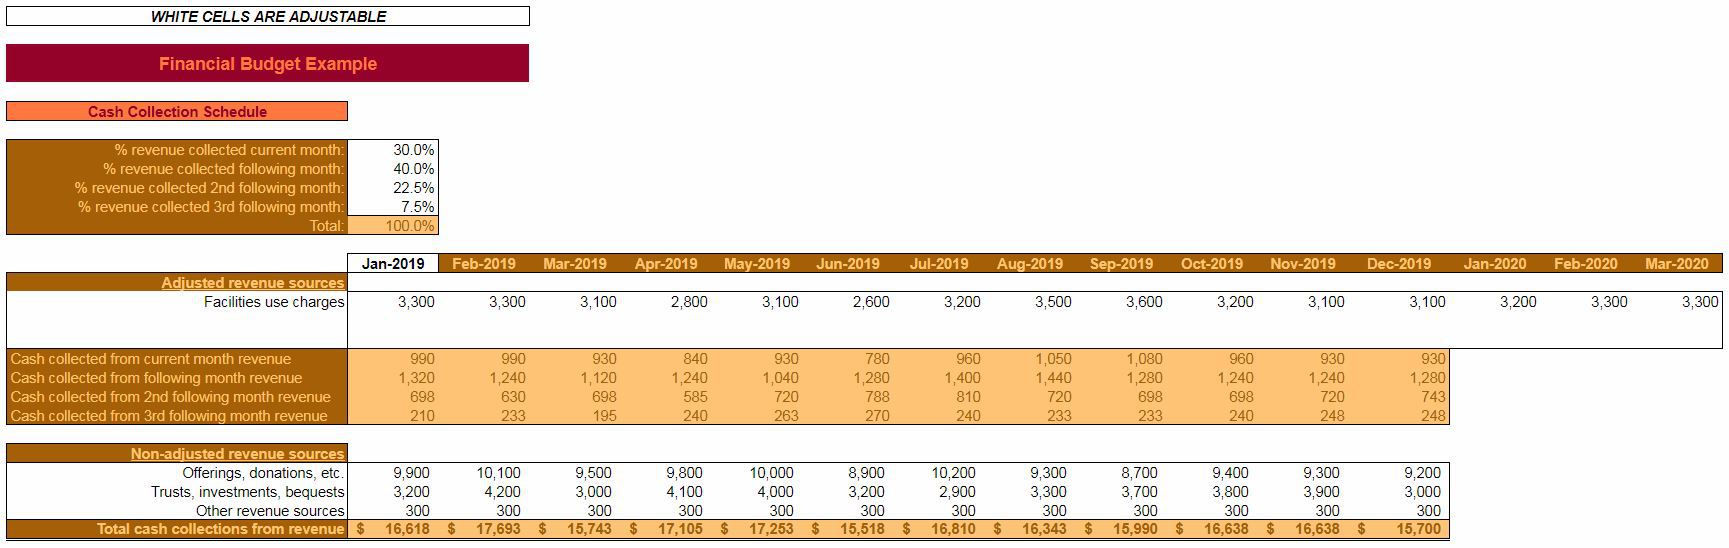
The Cash Collections Schedule is where you’ll enter the pertinent information regarding timing and amounts of cash inflows.

There are three general sections of information to be entered. The first is related to the timing of the receipt of Adjusted revenue sources. Here, you’ll dictate how much, percentage-wise, you expect to receive in the current month, following month, 2nd following month, and 3rd following month from your Adjusted revenue sources.

church-cash-flow-collections-schedule
Click to enlarge

Cash collections examples

If you expect, on average, to receive half of your revenue in cash, from your Adjusted revenue sources during the same month as the “sale,” then you would enter 50% in the % revenue collected current month field. If you expect, on average to receive the other half in the next month after the “sale” then you would enter 50% in the % revenue collected following month field. The other two (2nd following month and 3rd following month) would be 0%. What matters is the Total equals 100%.

Another example – let’s say you only took a 10% deposit for Facility use charges and collected the remainder of the balance three months later. Then, you would enter 10% in the % revenue collected current month field and 90% in the % revenue collected 3rd following month.

Hopefully, this clarifies the purpose of these variables a little bit.

The remainder of the Cash Collections Schedule is where you’ll enter your Adjusted and Non-adjusted revenue sources. Enter each separately along with the amounts corresponding to the month that the revenue is earned.

Adjusted revenue sources

Adjusted Revenue Sources are those where the cash is collected at a different time than when the revenue is recognized.

For churches, the most practical example I could think of was Facilities Use Charges. Where the church collects cash in advance for rental of its facilities.

Revenue sources such as these, are unique, however. Most organizations recognize revenue first and then the cash is collected afterward. Facilities Use Charges are unique though. The revenue isn’t technically earned until the event for which the facilities were rented takes place. But, cash is collected in advance via deposits or payment plans.

So, the revenue for Facilities Use Charges are forecasted out three months into the following year (2020). This is done because some cash might be collected in Dec-2019 for revenue that will be recognized in Mar-2020.

Below the white cells where you’ll enter the revenue sources and forecasted amounts, you’ll see that the calculations are made based on the % revenue collected from above. The percentages entered there specify how much cash will be collected in a given month from current month revenue, following month revenue, 2nd following month revenue, and 3rd following month revenue. These amounts will change depending on what’s entered in the forecasted fields for Adjusted Revenue Sources.

Non-adjusted revenue sources

Non-adjusted revenue sources are much simpler. All you do is enter your different sources on the left and the forecasted amount for each month in the coming year. Cash is collected at the time of revenue recognition. So, there’s no need to forecast out any further.

At the bottom, the Total cash collections from revenue equal cash collection from Adjusted revenue sources plus the Non-adjusted revenue sources for a given month.

Timing of cash outflow

The Cash Disbursements Schedule is where you’ll enter information about the timing and amounts of cash outflows.

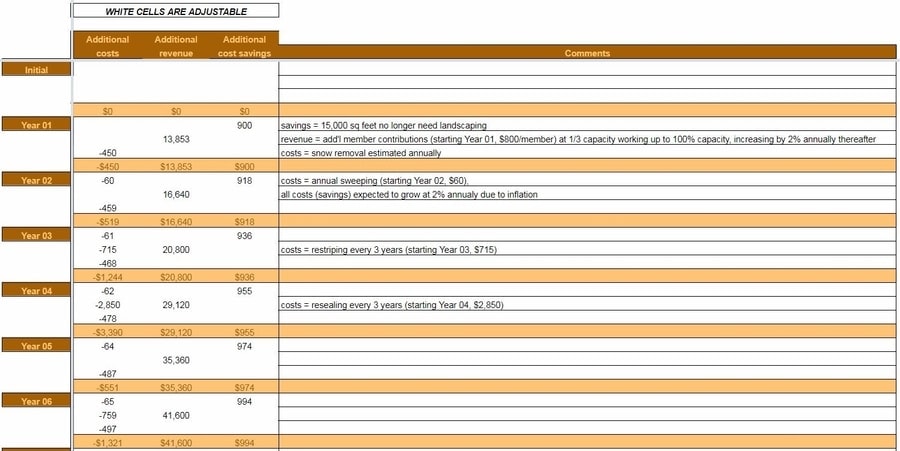
As with any organization, cash tends to leave through more avenues than it arrives. Each category of expenses (from the operating budget) is examined individually. Information from the capital budget will also be entered as it pertains to cash leaving the church.

church-cash-flow-disbursements-schedule-expense-categories
Click to enlarge

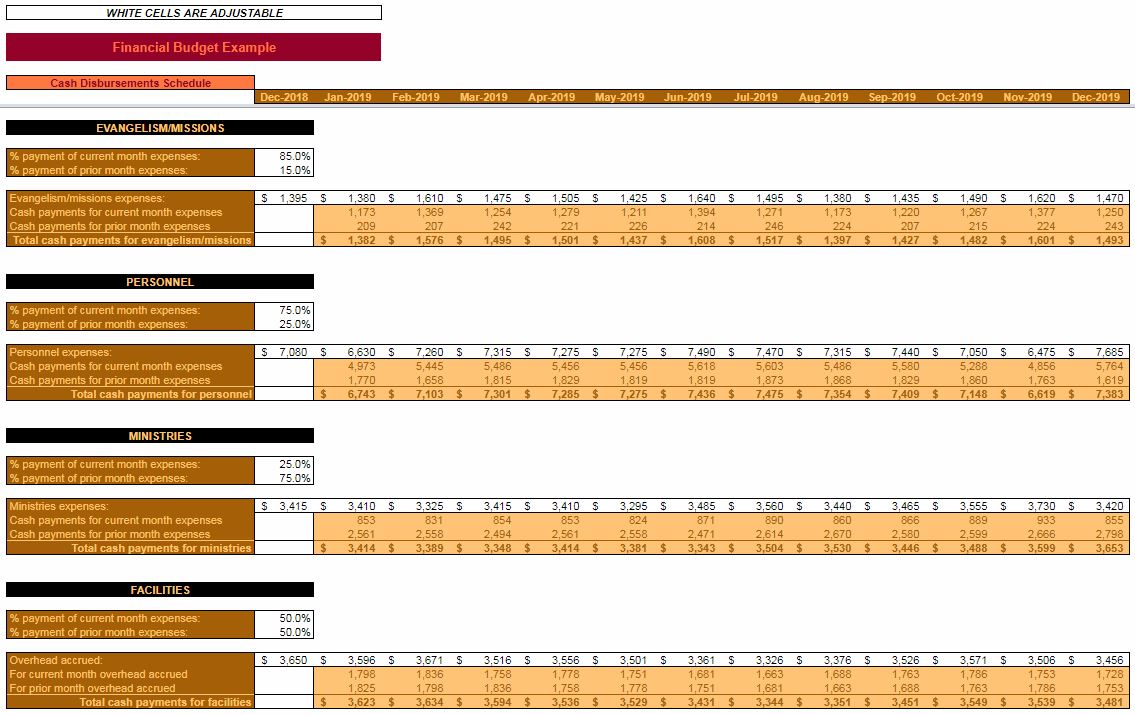
The four categories of expenses from the operating budget are looked at independently. Granted, individual expenses within a particular category probably have different timings in terms of cash flow. But, entering each expense separately would needlessly complicate an already intensive endeavor. So, percentages are entered for each category for the % payment of current month expenses and % payment of prior month expenses.

The % payment of current month expenses refers to the percentage of that month’s forecasted expenses which will be paid with cash, in the same month. The % payment of prior month expenses refers to the percentage of the previous month’s forecasted expenses which will be paid with cash this month.

As you might expect, those percentages must add up to 100%. There’s no allocation made for expenses that will be unpaid. Since your church is reputable, and you’ve committed yourself to strategic planning (including all forms of budgeting), you’ll be well prepared for the coming year. Therefore, your church shouldn’t find itself in a situation where it can’t pay its bills.

Each category of expenses is different

The categories are pretty general. Hopefully, they are indicative of the types of expenses that your church faces. Of course, if you were making a financial budget from scratch, you might do things somewhat differently.

Once you’ve settled on the timing of cash flows, it’s time to enter the forecasted expenses for the last month of the current year through the last month of the planning (next) year. The reason that expenses are entered for the last month of the current year is because of the % payment of prior month expenses field. We must know how much cash is going to leave the church in January, because of December expenses.

The relevant cash flow amount is automatically calculated for each month and totaled by category.

Flashback to the capital budget

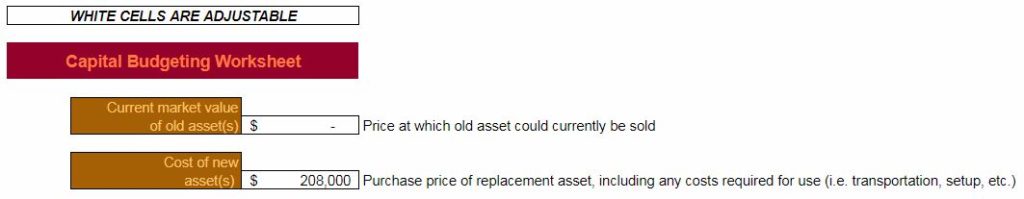
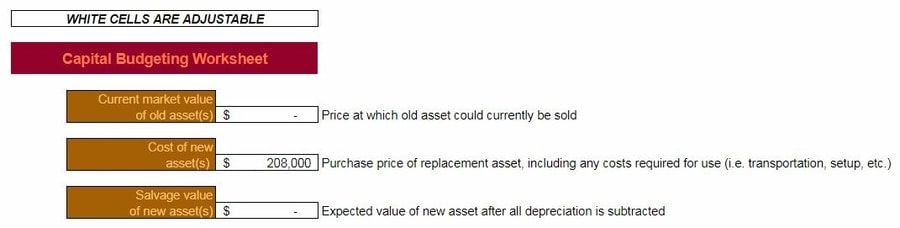
Think back to the capital budgeting for churches post that I wrote a couple of months ago. You might remember that the plan was for our hypothetical church to add 53 parking spots in the coming year. They planned to do this because the congregation was growing and they need additional capacity for parking.

You might also remember at the expected initial cost for this new parking lot was $208,000.

church-cash-flow-disbursements-schedule-capital-expenses
Click to enlarge

As you can see, in accordance with the capital budget, our example church expects to make three payments of $69,333. We’re assuming that, for this construction project, payment will be made in three equal portions over the three months it takes to start and finish the parking lot.

Our hypothetical church isn’t so big that it can disregard the spending of over $200,000. So, obviously, we needed to work that into the financial budget. The capital expenses section of the Cash Disbursements Schedule is where that’s done. This information will now carry over to the Cash Budget. This is where planning can be done for financing, if necessary.

Creating a cash budget

The Cash Budget brings together information entered in the Cash Collections Schedule and the Cash Disbursements Schedule. In addition, financing, both short and long-term are addressed; as are investments.

This is where you will forecast your actual cash balances throughout every month in the planning year. Only a few fields need to be entered. Most of what is analyzed in the Cash Budget is based on the previously entered information.

church-cash-flow-budget
Click to enlarge

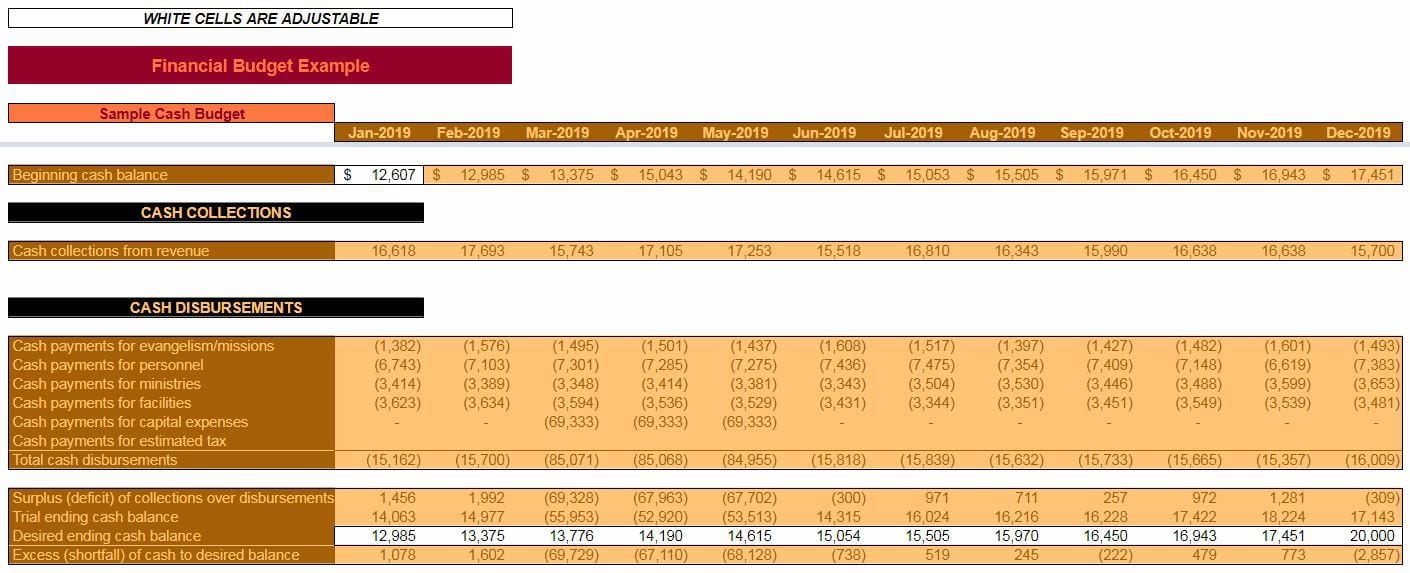
Logically, the first bit of information to be addressed in the Cash Budget is your Beginning cash balance. This will need to be entered for the first month of the planning period. You will probably have to forecast this amount if you are (as you should be) planning several months in advance. Don’t worry, as the time gets closer, this amount can be changed and, just as with any of these planning tools, tweaks can be made

From that point on, the Beginning cash balance is automatically calculated. Because, of course, the Beginning cash balance for any given month is going to be the same as the Ending cash balance for the previous month.

Cash collections and disbursements

The cash collections and cash disbursements sections will each pull from their respective Schedules – with a few exceptions.

Surplus(deficit) of collections over disbursements = Cash collections from revenueTotal cash disbursements

This amount represents the difference between cash collections and cash disbursements in a given month. A positive amount means that more cash was collected than dispersed. A negative amount means the opposite.

Notice that the months where cash payment is made for capital expenses – the deficit is rather large. This is to be expected and will be addressed more in-depth later in the worksheet.

Balancing cash

Trial ending cash balance = Surplus(deficit) of collections over disbursements + Beginning cash balance

The Trial ending cash balance represents the change in your church’s cash balance based on the Beginning cash balance, Cash collections from revenue, and Total cash disbursements. There might be situations where this amount is considerably less than you would like it to be (particularly if it’s negative). On the other hand, there might be situations where this amount is more than you need it to be. Situations where you’re holding more cash than you would like, or is necessary.

The amount of cash you want your church to hold at the end of any given month is specified in the Desired ending cash balance field. An amount will need to be entered for every month of the planning period.

This is the amount that the Cash Budget will force balance to, based on the formulas in the worksheet. Forcing is done by increasing cash with investments, short-term financing, or long-term financing. If you don’t like how the balance was forced, then you will have the opportunity to make changes later in the worksheet that are more to your liking.

Excess (shortfall) of cash to desired balance = Trial ending cash balanceDesired ending cash balance

This amount tells you how close or far away your church is, based on the Trial ending balance, to your Desired ending cash balance.

Positive amounts will either go towards paying down debt, or it will go to an investment account. Conversely, negative amounts will either be covered with debt or will be pulled from investment accounts.

Let’s look more in-depth into financing and investments…

Short-term financing needs for your church

Short-term financing is a fancy term for money borrowed for less than one year. Typically, short-term financing is used for short-term cash flow issues.

In this example, we assume that the short-term financing is a revolving line of credit which allows the church to borrow moderate amounts of cash in order to cover the occasional cash flow shortfall.

church-cash-flow-short-term-financing
Click to enlarge

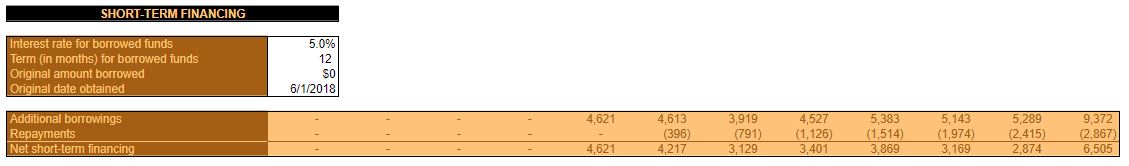
You’ll also have the opportunity to enter the particulars about any existing short-term loans your church has outstanding. The rate and term entered for existing loans are assumed to be the same for any additional loans taken out through the remainder of the planning period.

Information entered for existing short-term loans is pretty straightforward. Simply enter the Interest rate for the borrowed funds, the Term (in months) for borrowed funds, the Original amount borrowed, and the Original date obtained.

Keep in mind, this is short-term financing. So the Term (in months) for borrowed funds should be less than or equal to twelve. Anything more than twelve months would be considered long-term financing.

If your church has no outstanding short-term loans, then enter $0 in the Original amount borrowed. Also, keep in mind that the Original date obtained for short-term financing needs to be within a year of the first month of the planning period in order to affect cash flow.

When will short-term borrowing take place?

As mentioned earlier, short-term financing is assumed to cover any shortfalls in cash not covered with long-term financing. It’s also not assumed to be covered with cash pulled out of investments.

The formula for Additional borrowings looks at the Excess (shortfall) of cash to desired balance, Repayments for existing short-term financing, Additional borrowings for long-term financing, and Repayments for long-term financing. If these amounts are less than zero, then additional short-term borrowing is needed.

If that’s the case, enough will be borrowed to cover the Excess (shortfall) of cash to desired balance. Repayments for existing short-term financing, and Repayments for long-term financing minus the amount that’s able to be pulled out of investments. In this workbook, it’s preferable to pull money out of investments rather than borrowing additional funds.

The calculation for short-term financing Repayments is too complicated to cover in detail. It’s calculated in a background worksheet. What this field looks at, is the Original amount borrowed, and any Additional borrowings from previous months. The total of the payments for all those short-term borrowings is displayed here. So, if additional short-term borrowings take place in a given month, the following months you will see an increase in negative cash flow due to the increase in payments owed

Net short-term financing = Additional borrowings + Repayments

This is the total effect on cash flow from activity in short-term financing for a given month. If more is borrowed than is repaid then this will be a positive amount. That’s because more cash came into the church than left it. If Repayments are more than Additional borrowings then this will be a negative amount. More money left the church than came in, due to short-term financing.

Need expert advice for managing cash flow? Read this post:
PLAN SMALL BUSINESS CASH FLOW – HELPFUL TEMPLATE & TIPS

Long-term financing needs for your church

Whereas short-term financing covers borrowing money for less than one year, long-term financing covers borrowing money for more than one year. Long-term financing is typically used for long-term projects. For example, projects that have been approved during the capital budgeting phase of strategic planning.

In this example, we assume that long-term financing is used sparingly. It is not a revolving line of credit. Loans are repaid on an installment basis. Since loan amounts are typically big, Repayment amounts are also big.

Also, like short-term financing, you’ll have the opportunity to enter information about any existing long-term loans. The interest rate and term for the existing loans are the rate and terms presumed for any Additional borrowings entered throughout the year. This is unlikely to be exactly the case, admittedly, but for sake of this example, it is adequate.

church-cash-flow-long-term-financing
Click to enlarge

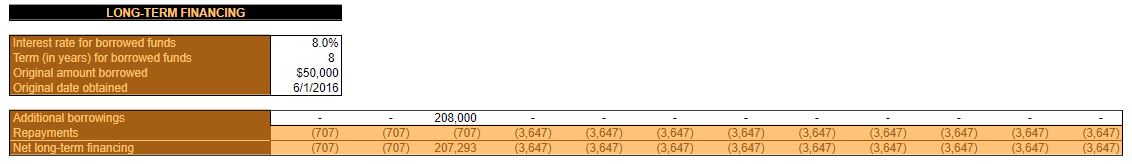
For long-term financing currently outstanding, an Interest rate for borrowed funds, Term (in years) for borrowed funds, Original amount borrowed, and Original date of obtained must be entered.

Since this is long-term financing, ensure that the Term (in years) for borrowed funds is greater than or equal to “1.” Anything shorter than a year belongs in short-term financing.

If your church currently has no long-term loans, enter 0 in the Original amount borrowed. If the Original date obtained is further in the past than the Term (in years) for borrowed funds, then the Repayments for the existing loan will not show up in this year’s cash budget. Because… of course, the loan would already be paid off.

Additional borrowings

Additional borrowings for long-term financing are (typically) only done for long-term projects. Therefore, these amounts have to be entered manually. If capital projects are being financed with long-term debt, then you would probably want the Additional borrowings to coincide, roughly with the Cash payments for capital expenses.

Repayments for long-term financing are also calculated in the background. They reflect any existing loans outstanding at the start of the planning period. Plus, any Additional borrowings taken out during the planning period are reflected as increased Repayments in the months that follow.

Net long-term financing = Additional borrowings + Repayments

Net long-term financing is the total effect on cash flow for a given month in regards to long-term borrowings. When money is borrowed, the amount will usually be positive. As money is repaid the amount will be negative.

Using an investment (or savings) account

The investments account, for the purposes of this example, was created to help our hypothetical church always close the month near its Desired ending cash balance. Your church may or may not have a separate investment account, and that’s fine.

In theory, though, it wouldn’t hurt. Many times, on a Balance Sheet, cash and equivalents are grouped together. An investment account such as this might qualify as the “equivalent” to the cash that’s actually in the checking account. It is a place where you could invest excess cash that is relatively risk-free, and liquid (the term liquid, if you’re not familiar, means that it could easily be converted into cash).

Some examples of where you might park your church’s savings or investments are: money market accounts, CDs, short-term treasury bills, or something similar. The amount of return you’re going to earn on those investments isn’t going to be astronomical. But, you’re in the business of running a church, not a hedge fund. So, as long as the money is safe and earning a little bit of a return – that should be adequate.

church-cash-flow-investments
Click to enlarge

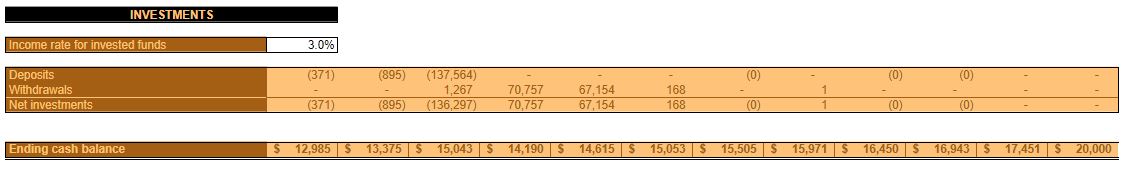
The only field that needs to be entered in the investment section is the Income rate for invested funds. This is the annualized growth rate of monies that are in your investments accounts. The calculation for the balance in the investment account takes place in the background. It does take into account dividends and interest that would be earned in such an account. Income earned from investments is available for future withdrawals.

About the timing deposits and withdrawals from investments

The investments account looks first at the Excess (shortfall) of cash to desired balance. Next, it looks at short-term financing and long-term financing. Any excess cash is entered as a Deposit into the investments account. Conversely, Withdrawals from the investments account are made when the Excess (shortfall) of cash to desired balance and Repayments for both long-term and short-term financing are negative.

Since Withdrawals does not look at Additional borrowings, there might be situations where a Deposit and Withdrawal are made within the same month. A Deposit for excess money borrowed and Withdrawal to cover the Repayments.

Deposits are represented as negative amounts. This is because, technically, they come out of cash. Withdrawals are represented as positive amounts. They represent money put back into the checking account in order to achieve the Desired ending cash balance. Obviously, since the investments account is an asset for the church these negative and positive amounts don’t necessarily represent an increase or decrease in the church’s equity.

Net investments = Deposits + Withdrawals

This is the total amount that the cash balance has changed for a given month.

The ending cash balance

Ending cash balance = Trial ending cash balance + Net short-term financing + Net long-term financing + Net investments

Of course, as mentioned earlier, the Ending cash balance will be the Beginning cash balance for the following month. This is where the church forecasts its cash balance will end up at the end of the month. This amount should approximate the Desired ending cash balance.

*This is a long post. Click here to read Page 2.

Simple Small Business Cash Flow Template, 7 Week Projection

plan-small-biz-cash-flow-featured

“How useful is a cash flow forecast to a small business?” Even a simple, short-term, cash flow forecast can help a small business avoid insolvency. By seeing potential cash flow issues weeks in advance, strategies can be utilized that will allow you to be proactive and help ensure your small business’s survival.

Small business cash flow planning involves calculating the effects of future inflows and outflows. Doing so will allow your small business to plan for problems. Then you can take control of them before they spiral out of control. Below, you can download an easy-to-use spreadsheet to manage your small business’s short-term cash flow.

Most small businesses aren’t “cash cows.” Even the most prudent small business owner can occasionally run into circumstances where cash is flowing out faster than it’s coming in.

Yes, you’re busy running the operations of your business. Maybe you’ve handed the reins of the accounting and finance functions to someone else. But, you’re the owner. You have to ensure that you have the cash available to fill your short-term obligations

Download a simple small business cash flow template

This site is called Spreadsheets for Business, so this post wouldn’t be complete without an accompanying cash flow template.

Complete the form below and click Submit.
Upon email confirmation, the workbook will open in a new tab.

This is a really simple template and it doesn’t require too much in the way of input. As with all other Spreadsheets for Business workbooks, the white cells are the ones that you fill in. The colored cells (gray in this case) have formulas and text in them.

The example data illustrates how the template works. It is for a hypothetical bookkeeping company that has revenue in the form of commissions, hourly fees, monthly fees, and consulting. It also has your typical small business expenses including things such as travel, leases, payroll, and utilities

A quick how-to on this spreadsheet

plan-small-biz-cash-flow-worksheet

First of all, delete the example data out of the white cells. Then in cell D3, enter your business’s Current cash Balance.

Next, move down and fill in projected cash inflows and projected cash outflows for each day in the upcoming week. This is done in cells D7 through E13. Remember to enter inflows as positive, and outflows as negative. The Running Balance will update automatically.

For each inflow and/or outflow you enter, you have the option of typing a quick note to explain the transactions taking place.

After you’re done entering cash inflows and cash outflows for the coming week, move below and enter them for the upcoming six weeks. Just as above, notes can be entered to elaborate on the weekly inflows and outflows.

Finally, a simple chart is included at the bottom to illustrate the changing cash balance over the next seven weeks.

It might be that your accounting software already does something similar for you. Perhaps it’s even more robust in its analysis? However, if your accounting software doesn’t do such a thing; or if you don’t know how to use it – this simple template will give you the opportunity to think critically (even if only briefly) about this important aspect of your business.

What is small business cash flow projection?

Cash flow projection means looking into the future. Taking what you know, plus what you guess, to monitor your cash balance.

Some expenses, and possibly some sales, you know are going to flow in or out of your business in a predictable manner. You know what day it’ll happen and you know how much it’ll be.

Other cash inflows or outflows might not be as predictable. An unexpected inflow might come your way, and it’d be a very positive thing. On the other hand, you’ve almost certainly had a situation where a large unexpected outflow is necessary. That’s not quite as positive.

Cash outflows, as I’m sure you’re aware, aren’t all negative, however. Ideally, all of the cash that leaves your business is an investment, of sorts. That investment might be in an employee, it might be in inventory, it might be in an asset, or it might be in anything else that helps you create value for your customers. In other words, something that brings in bigger future inflows.

How sophisticated does cash flow forecasting need to be?

The act of projecting your business’s cash flow can be simple or complex. You can use sophisticated software; or a piece of paper and a pencil. What’s important is that you take the time to perform this important task – not necessarily how you perform it.

If you like to approach things from a simplistic standpoint, then that’s what you should do. On the other hand, if you enjoy diving into the details, then there’s really no limit to how in-depth you can go with your analysis.

When you forecast your small business’s cash flow, you can forecast no further than tomorrow; or you can forecast 10 years into the future. The closer to the present you forecast, the more likely your forecast is to be accurate.

A lot can happen in 1 year; not to mention 10 years. So, if you do decide to forecast long-term, just keep your expectations realistic. Financial budgeting is a part of strategic planning. By its nature, strategic planning is focused on long-term horizons.

That being said, there’s absolutely no reason that you can’t do extremely short term planning when it comes to cash flow. We’ll call that tactical planning. And, tactical cash flow planning could be critical to your small business’s success.

Why should your small business manage cash flow?

A lot of business problems are, of course, caused by costs exceeding revenue. Beyond that, however, it’s the timing of cash flow in and out that is the real root of the problem. Once you come up short on cash to pay your vendors/suppliers, pay your employees, or pay for your other assets, it’s easy to picture how this could start a downward spiral from which your small business can’t escape.

The best time to start managing your cash flow is when you started your business. The next best time is right now.

Just committing a little bit of time, and performing a simplistic analysis is better than nothing. However, with the tools available on SpreadsheetsForBusiness.com and from other bloggers or software providers, this seemingly frustrating task can be made manageable.

By taking ownership of the things you can control, you put yourself in a position to better handle circumstances out of your control.

Tactics for managing cash flow

Forecasting into the future, even if it’s only a few days or weeks, puts your cash flow situation into perspective. With this perspective, you should be able to better understand what you can control. You very well might not be able to change the amounts of cash outflow. But, you might be able to change their timing. For instance, can you push an expense back (even just a few days) in order to have it better coincide with a cash inflow?

Conversely, if you see that you’re going to run up against a cash flow crunch in the not-too-distant future, maybe you can make efforts to upsell current customers? Or, maybe you can make a push to find new customers? Doing these sorts of things might bring in cash flow and keep your checking account in the black.

Likewise, if you forecast cash inflow coming in the near future that you really need sooner, perhaps you can reach out to a customer and ask if they can pay a portion in advance? Maybe it even makes sense to offer a small discount if they do so in order to be able to avoid the threat of insolvency.

Cash flow crunches don’t just happen over the course of days though. They can be a long time coming. So, don’t limit your analysis to the very short-term.

I recommend that you also look out over the course of the coming year and walk through the steps of my small business financial budgeting workbook. It accomplishes the same things as mentioned above, except it allows you to take a couple of steps further back to look at an even bigger picture. The benefits are the same, however. You’ll be armed with the proper perspective in order to be proactive in addressing potential problems for your business.

Every business and industry is different. There is no one-size-fits-all advice for tweaking your cash flow. What I want to make clear though, is that willingly or unwillingly turning a blind eye to what the future holds for your cash flow puts you in a position where you can’t do anything. By simply taking the time to look at the future, you’re empowering yourself to be able to take some sort of control.

Check out 13 tried and true cash management techniques here.

How useful is a cash flow forecast for a small business?

Remember, a more sophisticated analysis can provide you with better answers. But, the bulk of the benefit comes from simply thinking through the subject at hand and taking proactive steps to avoid problems.

If you want to really get serious about your cash flow management, then also check out the Spreadsheets for Business financial budgeting post and downloadable template. It is way more in-depth than this and allows you to plan out over the course of an entire year.

FIFO Method? Weighted Avg? The Full Model of Process Costing

process-costing-weighted-average-vs-fifo-featured

There are two methods that can be used to allocate costs in a process costing system. They are weighted average or FIFO (First In First Out). Accountants and business owners can decide which method to use based on their preference for simplicity or accuracy. Of course, there are differences between the two methods. But, they also share similarities…

The FIFO and weighted-average methods each always use these same inputs:

  • Ending WIP units
  • Percentage complete for materials & conversion
  • Amount spent on materials & conversion

Here’s a look at some of the differences between the weighted-average and FIFO methods (by step):

Unit ReconciliationCost/Equivalent UnitCost Allocation
Weighted-average method
Considers begin WIP 0% completeAllocates the value of begin WIPBegin WIP + Monthly expenses =
Amt completed & transferred + End WIP
FIFO method
Considers begin WIP partially completeAllocates expenses incurredMonthly expenses = Amt to
complete begin WIP + Amt started & completed + End WIP

Both methods are, generally speaking, similar. Which you should use depends in large part on preference. It also depends on your ability to conceptualize what is taking place.

A process costing system is primarily used by manufacturing companies that mass-produce a bunch of the same product. A process costing system can be contrasted with a job order costing system. A job order costing system would be used by companies that offer custom products and/or services.

Download the example workbook

Looking for a spreadsheet to build an entire process costing system (weighted-average method)? Read this post:
DEFINITION AND FEATURES OF A PROCESS COSTING SYSTEM

Complete the form below and click Submit.
Upon email confirmation, the workbook will open in a new tab.

Process costing – FIFO vs weighted-average

Need more help with your accounting homework? Read this:
WORKSHEET POSTS

The weighted-average method might be considered simpler. But, the FIFO method might be considered more accurate. That being said, once the groundwork is laid for a FIFO process costing system, calculations should be made automatically and require a minimum of effort on your part. That is…if everything’s set up correctly.

Below, I’ll compare the calculations from the weighted average and FIFO methods. Each will refer to the same inputs – Item1, Dept A, from the Process Costing workbook. That way, you’ll be able to compare the two methods side-by-side, apples-to-apples, and decide which makes the most sense for your company. Then, you can move on to more pressing matters.

Unit reconciliation

Have more questions about the FIFO method of costing? Read this post:
FIFO METHOD – WHAT IT IS, WHY & HOW TO USE IT

process-costing-weighted-average-vs-fifo-unit-reconciliation

The purpose of unit reconciliation is to determine the total number of units to allocate costs across in a given month.

Obviously, those units that were completed will be included. But, also factored in, are “equivalent units.”

Equivalent units

Equivalent units = WIP units × Pct complete

These units are calculated for direct materials (DM), direct labor, and overhead individually. Why? Because these value-added costs are not applied uniformly.

For simplicity’s sake, overhead is assumed to be applied on the basis of direct labor hours. These two costs are, therefore, combined in this example and called conversion (costs).

Pct complete examples

For example, a particular product might have all its materials added immediately when it enters a department. The labor and overhead, however, might be added at a slower pace as those materials are assembled, mixed, machined, or whatever… In this case, the percentage (Pct) complete might be high for DM, but low for conversion.

Conversely, the most costly direct materials might be added during the last operation in a department. Since a lot of conversion costs have been applied, but the most expensive DM are not added until the end, the Pct complete might be high for conversion, but low for DM.

Hopefully, that makes sense. Reread it if you need to.

It all depends on the product being produced and the nature of the value-added in a given department.

Beginning WIP units

You’ll notice that Beginning WIP units aren’t factored into the unit reconciliation calculation for the weighted-average method. With the weighted-average method, Beginning WIP is considered to be started & completed in the current month.

No matter if last month’s Ending WIP units were 99% complete for DM and conversion costs. This month, Beginning WIP units are considered 0% complete. Under the weighted-average method, that is.

With the FIFO method, Beginning WIP units are included in Total units reconciled. Specifically, the equivalent units that weren’t included in last month’s calculation. For example, suppose last month’s Ending WIP units were considered 30% complete. Then, this month 70% of the Beginning WIP units will be used in the Total units reconciled calculation this month.

In fact, if you change the Pct complete for DM and conversion to 0% for the FIFO method, you’ll see that the Total units reconciled are the exact same amount for both methods.

DIFFERENCE 1: THE WEIGHTED-AVERAGE METHOD CONSIDERS BEGINNING WIP TO BE 0% COMPLETE. THE FIFO METHOD DOES NOT.

Completed & transferred vs started & completed

This subtle difference in verbiage makes a big difference in calculations between the weighted average and FIFO methods.

As mentioned above, Beginning WIP is always considered to be 0% complete with the weighted-average method. Ending equivalent units are added to Units completed & transferred to determine the Total units reconciled with the weighted-average method.

With the FIFO method, that is not the case. Since Beginning WIP units are already considered partially complete, Units started & completed are quantified separately. As the title implies – these are units that were both started and finished in a given month.

Total units reconciled

The weighted-average method adds the Ending WIP equivalent units to the Units completed & transferred to arrive a quantity for units reconciled.

The FIFO method does something similar. Ending WIP equivalent units are added to Units started & completed. Beginning WIP equivalent units (1 – Pct complete) are then also added to that quantity.

Cost per equivalent unit

process-costing-weighted-average-vs-fifo-cost-per-equivalent-unit

Unit reconciliation only focuses on units. No costs were considered. Now, it’s time to tally costs for the month and to calculate a Cost per equivalent unit.

Cost per equivalent unit = costs to be allocated ÷ Total units reconciled

Comparing total costs between months, years, or even days doesn’t give you the whole picture. In order to have the whole picture, total costs must be compared using some sort of common denominator.

Hence the need to break costs down on an equivalent unit basis. Equivalent units take into consideration how many units were started, completed, transferred, and left in WIP at the end of the month. Every unit and every dollar is accounted for. So that accurate comparisons can be made.

Total costs to be allocated with the weighted-average method includes the value of Beginning WIP + Monthly expenses incurred. So, since Beginning WIP units were considered 0% complete and added to the Total units reconciled, the Beginning WIP amount (last month’s Ending WIP amount) is also included in the numerator to offset these units.

DIFFERENCE 2: THE WEIGHTED-AVERAGE METHOD ALLOCATES THE VALUE OF BEGINNING (LAST MONTH’S ENDING) WIP. THE FIFO METHOD ONLY ALLOCATES EXPENSES INCURRED THIS MONTH.

Total costs to be allocated under the FIFO method only includes the Monthly expenses incurred. Only costs from this month are used to calculate Cost per equivalent unit. Because, unlike the weighted-average method, only units from this month are reconciled.

Because the weighted-average method includes the value of Beginning WIP and the FIFO method does not, the weighted-average method will always have higher Total costs to be allocated. Whether that translates into a higher Cost per equivalent unit depends on the Beginning WIP units and the Units started & completed.

Cost allocation

process-costing-weighted-average-vs-fifo-cost-allocation

Whereas the Total costs to be allocated include costs that the company started the month with (weighted-average method) and those that were added. The Total cost allocation includes costs that were passed to the next department (or finished goods) and those that the company ended the month with.

The Total costs to be allocated should always equal the Total cost allocation. Costs can’t just disappear into thin air.

In the weighted-average method, the equation balances as follows:

Beginning WIP amount + Monthly expenses = Amount completed and transferred + Ending WIP amount

In the FIFO method, the equation balances as follows:

Monthly expenses = Amount to complete beginning WIP + Amount started and completed + Ending WIP amount

Weighted-average or FIFO for process costing?

Conventional wisdom says that the weighted average method is simpler than the FIFO method. I suppose this is said because Amount to complete beginning WIP need not be calculated for the weighted-average method.

Do you have homework questions about a job order costing system too? Read this post:
JOB ORDER COSTING SYSTEM – EXAMPLE, TEMPLATE, & HOW-TO

But, since you will be determining the Pct complete for DM and conversion costs for Ending WIP units (which will become your quantities for next month’s Beginning WIP units) it shouldn’t matter. The calculation is already made.

Learn more about cost minimization here.

Better to go with the method that produces a more accurate Cost per equivalent unit. Rather than one that blurs the lines between what was done last month and what was done this month. Particularly if you are in a super-competitive environment where accurate costs are needed to price appropriately.

Yes, I know that the Spreadsheets for Business Process Costing example workbook uses the weighted-average method. Confession: it wasn’t until I wrote this post that I really explored the difference between the two methods. If it ever makes sense to redo the process costing example workbook, I will use the FIFO method.

What do you think? Are there any circumstances where the weighted-average method makes more sense?

Is there something I missed? Or, do you have any questions?

Join the conversation on Twitter!

Church Operating Budget Template (Free) With Walkthrough

church-operating-budget-featured-1

Month 1Month 2Month 3Total
Revenue budget
Source 1$9,900$10,100$9,500$114,300
Source 23,3003,3003,10037,900
Total revenue$13,200$13,400$12,600$152,200
Expense budget(s)
Expense 1$(6,630)$(7,260)$(7,315)$(86,680)
Expnese 2(3,596)(3,671)(3,516)(41,957)
Total expenses$(10,226)$(10,931)$(10,831)$(128,637)
Operating profit$2,974$2,469$1,769$23,563
  • Download the free template by filling out the form below
  • Categorize and list detailed expenses
  • Forecast revenue needed to cover expenses
  • Review the pro forma income statement and ratios
  • Plan for the best and worst-case scenarios

Download the church operating budget template

Complete the form below and click Submit.
Upon email confirmation, the workbook will open in a new tab.

Operating budget example for small churches, big churches, and every church in between

This is the second post on church budgeting and the fifth overall on church strategic planning.

Previously, the capital budget for the church was covered in depth. This post will focus on the operating budget. The capital budget, if you’ll remember, is the budget that the church completes for every potential project it plans to take on in the coming year. The operating budget consists of a forecast of revenue and expenses for the coming year. The culmination of the operating budget is a pro forma (or expected) income statement.

Does your church have big projects planned for this year? Read this post:
CHURCH CAPITAL BUDGET – WHY IT MATTERS & HOW TO DO IT RIGHT

After completion of the capital budget and the operating budget, the church will be ready to tackle the financial budget. The financial budget will be covered in the next post.

What is an operating budget for a church?

An operating budget allows a church to be proactive regarding its revenues and expenses for the coming year. It allows the church to plan accordingly and to be ready for any scenario that might come its way. Doing so will allow the church to better meet its mission.

Information gleaned from the mission statement, SWOT analysis, strategy formulation, and capital budgeting will all play a part in preparing the Operating Budget for the coming year.

Creating an operating budget can be as simplistic as writing down a guess about how much revenue the church will make in the coming year and the number of expenses it will incur. This is better than nothing.

Dedicating some thought to each revenue source and each type of expense, plus estimating how they might rise or fall over the course of the year helps to paint a more accurate picture of the church’s financial position. Additionally, using the Spreadsheets for Business church operating budget template will give you the ability to not only estimate what the most likely scenario to play out next year will be, but will also help you to plan around a best case scenario and a worst case scenario.

Download the template by filling out the form at the top of the post.

How much time and effort should be dedicated to a church operating budget?

Any amount of planning is better than no planning. There is, however, such a thing as over-planning – AKA, paralysis by analysis. The sweet spot is somewhere in the middle – enough planning for you to feel confident that your church is in a position to thrive in the coming year.

The amount of thought you dedicate to each item in this church operating budget example is up to you. I urge you not to overthink it. However, after going through the following steps, I think you’ll find yourself rather confident about your church’s future going into the new year. With some of the worry off your plate, you can focus on other areas that will help your church achieve its mission.

How might an operating budget for a church differ from a for-profit business?

Fortunately, creating an operating budget for a church is much less complicated than for, say, a manufacturing company.

When creating an operating budget for a manufacturing company, you start with revenue and work your way through budgets for materials, labor, overhead, production, and a lot of other inputs.

When creating an operating budget for a church (which is essentially a service) some of that complication can be avoided.

Should you start with budgeting for revenue or expenses?

Personally (and maybe this is due to my background in budgeting for manufacturing organizations), I still think it’s smart to start budgeting with revenue. That way, you know how much you expect to make in the coming year and can plan your expenses around that information.

However, there’s also a school of thought, particularly by Aubrey Malphurs and his organization, that claims you should plan your expenses first. Then, you know how much you need to bring in to cover those expenses. Aubrey is much more of an expert on church operations than I am, admittedly. I can see the rationale behind this school of thought.

You should start with whichever you’re more comfortable with – expenses or revenue. I imagine as you get deeper into the process of forecasting, that you’ll be bouncing back and forth between the two anyway. So, ultimately, what you start with won’t matter. Unlike a manufacturing company, the levels of your revenue and expenses won’t necessarily affect each other. All that matters is what you end up with.

Do you have a sound mission statement to build strategic planning on? Watch this video:
CHURCH MISSION STATEMENT WALK-THROUGH [VIDEO]

Why should your church have an operating budget?

Look, your budgets are never going to be exactly right. That’s fine. What’s not fine is going into the coming year with a church that is at risk because you haven’t dedicated adequate thought to what the coming year may bring.

An operating budget won’t guarantee that your church will be successful. That’s why you shouldn’t spend every waking second working on it. It’s just a matter of giving appropriate thought to the matters of revenue and expenses.

The Pareto Principle states that 80% of outputs come from 20% of inputs. If you buy into this – 80% (or so) of the benefits of creating an operating budget for your church will probably come from the first 20% of the time that you spend on it. What this means, of course, is that by merely dedicating a tiny bit of thought to these matters, your church will reap big benefits.

How to create an operating budget for your church

Operating budgets look complicated, but at their core, they’re fairly simple. All you’re going to be doing is estimating your expenses, estimating revenues, and then filling in a couple of other details. There are no wrong answers. As a steward for your church, you’re in a better position to answer these questions than anybody else on Earth.

Let’s get started!

Your church’s expenses

Obviously, your church has costs that it incurs to provide needed support to its membership. Again, I have to give credit to Aubrey Malphurs for the framework of how expenses are grouped together.

Expenses are grouped into four broad categories: evangelism/missions, personnel, ministries, and facilities.

Within each broad category, each Expense is broken down into more specific categories and beyond that, into greater Detail.

So, depending on how organized your accounting is, you should be able to (hopefully) begin by breaking your existing expenses down into these four broad categories. Once you’ve done that, then you can begin to group similar expenses by subcategories. Then eventually, of course, you want to budget for every detailed expense.

Classifying expenses as fixed or variable

Along with every Expense in a subcategory, you’re going to classify it as fixed or variable. This sounds like a pain in the rear, but it’s good to understand the nature of each cost.

Fixed expenses, as the name implies, don’t change with revenue. They’re going to be the same whether you have a very busy year or a year where you just sit around twiddling your thumbs. For example, salaries are fixed and insurance is fixed. Any other expense which will be the same month after month, over the course of the year, is fixed.

Variable expenses, on the other hand, change. They typically change based on the level of revenue. If revenue goes up, variable expenses also go up. If revenue goes down, variable expenses would probably go down. For example, expenses related to outreach and local mission work might depend, in large part, on the amount of revenue received. So they can probably safely be classified as variable.

There’s no right or wrong answer when it comes to classifying your costs as Fixed/Variable. Some will be obvious, while others…not so much. Again, don’t dwell too much on this classification. Give it a little thought and select what you think is appropriate. The only real effect is on some of the ratios that are calculated once the budget is completed. You can always go back and change your classification.

Use the past to plan for the future

You can refer back to historical amounts, of course, to help with the forecasting of future expenses. In fact, that’s probably a very smart thing to do. Looking back at historical amounts paid will also help you to determine if an expense is fixed or variable.

If this is your first time completing an operating budget such as this, then I would suggest that you still break each expense down into broad categories (evangelism/missions, personnel, etc.). But, maybe don’t break them down into too many subcategories (district & synod support, convention assessment, etc.). And, definitely don’t overdo it breaking expenses down into detailed categories (detail expense 1, detail expense 2, etc.). You can always go into more detail next year.

On each of the broad category budget worksheets, you’re going to start at the top and list each Expense subcategory. Also, pick either Fixed or Variable from the drop-down menu.

In the bottom section – this is where you’ll break the subcategories down into detailed expenses. All of the detailed expenses will sum for the month and that amount will be carried back to the top

Let’s look a little deeper into each broad category.

Evangelism/Missions Budget

evangelism-mission-expenses
Click on image to see a full-size version in a new tab.

The Evangelism/Missions Budget is where you’ll classify expenses related to efforts directed externally from the church to reach individuals who likely aren’t members.

Next, go to the detail section and itemize the subcategory expenses. Additionally, start forecasting month by month for the whole year. Each subcategory will automatically add all the detailed expenses.

You’ll see that a Total for each month and for whole the year is calculated. These amounts will carry over into other worksheets.

Personnel Budget

church-operating-budget-personnel-expenses
Click on image to see a full-size version in a new tab.

The Personnel Budget is pretty self-explanatory. This is the money planned to be spent on the individuals who help run your church.

Expenses such as salaries, fringes, utilities for housing, and guest pastors/speakers would be entered here.

Ministries Budget

church-operating-budget-ministries-expenses
Click on image to see a full-size version in a new tab.

The Ministries Budget is where you will enter expenses directed toward the individuals that are already a member of your church.

You know the drill by now – enter the appropriate subcategories and then the names and amounts for the detailed expenses.

Facilities Budget

church-operating-budget-facilities-expenses
Click on image to see a full-size version in a new tab.

The last category of expenses is also pretty self-explanatory. A Facilities Budget includes those expenses that are required for your church, as a whole, to function.

How do you differentiate if expenses are for personnel or facilities? Easy, if the expense is, more or less, for one employees’ benefit then it’s probably a personnel expense. Conversely, if an expense is for everybody’s benefit then it’s probably a facilities expense.

As mentioned before, this is all somewhat subjective. There are no right or wrong answers, per se. Trust your gut, trust your experience, and classify expenses in whatever way makes the most sense to you.

If you’ve been following along closely, you’ll notice a special expense listed under the maint and repairs subcategory.

In the capital budget, we examined the feasibility of adding on to the church’s parking lot. Ultimately, based on the expected cash inflows and cash outflows, it was determined that making an addition to the parking lot was in the church’s best interest. So, in our hypothetical church, that project will be undertaken and will need to be included in the coming years’ operating budget. You’ll see detailed expenses related to the parking lot under the maint and repairs subcategory and the depreciation subcategory.

Don’t solely rely on what you spent in the past to create a feasible budget going forward into the future. Make a note of anything that might change and of any new expenses that might be incurred in the coming year due to projects approved in the capital budgeting phase.

Want to know how fixed costs can help or hurt your church? Read this post:
OPERATING LEVERAGE FORMULA EXPLAINED + CALCULATOR

How much revenue will you need to cover those expenses?

church-operating-budget-revenue
Click on image to see a full-size version in a new tab.

Estimating expenses is a bit depressing. But now we get to tackle the fun part, and that is estimating revenue.

Revenue also has subcategories, but they are not broken down into detail.

By now, you know the routine. In the Revenue Budget, enter the start date for your budget in the cell D9.

You’ll see that the Revenue Source column is already populated but you’re welcome to change the descriptions as you see fit.

For each month and each Revenue Source, enter the forecasted amount of revenue. A Total for the months and for each Revenue Source will automatically be calculated.

Maybe you’re baffled as to how to forecast revenue. Offerings and donations are probably at least somewhat consistent. But, other sources of revenue like facilities use charges and trusts, investments and bequests are difficult, if not nearly impossible, to accurately predict.

First of all, I’ll say the same thing I did when it came to forecasting expenses, and that’s to just come to terms with being wrong in the first place. The value in this, again, is to dedicate a little bit of thought to it.

Spreadsheets for Business has a free tool that can help you forecast revenue (or expenses, or anything really…) accurately and it can also help you gain insights into what drives revenue.

Once the information is entered into the Revenue Budget, then you are very nearly done with the operating budget.

The church’s Pro Forma (expected) income statement

church-operating-budget-pro-forma-income-statement

After completing all of the expense budgets and the Revenue Budget, you should see a nearly completed Pro Forma Income Statement. All that’s left to enter is information about interest.

If your church keeps funds in an account that pays a reasonable amount of interest, enter what you might expect to earn this year in the Interest Income field.

On the other side of the coin, if your church borrows money, then you will likely have Interest Expense over the course of the year. That amount in the Interest Expense field should be added as a negative amount.

Now you should have a pretty reasonable idea of what the coming year will look like from a revenue and expense standpoint. Notice that each of your expense categories has the amount as a percentage of Total revenue listed next to it. This gives you an idea of how your expenses are weighted.

For reference, Aubrey Malphurs recommends the following weightings:

  • Evangelism/Missions 10%
  • Personnel 40%
  • Ministries 25%
  • Facilities 25%

Obviously, your church doesn’t have to have this exact percentage for each expense category. But it simply gives you a benchmark to measure your church against.

All the calculations in the Pro Forma Income Statement are pretty straightforward. Operating Profit is Total RevenueTotal Expenses. Net Profit is what’s left after Interest Income and Interest Expense are accounted for.

Ratios and chart

ratios-chart
Click on image to see a full-size version in a new tab.

Now we’ll look at some very basic ratios to put the Operating Budget into perspective. These ratios were designed for, and are primarily used by, for-profit businesses. But even though a church operates differently than a for-profit business – especially a manufacturing company – they still might provide a little insight and perspective for the church leaders to use in decision making.

Profit margin

Profit Margin is pretty straightforward. It’s just Net Profit ÷ Total revenue. It shows you, in percentage terms, how much revenue you bring down to the bottom line.

Times interest earned

Times Interest Earned is a ratio that focuses on your ability to cover your interest payments.

Obviously, if an organization borrows money it needs to be able to meet the additional obligations placed upon them. So Times Interest Earned shows you, by taking Operating Profit ÷ Interest Expense, how many times over your church can cover its Interest Expense.

Degree of financial leverage

The Degree of Financial Leverage shows the amplification that borrowing money can provide to profits and losses. So, for instance, in the example operating budget, the Degree of Financial Leverage is 1.4. This means, at this level of borrowing, that for every 10% change in Operating Profit, Net profit would increase by 14% (10% × 1.4).

That sounds great, but the opposite is also true. If Operating Profit declined by 10%, then this level of borrowing would cause Net profit to decrease by 14%. That’s the nature of leverage. It amplifies gains and losses.

Most people can pretty easily grasp the nature of financial leverage.

If you borrow money and get to keep the gains from the borrowed money, then financial leverage is great. If you borrow money and your investment loses value, then you not only have the loss to deal with but you also still owe for the money you borrowed.

Degree of operating leverage

What’s not so easy to grasp is the benefits and detriments of other fixed costs, besides interest payments. The Degree of Operating Leverage quantifies the benefits and detriments of incurring fixed costs.

Why are fixed costs so important? Well for lack of a better answer – because they’re fixed. You are going to pay them anyway. So, if fixed costs really help you ramp up your operating profit, then that’s great. Because fixed costs aren’t going to increase on you.

The inverse is also true. Since fixed costs don’t change,  you still have to pay them even if they are dragging operating profit down.

The Degree of Operating Leverage tells the same story as the Degree of Financial Leverage in the sense that it tells you how much greater Operating profit (not Net profit per se) would have been in the absence of fixed costs. This ratio really starts to get into detailed management accounting. That amount of detail is probably beyond the scope of this post, but since it’s included in the Executive Summary, I wanted to touch on it briefly.

In the example workbook, the Degree of Operating Leverage Is 10.2. This means then that a 10% increase in Total revenue, everything else being equal, would translate to a 102% increase in Operating Profit. Obviously, you know what that means if Total revenue went the other direction. It means that a 10.2% decrease would put Operating Profit in the red.

More about degrees of leverage

There is no good or bad Degree of Financial Leverage or Degree of Operating Leverage. It’s simply a reflection of the way your costs and borrowing affect your income statement. Leverage is great if Total revenue and Operating Profit are increasing. Leverage is bad if the outlook for the coming year is bad. So if your leverage is high and you’ve got concerns about your ability to bring in revenue for the coming year – then you’d better start looking to reduce fixed expenses and Interest Expenses.

Need help forecasting accurately? Read this post:
2 ADVANCED (BUT SIMPLE) TIME SERIES FORECASTING MODELS

Components of Operating Income chart

Finally, at the bottom of the Executive Summary, you’ll see a handy chart that will illustrate the level of revenue and expenses (broken down by broad category) for every month in the upcoming year. This allows you to visualize how all these factors, which affect the financial health of your church, are expected to fluctuate throughout the year.

Plan for every scenario your church might face

Say that creating a simplistic operating budget is working at level 1 out of 10. Completing the Spreadsheets for Business operating budget template takes you up to 7 out of 10. This next section is what will push your church up to a 10 out of 10.

On the Likely-Best-Worst Scenario worksheet, you’ll see all the information pulled in from your Pro Forma Income Statement and the subsequent ratios under the Most Likely Amount column. But, what you will have the opportunity to do here, is to imagine multiple scenarios – some good, some bad. You’ll get to picture what your Pro Forma Income Statement will look like in the best-case scenario and the worst-case scenario.

Better or worse than expected revenue and expenses

church-operating-budget-best-worst-case-scenario-expenses
Click on image to see a full-size version in a new tab.

To use this valuable worksheet, all you need to do is start with a multiplier for the best case and worst case. Obviously, the best case for revenue is going to be a positive percentage, and for expenses, a negative percentage.

On the other hand, of course, the worst case for revenues is going to be a negative percentage, and for expenses, a positive percentage. Here, you are going to have the opportunity to play around with positive and negative future outcomes, and see what feels right in terms of multipliers for revenue and expenses.

But beyond simply entering a Best Case Multiplier and a Worst Case Multiplier for revenue and expenses, you can also refine the scenarios even further. You do this by entering specific amounts in the Best Case Override Amount and Worst Case Override Amount.

What are override amounts?

It means that you can tweak the dollar amounts for revenue and expenses even further. For instance, maybe you hope that your church might be blessed with an extraordinarily high amount of revenue from trusts, investments or bequests. You can thus enter a specific amount in the Best Case Override Amount for whatever would constitute the “best case” for your church.

On the flip side, say you know that, potentially, the worst case scenario for facilities expenses is that you need to replace the church HVAC system. So, you enter an adjusted amount in the Worst Case Override Amount for facilities that reflects this added expense.

You can also tweak the override amounts for Interest Income and Interest Expense.

At the very bottom, you’ll see the effect on the ratios from the Executive Summary based on what you entered for the Best Case and Worst Case Multipliers and Override Amounts.

There’s an old saying that goes, “hope for the best, but plan for the worst”. With this scenario planner, you’re able to do just that. You’re able to protect your church from contingencies while being prepared to act accordingly if the coming year is full of blessings.

best-worst-case-scenario-ratios

Church operating budget

Maybe all of this seems overwhelming. That’s understandable if you’re not accustomed to planning with this level of detail. Again, I urge you (as the creator of this “overwhelming” budgeting template) to not overthink it.

What I do urge you to do however is to download the template at the top of the post –  and to boldly use it.

Go over it once, quickly filling in the information you have handy, then walk away from it. After that, come back to it, look at it, reflect on what you’ve already entered and make any changes you feel are necessary. Then walk away from it again.

This is (for lack of a less cliched term) “a living document”. It is designed to take the relatively simplistic information of your forecasted revenue and expenses and to do the hard work of providing valuable output. That will allow you to be proactive for the coming year and give you confidence as a leader of the church. It can help your church not only stay financially solvent but also fulfill its mission and achieve its goals.

What other (sub) categories of revenue and expenses would you include?

What percentages and amounts would your church enter to prepare for worst and best-case scenarios?

Join the conversation on Twitter!

Capital Budgeting for Churches – Are You doing it right?

capital budgeting for churches

  • A church capital budget helps you assign values to projects and prioritize which projects should move forward
  • The costs of assets, expected benefits (revenue), and ongoing cost (savings) help determine the viability of a project.
  • Net present value (NPV) and the profitability index (PI) are the primary outputs of church capital budgeting. Other outputs can help paint a picture of project desirability too.

Church capital budget explained

Now we’re getting into my wheelhouse.

Like I said before, I don’t pertain to be the greatest guru of the soft skills (mission statement, SWOT analysis, strategy formulation) covered previously. But now…now we’re breaking out the spreadsheets, and I can promise you that I can help you solves some problems when it comes to finances.

Church capital budget template download

Want to play around with the example used in this post?

Complete the form below and click Submit.
Upon email confirmation, the workbook will open in a new tab.

What is a church capital budget?

You might not know what capital budgeting is. That’s fine. When the average person hears the word “budget” they think of what money comes in during the month (sales, income, contributions) and what money goes out that same month(expenses). That’s an operational budget and we’ll cover that in a little bit.

Capital budgeting is the process by which an organization chooses which long-term projects to invest in. In a business setting things such as the time value of money, depreciation, and taxes are taken into consideration.

Capital budgeting for churches vs for-profit businesses

When conducting capital budgeting for business, projects are typically ranked based on their forecasted profitability. The projects that are thought to be the most lucrative are usually prioritized.

However, since churches are nonprofit, we’re going to have to attack this from a slightly different angle. Some projects might bring in more members and therefore more money. Other projects might help to achieve the church’s mission, but not bring in a dime. If that’s the case, we’ll have to consider other types of value besides cash money.

Capital budgeting is designed for for-profit organizations. However, with a little creativity, we should be able to tweak the process so that your church can use this powerful tool too.

You’ll be able to quantify what you foresee the expected returns to be on the big projects you want to undertake. You’ll be able to rank projects and choose how you employ your scarce resources. Best of all, you’ll be able to make wise decisions that will lead you closer to achieving your mission.

How to create a church capital budget

Big goals sometimes require big projects

Taking into consideration all of the previous steps you’ve completed in the strategic planning process (mission statement, SWOT analysis, and strategy formulation), think about what large-scale projects will need to be undertaken in light of your future plans.

Some things have probably already come to mind. Don’t systematically dismiss a particular project just because it seems infeasible. The point of the capital budgeting process is to make it obvious what projects you should pursue. So, all you’re sacrificing by running a project through this process is a bit of time.

Ultimately, you’ll want to select your projects and move on, so you can’t let this step drag on forever. But, if a project potentially plays an important part in your strategy or would help you achieve your mission, then, by all means, give it its time in the sun and then decide if it’s feasible or not.

With a list-in-hand of the projects you want to explore, let’s move on to crunching numbers.

By the way – all of the numbers you input into this workbook can be changed. So don’t overthink/over stress about any of this!

What church project will we be using as an example?

For the example used in the screenshots, we’ll keep it simple. The project will be a parking lot addition.

Our hypothetical church is seeing that membership has outgrown its existing parking resources. Many members are forced to park on the street during service. Additionally, the church leaders hope to keep the recent rate of growth up and they want to provide their members with plenty of room to park.

In light of this, they have decided to use some of their undeveloped land to add an additional 52 parking spaces.

Disposing of assets – is something being replaced?

If you’re replacing an old asset with a new one then you’ll have to input some information about the old asset. Why? Because even though an asset is being replaced, cash flow in the present and future can be affected. It’s cash flow that gives us your net present value (NPV) and NPV is how you (mostly) prioritize new projects.

*If this is starting to get too technical for your taste – hang in there. These terms will be explained in a simplified manner. Leave a comment if you have any questions.

Fortunately, for a church, the only thing we need to know about the old asset is what it can be sold for today. Since churches don’t pay taxes, none of the other information matters. Not even the original cost. Why? Because it’s a sunk cost.

So, if the old asset can be sold for cash, enter a value in the Current market value of old asset(s) field.

Disposing of assets – church parking lot

In our example, something new is being created. There’s nothing old to dispose of. Even if we were replacing an existing parking lot – old parking lots don’t have much value to anyone else.

So, in this example, the Current market value of old asset(s) is $0.

If, when you’re analyzing your church’s capital projects, you have an existing asset that might be worth something – enter the market value here. Whatever you can sell the old asset for will help offset the cost of the new asset. This will help increase NPV.

market-value-old-asset

What is a sunk cost?

Sunk costs can be tough for people to grasp and even tougher to act upon.

A sunk cost is one that’s already been incurred and should have no bearing on future decision making. Meaning – the cash has left your hands and there’s nothing can be done about that anymore.

That’s not always how people feel emotionally, but from a strictly logical standpoint – it’s true. Money spent in the past is already gone. It cannot be unspent. Only cash flows in the present and future matter.

So, if you find yourself making decisions (in your personal life or on your church’s behalf) based on the money you’ve spent in the past –  you need to stop and check yourself. Realize that nothing you do now can fix those mistakes. Base your decisions on what you can control now and in the future.

Initial cash outlay

First and foremost, what’s the new asset going to cost?

Include every expense that will need to be incurred to get this asset into service. Taxes, fees, shipping, labor…everything. These extra costs can add up and can significantly affect your decision making, so be sure to include them all.

Enter the grand total into the Cost of new asset(s) field.

Initial cash outlay – church parking lot

In our example, we’re estimating the total costs to be $208,000.

This will be enough to cover not only the parking lot itself but the design and ancillary costs too.

church-capital-budget-initial-cash-outlay

What will the salvage value of that new asset be?

Thinking about what your brand new asset might be worth when you’re done with it might seem silly. It’s so far in the future – and so hard to guess at, why bother?

Well, it is far into the future and you really can’t know what it’ll be worth. But, it will matter. Especially if it’s a higher-cost asset. Even if it will have no value in and of itself, will the scrap be worth something? Will your church be able to get anything out of this asset when it’s reached the end of its useful life?

You’re not going to be exactly right about what it’ll be worth, and that’s fine. Here’s a little trick to get you in the ballpark – start out with a number that’s absurdly high. Then, come up with a number that’s absurdly low. Start working your way back from the high number and up from the low number. When you feel like you’ve reached something feasible – go with it.

If you can’t settle on one good number then average the two numbers out if you need to. Just make sure you’re comfortable with the number when you’re done. It’s always best to be more conservative with forecasting than liberal. This gives you a margin of safety.

Once you’ve got your number, enter into the Salvage value of new asset(s) field.

Salvage value – church parking lot

Again, parking lots aren’t really worth anything to anybody else. So, unfortunately, we’ll have to enter a salvage value of $0.

church-capital-budget-salvage-value

What is the new asset’s useful life?

An asset actually has two different life spans. A depreciable lifespan and a useful lifespan.

What’s the difference?

An asset’s depreciable lifespan is the number of years an asset will take to be “written off.” Depreciation is a concept created by accountants. What it does is spread the cost of an asset over many years rather than having it hit only one year.

For example, say a company bought an asset for $50,000 with a depreciable life of 10 years. Rather than having that expense hit the year of the purchase, they would charge $5,000 to their income statement for the next ten years. The cost is spread out – not swallowed all at once.

Confused? No worries. Since you’re doing capital budgeting for a church, and aren’t subject to income taxes, you don’t have to worry about depreciable life (at least as far as the capital budget is concerned).

Okay…what about useful life? Well, depreciable life is for accounting in income statements. It’s roughly accurate but doesn’t really have any correlation to how long an asset can really be used. An asset’s useful life might be shorter or much longer than its depreciable life.

It can be hard to say how long an asset might really be useful. But, you have to put forward your best guess. I usually recommend that forecasts err on the conservative side.

Since a longer useful life will mean a higher value, I suggest you enter a value in the Useful life of new asset(s) in years that is on the low side. Start at 1 year (if an asset has a useful life of less than a year, it probably doesn’t belong in the capital budget) and work your way up. Once you hit a number that isn’t on the absurdly low side, you’re probably pretty close to a nice and conservative estimate.

Useful life – church parking lot

A quick Google search reveals that the expected useful life of a paved parking lot is 10-15 years. Since our example church wants to get the most out of its investment, we’ll enter a useful life of 15 years. This will require a commitment to proper maintenance and will cause the church to incur additional costs – which we’ll address later.

church-capital-budget-useful-life

How much of a return does your church want on its capital projects?

Time, money, and other resources are limited. Not just for you and your church, but for everyone.

In order for a project to “make sense,” it has to eclipse a minimum acceptable rate of return.

For instance –  if your church was presented with the “opportunity” to invest $1,000 and you were promised $1,050 in ten years, you would probably pass. Why? Because it’s just not worth it to tie up that $1,000 for a decade and to only receive 5% (about .5% per year) back for doing so. That money could be used for something more worthwhile now.

So, you might not know exactly what your hurdle rate (minimally acceptable rate of return) is, but you probably know it’s more than .5%.

If your church borrows money, keep in mind what you’re interest rate is – you’ll want your hurdle rate to be at least that much. Otherwise, you’re not getting a good return on investment on that borrowed money.

Other than that, I can’t say what your hurdle rate should be. This is a very subjective thing. Every church will be different.

I would recommend that you undertake the same exercise I suggested for determining the useful life of the asset – start at 1% and work your way up. Once you say “okay, I suppose I could live with that return,” then you’re probably in the neighborhood of a practical hurdle rate.

If you want to be a little extra conservative (and I would recommend as much) then go ahead and tack on a little extra to your rate. For instance, if your hurdle rate is 5%, maybe up it to 5.5%. If it’s 8% consider increasing it to 8.8%.

This tiny increase puts just a little more pressure on your projects to perform better in order to be accepted.

When you’ve finally settled on a hurdle rate enter it into the Hurdle rate field.

Hurdle rate – church parking lot

The rule-of-thumb is – the riskier the project, the higher the hurdle rate.

A parking lot might not seem like a particularly risky project. But, as you’ll see, justifying its construction is contingent upon church membership continuing to increase. That might seem likely for our example church, but it’s no sure thing.

An 8% hurdle rate seemed reasonable under the circumstances. However, that was bumped up to 8.8% to provide a little more room for error on the part of the projected cash flows.

-hurdle-rate

The most important part of a church capital budget – the forecasted cash flows

As I’ve mentioned before – investments are defined, ultimately, by three variables. Cash in, cash out, and time. Notice I said “cash.” Not sales, not promises, not receivables.

Cash.

This step involves all three variables. Cash flow out, cash flow in, and the timing of each.

Cash outflows

Most projects will incur more costs than those required up-front. Many times costs are necessary as a part of the ongoing project.

The types of costs can vary. Here are some ideas for ongoing costs that a church may incur as a result of undertaking a new project:

  • wages and fringes
  • maintenance
  • utilities
  • supplies
  • insurance
  • interest
  • leases
  • advertising

And on and on…

I cautioned you to not overthink any of these steps earlier, and I stand by that. However, make sure you think this part through thoroughly. Overlooking expenses and not including them in your church capital budget can make a project look more attractive then it actually is. You don’t want to be ten years into a project and realize that there were expenses you never accounted for.

Next, think about the timing of the expenses. Are they monthly, weekly, yearly, or erratic? The capital budgeting worksheet is set up to look at cash flows yearly; not monthly or weekly. So, if monthly or weekly cash flows are expected, you’ll have to multiply them by 12 or 52 respectively.

Finally, keep in mind that costs tend to rise over time. A capital budget forecasts many years into the future. What cost $100 today could cost $125 or more fifteen years from now. Be sure to account for inflation – which traditionally runs 1% to 3% per year.

The future cash flow worksheet

The Future CF Worksheet is a scratchpad you can use to itemize costs, revenue and cost savings. None of the information entered here will affect the rest of the workbook.

Use the Comments field to enter your own notes about the expected future cash flows. This is useful because you can refer back to this information if you ever have a “what was I thinking…” moment.

future-cash-flow

Once you feel you have a sound (conservative) forecast of the cash outflows, enter these amounts in the Additional costs column. Keep in mind that these values need to be entered as a negative number. Don’t worry about messing that up, though. The workbook has data validation rules that will prevent you from entering a positive number in this column.

The capital budgeting workbook is set up to only accept Additional costs for as many years as you said the asset would have a useful life. So, if you entered “15” as the Useful life of new asset(s) in years, you can enter 16 years worth of expenses, but Year 16 won’t be included in any of the calculations.

Cash outflows – church parking lot

More parking lot means more parking lot maintenance. For starters, I assumed that there would be additional costs for snow removal every year. This was estimated to be $450 in Year 01 and increase by 2% every year thereafter.

If this were a real church performing this capital budgeting, I would caution them to not enter their entire expected snow removal expense here. The costs tied to the existing parking doesn’t matter in this analysis. They’re going to pay that anyway. Only expenses (and revenues and savings) tied to this project should be considered.

Parking lots also need to be restriped to keep them looking good and resealed to keep them from deteriorating.

Restriping was estimated to take place every three years starting in Year 03. This cost was also expected to grow at 2% annually, or 6.1% every three years.

Resealing was expected to take place every three years starting in Year 04. The cost was expected to be $2,850 at that time and then, you guessed it… increase at a 2% annual rate.

Okay, we got the negative cash flows (the costs) out of the way, let’s move on to the cash inflows.

*This is a long post. Click here to read Page 2.